
Siemens Energy stock forecast: Omterra separation plans
Siemens Energy is preparing to separate its Transformation of Industry division as Omterra. It plans to retain a minority stake while seeking external investment. Explore third-party ENR price targets and technical analysis. Past performance is not a reliable indicator of future results.
Siemens Energy AG (ENR) traded at €145.93 on 9 September 2026, within an intraday range of €144.82–€149.11. Past performance is not a reliable indicator of future results.
Siemens Energy is preparing to legally and operationally separate its Transformation of Industry division into a standalone entity, initially branded Omterra (Siemens Energy, 25 August 2026). The company plans to retain a minority stake while exploring external investment or a capital-markets transaction for the unit. The division employed around 17,000 people and generated €5.7bn in fiscal 2025 revenue, with an 11.3% profit margin (Bloomberg, 25 August 2026). Siemens Energy also reported a record €162bn order backlog in Q3 FY2026 (Siemens Energy, 5 August 2026), while analysts continue to assess the potential impact of the separation (Ad-Hoc News, 7 September 2026).
Third-party ENR outlook: restructuring, record orders
As of 9 September 2026, third-party Siemens Energy stock predictions reflect different assumptions around its order backlog, restructuring, margins and demand for gas turbines and grid infrastructure.
Morgan Stanley
Morgan Stanley maintains a buy rating with a €195 target, down from €200. The view follows Siemens Energy's fiscal third-quarter results and reflects assumptions around margin progression in its power generation and grid technologies businesses (Investing.com, 6 August 2026).
Deutsche Bank Research
Deutsche Bank Research maintains a buy rating and €210 target. The bank cites Siemens Energy's record order backlog as a factor supporting revenue visibility (The Globe and Mail, 27 August 2026).
Jefferies
Jefferies maintains a buy rating while trimming its target to €210 from €215. The revision followed share-price gains and a reassessment of potential upside (MarketScreener, 31 August 2026).
JPMorgan
JPMorgan maintains an overweight rating with a €245 target. Analyst Phil Buller cites expectations for gas-turbine demand, including power infrastructure linked to data centres, as a factor in the outlook (MarketScreener, 2 September 2026).
Predictions and third-party forecasts are inherently uncertain, as they cannot fully account for unexpected market developments. Past performance is not a reliable indicator of future results.
Siemens Energy latest and upcoming earnings
Siemens Energy reported Q3 FY2026 results on 5 August for the period ended 30 June. Orders rose 19% year on year to €17.9bn, revenue increased 19% to €11.4bn and profit before special items more than tripled to €1.6bn, representing a margin of 14.2% (Siemens Energy, 5 August 2026).
Free cash flow before tax rose to €2.3bn from €0.4bn a year earlier, while Siemens Gamesa recorded its first profitable quarter since Q4 FY2022.
Siemens Energy reaffirmed full-year guidance for 14%–16% revenue growth and a profit margin before special items of 10%–12%, while raising its Grid Technologies margin outlook to 18%–20%. Management continues to expect net income of around €4bn and free cash flow before tax of around €8bn, although it expects Q4 to be seasonally softer than Q3.
Fourth-quarter and full-year results are due on 11 November 2026.
Siemens Energy stock price: technical overview
As of 1:59pm UTC on 9 September 2026, the ENR stock price trades at €145.93, below its 20-, 50-, 100- and 200-day simple moving averages at approximately €151, €152, €160 and €151 respectively, according to TradingView. Its 200-day exponential moving average sits closer to the latest price at around €145.
The 14-day relative strength index (RSI) stands at 43.45, within neutral territory, while the average directional index (ADX) at 10.43 indicates relatively limited trend strength.
Higher technical references include the classic pivot near €150.06, the moving-average cluster around €151–€152 and R1 near €157.98, followed by R2 around €173.78. Below the latest price, the 200-day EMA near €145 provides a nearby reference, with S1 around €134.26 further down.
A rise could bring the pivot and moving-average cluster into focus, while a move lower could shift attention towards €134.26. These are technical reference points rather than predictions (TradingView, 9 September 2026).
This is technical analysis for informational purposes only and does not constitute investment advice or a recommendation to buy or sell any instrument.
ENR share price history (2024–2026)
ENR’s stock price has moved substantially over the past two years. The stock traded around €24.90 on 10 September 2024 and rose to €91.20 by 9 September 2025, during a period of improving profitability across its grid technology and gas services businesses.
Shares fell to an intraday low of €41.94 on 7 April 2025 amid wider market volatility before recovering. The move continued into 2026, with the stock reaching a two-year closing high of €189.51 on 7 May alongside higher orders and demand for grid and power infrastructure.
Siemens Energy subsequently pulled back from its spring high, trading broadly between €130–€175 through the summer as investors assessed the planned Transformation of Industry separation. The stock closed at €146.27 on 9 September 2026, around 18.9% higher year to date and roughly 60.4% higher year on year, though still below its 2026 high.

Past performance is not a reliable indicator of future results. Share prices are indicative and may differ from live market prices.
Siemens Energy (ENR): Capital.com analyst view
Siemens Energy shares have risen considerably over the past two years, alongside sharp moves in both directions. The gains have coincided with a record €162bn order backlog and improved profitability across several businesses, including Siemens Gamesa.
Continued grid investment, gas-turbine demand and data-centre power requirements could support orders and the share price if demand develops as expected. Conversely, weaker customer spending, slower order conversion or margin pressure could weigh on the shares.
The planned Transformation of Industry separation adds another variable. A smooth process or favourable transaction terms could support sentiment, while delays, execution difficulties or weaker terms could put pressure on the stock.
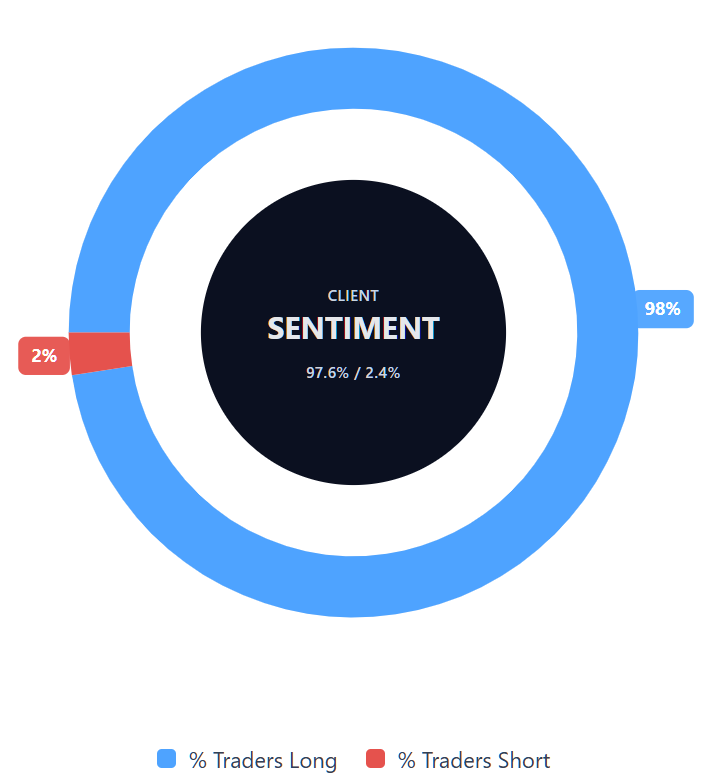
Capital.com’s client sentiment for Siemens Energy CFDs
As of 9 September 2026, Capital.com client positioning in Siemens Energy CFDs is weighted towards long positions, with 97.6% long and 2.4% short. This reflects open positions on Capital.com as of 9 September 2026 rather than future price direction and can change.
Summary – Siemens Energy 2026
- As of 1:59pm UTC on 9 September 2026, Siemens Energy traded near €145.93, within an intraday range of €144.82–€149.11.
- According to TradingView, the price was below its main moving averages, with RSI at 43.45 and ADX at 10.43, indicating limited trend strength.
- Key factors include the planned Transformation of Industry separation, the €162bn order backlog and demand across grid and power infrastructure.
- Higher orders, stronger margins or a smooth restructuring could support sentiment, while weaker demand or execution risks could weigh on the shares.
- Recent attention centres on fiscal third-quarter results, the Omterra separation plans and differing analyst views on valuation and execution.
Past performance is not a reliable indicator of future results.
FAQ
Who owns the most Siemens Energy stock?
This article does not identify Siemens Energy's largest shareholder or provide a breakdown of its ownership structure. Instead, it focuses on share-price performance, earnings, restructuring plans, order growth and third-party analyst forecasts. Ownership can change as institutional and other investors adjust their holdings, so current shareholder disclosures would need to be checked separately when assessing which investor holds the largest stake in Siemens Energy.
What is the five-year Siemens Energy share price forecast?
The article does not provide a five-year ENR stock forecast. The third-party estimates covered here focus mainly on 12-month targets, ranging from €195–€260, with a 25-analyst average of €196.32. Longer-term forecasts carry greater uncertainty because demand, margins, restructuring, order conversion and infrastructure spending can change materially over several years. These estimates should therefore be treated as scenarios rather than reliable long-term predictions.
Is Siemens Energy a good stock to buy?
This article does not classify Siemens Energy as a good or bad stock to buy. Higher orders, stronger margins, continued grid investment or a smooth restructuring process could support sentiment, while weaker demand, slower order conversion, margin pressure or execution difficulties could weigh on the shares. Analyst targets also vary considerably. These factors provide context for assessing Siemens Energy's outlook but do not amount to an investment recommendation.
Could Siemens Energy stock go up or down?
Yes. Siemens Energy shares can move in either direction as company-specific and wider market conditions change. Stronger gas-turbine demand, higher grid investment, improved margins or favourable restructuring terms could support the price. Conversely, weaker customer spending, slower order conversion, execution issues or less favourable separation terms could weigh on it. Technical levels may also influence short-term trading activity, but they are reference points rather than reliable predictions.
Should I invest in Siemens Energy stock?
Whether Siemens Energy shares are suitable for you depends on your circumstances, objectives and tolerance for risk, and this article does not provide investment advice or a personal recommendation. Factors to consider include order growth, margins, cash flow, demand for grid and gas-turbine infrastructure, and execution of the Transformation of Industry separation. Each could influence the share price positively or negatively, while unexpected market or company developments may change the outlook.
Can I trade Siemens Energy CFDs on Capital.com?
Yes, you can trade Siemens Energy CFDs on Capital.com. Trading share CFDs lets you speculate on price movements without owning the underlying asset and to take long or short positions. However, contracts for difference (CFDs) are traded on margin, and leverage amplifies both profits and losses. You should ensure you understand how CFD trading works, assess your risk tolerance, and recognise that losses can occur quickly.