Puma stock forecast: Third-party price targets
Puma SE is a Germany-listed sportswear manufacturer focused on athletic footwear, apparel and accessories, with operations and distribution spanning Europe, the Americas and Asia-Pacific. Explore third-party PUM price targets and technical analysis.
Puma SE (PUM) is trading around €23.05 in US dollar terms as of 12:19pm on 4 February 2026 (UTC), moving within an intraday range of €22.10–€23.15 on Capital.com’s feed. Past performance is not a reliable indicator of future results.
The stock is trading against a backdrop of softer domestic consumer conditions and mixed company fundamentals. Germany’s retail industry association, HDE, projects around 2% nominal revenue growth for the sector in 2026, following a 3.8% rise in 2025, suggesting subdued real spending (Reuters, 2 February 2026). Puma previously reported a 4.3% year-on-year decline in revenue for the first nine months of 2025 to about €5.97bn, alongside a swing to a small negative EBIT margin. The results reflected weaker demand across regions and product categories (Puma, 29 September 2025).
Puma stock forecast 2026–2030: Third-party price targets
As of 4 February 2026, third-party Puma stock predictions reflect differing views on the company’s post-reset trajectory and the broader consumer demand backdrop. The snapshots below summarise selected third-party targets, associated timeframes and stated rationales, expressed in euro terms unless otherwise noted.
MarketScreener (consensus snapshot)
MarketScreener reports that the average 12-month PUM stock forecast stands at around €24.38. Individual broker targets range from €16 to €40, based on 17 analyst contributions. The platform notes an ‘Outperform’ mean recommendation, reflecting diverging views on the pace of margin recovery and revenue growth across key regions (MarketWatch, 31 January 2026).
Deutsche Bank Research (single-stock coverage)
Deutsche Bank Research maintains a Hold rating on Puma, with a target price of €16. The bank highlights Anta’s proposed stake purchase and the revised shareholder structure as supportive of ongoing restructuring, while noting limited scope for further strategic changes before 2027 (MarketScreener, 27 January 2026).
UBS (broker update)
UBS reiterates a Neutral rating on Puma SE, with an unchanged target price of €19.60. The bank characterises the outlook as balanced, citing uncertainty around consumer demand and competitive pressures within the global sportswear market (MarketScreener, 15 January 2026).
MarketWatch (PMMAF line, US-dollar consensus)
MarketWatch reports that the average target price for Puma’s US OTC listing (PMMAF) stands near $26.81, based on 17 analyst ratings. The estimates relate to the company’s financial year ending December 2025, as analysts assess near-term earnings risks alongside longer-term brand and distribution initiatives (MarketWatch. 29 January 2026).
Predictions and third-party forecasts are inherently uncertain, as they cannot fully account for unexpected market developments. Past performance is not a reliable indicator of future results.
PUM stock price: Technical overview
The PUM stock price is trading near €23.05 as of 12:19pm (UTC) on 4 February 2026, holding above a cluster of rising daily simple moving averages. The 20-, 50-, 100- and 200-day SMAs are grouped around approximately 22.3, 21.3, 20.6 and 21.1, respectively. The near-term structure remains supported while price holds above this moving-average band, with the 10-day SMA and EMA also close by around 22.1–22.4.
Momentum indicators show the 14-day RSI near 54.5, placing it in the upper-neutral zone, while the ADX around 17.5 suggests that a trend is present but not strongly established. On the upside, the classic R1 pivot near 25.8 represents a first reference point, with R2 around 30.0 coming into view only on a sustained daily close above that level. On pullbacks, initial support is located near the classic pivot around 22.0, followed by the 100-day SMA near 20.6. A sustained break below this area could expose the S1 zone around 17.9 (TradingView, 4 February 2026).
This technical analysis is provided for informational purposes only and does not constitute financial advice or a recommendation to buy or sell any instrument.
Puma share price history (2024–2026)
PUM’s stock price has experienced notable volatility over the past two years, with periods of sharp declines followed by recoveries as sentiment around the brand and the wider retail environment has shifted. From mid-2025, the stock fell from levels above €24 in July to lows near €15.55 in late November, before recovering into year-end with prices around €22.20 by 30 December 2025.
In early 2026, volatility increased again. The price slipped below €19 in late January before rebounding, closing near €23 on 4 February 2026, not far from an early-February high of €23.90.
Past performance is not a reliable indicator of future results. Share prices are indicative and may differ from live market prices.
Puma (PUM): Capital.com analyst view
Puma’s share price has been rebuilding following a challenging 2025, with trading around €23.05 on 4 February 2026 reflecting a recovery from mid-teens lows seen in November. Recent price action has also been shaped by heightened volatility and large single-day moves in late January. Investors continue to weigh the company’s reset phase and cost measures against a still-challenging consumer backdrop. Germany’s retail association HDE projects around 2% nominal revenue growth for 2026, equivalent to roughly 0.5% in real terms. While a stabilising macro environment could support demand for sportswear, weaker real spending and cautious household budgets may continue to limit discretionary purchases.
From a company perspective, Puma has described 2025 as a reset year, guiding for lower sales and an expected EBIT loss as it works through elevated inventories, restructures parts of the business and invests in brand and distribution. These actions may support leaner operations over time if execution and demand conditions improve. However, they also involve execution risk, potential near-term margin pressure and uncertainty around how quickly consumers in key markets such as the US, China and Europe respond to new initiatives.
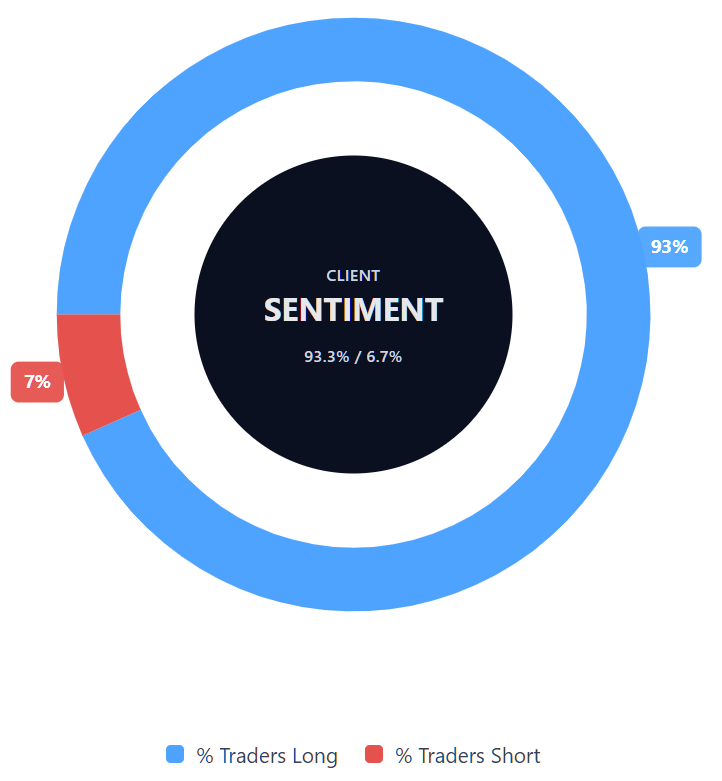
Capital.com’s client sentiment for Puma CFDs
As of 4 February 2026, Capital.com client positioning in Puma CFDs shows 93.3% buyers versus 6.7% sellers, indicating a heavily skewed long bias at the time of measurement. This snapshot reflects open positions on the platform and may change as market conditions evolve.
Summary – Puma 2026
- Puma’s share price spent much of 2025 trading in the high-teens to low-20s range, falling toward €15.55 in November before recovering above €22 by year-end.
- By 4 February 2026, the price stood near €23.05, reflecting a rebound from late-2025 lows alongside renewed volatility in January 2026.
- Overall, 2025 marked a reset phase for Puma, with management signalling weaker sales and margin pressure alongside restructuring and cost-control measures.
Past performance is not a reliable indicator of future results.
FAQ
Who owns the most Puma stock?
Puma SE has a diversified shareholder base, with significant holdings split between strategic investors, institutional shareholders and free-float investors. One of the largest strategic interests comes from the Pinault family, through its investment vehicle, which has historically acted as a long-term shareholder. Other notable stakes are held by global asset managers and pension funds, while a substantial proportion of shares trade freely on public markets, supporting ongoing liquidity and regular price movement.
What is the five-year Puma share price forecast?
There is no single, widely agreed five-year PUM stock forecast. Longer-term projections tend to vary significantly, as they depend on assumptions around consumer demand, brand positioning, cost control and broader economic conditions. Most published forecasts focus on shorter horizons, typically around 12 months. Over longer periods, outcomes may differ materially from expectations due to changes in strategy, competition, currency movements and macroeconomic developments.
Is Puma a good stock to buy?
Whether Puma is considered attractive depends on individual circumstances, risk tolerance and market outlook. Analysts currently express a wide range of views, reflecting uncertainty around the company’s reset phase, margin recovery and demand trends. Some see potential upside if restructuring efforts gain traction, while others remain cautious due to competitive pressures and constrained consumer spending. This information is general in nature and does not constitute investment advice.
Could Puma stock go up or down?
Puma’s share price could move in either direction, as it is influenced by multiple factors. These include company earnings, progress on restructuring, shifts in consumer demand, competitive dynamics within the sportswear sector and broader market conditions. Short-term price movements may also reflect sentiment, news flow and revisions to analyst expectations. As with all equities, price volatility means outcomes can differ from forecasts.
Should I invest in Puma stock?
Deciding whether to invest in Puma stock requires consideration of personal financial objectives, time horizon and tolerance for risk. Puma operates in a competitive and cyclical industry, and its shares have experienced periods of significant volatility. Market participants typically assess factors such as financial performance, balance sheet strength and external conditions when forming a view. This content is provided for information only and should not be interpreted as a recommendation.
Can I trade Puma CFDs on Capital.com?
Yes, you can trade Puma CFDs on Capital.com. Trading share CFDs lets you speculate on price movements without owning the underlying asset and to take long or short positions. However, contracts for difference (CFDs) are traded on margin, and leverage amplifies both profits and losses. You should ensure you understand how CFD trading works, assess your risk tolerance, and recognise that losses can occur quickly.