Nordex stock forecast: Third-party price targets
Nordex SE is a German-based wind turbine manufacturer listed in Frankfurt, supplying onshore wind systems and services, with its shares actively traded and analysed across European equity markets. Explore third-party NDX1 price targets and technical analysis.
Nordex SE (NDX1) is quoted at €32.25 as of 10:12am UTC on 4 February 2026, trading below its stated intraday range of €34.23–€35.08 on Capital.com’s platform. Past performance is not a reliable indicator of future results.
Trading is taking place amid a series of recent company updates, including Nordex’s announcement on 3 February 2026 that it secured a 189 MW order from Swedish renewable energy company OX2 for the Fageråsen wind farm, as well as earlier disclosures highlighting solid order intake in late 2025 and into early 2026 (Nordex, 3 February 2026). Broader sentiment toward German equities is also supportive, with Germany’s main DE40 equity index around 24,924 points on 4 February 2026, up 0.58% from the previous session (Trading Economics, 4 February 2026).
Nordex stock forecast 2026–2030: Third-party price targets
As of 4 February 2026, third-party Nordex stock predictions indicate a wide dispersion of 12-month views, reflecting differing assumptions around order growth, profitability, and policy support for wind power. The following summaries highlight selected third-party targets and the context they cite, all based on dated publications from this period.
Jefferies (broker research)
Jefferies reiterates its buy stance and maintains a €38 price target, noting that the investment case remains anchored in scale, pipeline visibility, and operating leverage as project volumes ramp. The summary highlights that the target assumes continued progress on profitability and stable policy support, with risks tied to input costs and competitive pricing (MarketScreener, 28 January 2026).
MarketWatch (US-listed line, NRDXF)
MarketWatch’s analyst estimates section for Nordex’s over-the-counter line NRDXF reports an average 12-month target of about $31.57, with a high estimate of $38 and a low of $15.80 in early 2026. The site explains that these targets aggregate several analysts’ valuations and are periodically revised as new financial and sector data become available (MarketWatch, 4 February 2026).
Fintel (target list – prior baseline)
Fintel’s NDX1 stock forecast summary shows an average one-year price target of €31.89 with a range from €15.96 to €39.90, illustrating how earlier expectations sat below the more recent January 2026 cluster. The service describes price targets as analysts’ assessments of fair value relative to projected and historical earnings, and notes that these may be revised as new information emerges (Fintel, 4 February 2026).
Predictions and third-party forecasts are inherently uncertain, as they cannot fully account for unexpected market developments. Past performance is not a reliable indicator of future results.
NDX1 stock price: Technical overview
The NDX1 stock price is trading around €32.25 as of 10:12am UTC on 4 February 2026, holding above a rising cluster of simple moving averages, with the 20/50/100/200-DMAs near approximately €33.0 / €29.9 / €26.9 / €22.9. This keeps the broader daily trend broadly constructive, with the 20-over-50 alignment intact and the 14-day RSI around 65.9, signalling upper-neutral to firm momentum alongside an ADX near 35, which points to an established trend rather than a range.
On the topside, the nearest classic resistance sits at R1 around €36, with R2 near €38.20 coming into view only if a daily close above the first barrier is sustained. On pullbacks, the classic pivot at €32.56 marks initial support, with the 100-day SMA near €26.86 forming the next notable moving-average shelf and S1 down at €30.36 acting as a further downside reference if the pivot area gives way on a closing basis (TradingView, 4 February 2026).
This is technical analysis for informational purposes only and does not constitute financial advice or a recommendation to buy or sell any instrument.
Nordex share price history (2024–2026)
NDX1’s stock price spent much of early 2024 trading in the low double digits, closing at €9.31 on 6 February 2024 after a choppy spell between about €9.30 and €10.80 over the month. From there, the stock gradually moved higher through the year, reaching the mid-teens by late March and finishing 2024 around the mid-€11s, before accelerating more sharply in 2025 as prices climbed from roughly €11.75 in early January to about €26.07 by early December.
The rally extended into late 2025 and early 2026, with Nordex pushing from around €25–€29 in December 2025 to above €30 in January 2026, then extending further to a close of €34.36 on 4 February 2026. Over the full two-year window, this leaves the share price more than tripling from early-2024 levels, with the steepest gains concentrated in the 12 months from February 2025 to February 2026 as market perceptions toward the company evolved.
Past performance is not a reliable indicator of future results. Share prices are indicative and may differ from live market prices.
Nordex (NDX1): Capital.com analyst view
Nordex’s share price has staged a notable recovery over the past two years, rising from single-digit levels in early 2024 to trade in the mid-€30s by early February 2026, with the latest close at €34.36 on 4 February 2026. This upswing has gone hand in hand with improving technical signals and stronger trading activity, but it also means the stock has already reflected a sizeable shift in sentiment, leaving it more exposed to pullbacks if expectations around growth, margins, or sector conditions are not met.
From a drivers perspective, Nordex sits at the intersection of several supportive themes, including the build-out of renewable energy capacity and ongoing policy focus on decarbonisation, which can underpin demand for wind equipment over the medium term. At the same time, the business remains sensitive to project delays, input-cost pressures, competition, and broader equity-market risk appetite, meaning that the same macro or policy shifts that support the name could also weigh on pricing if they weaken order pipelines or compress profitability.
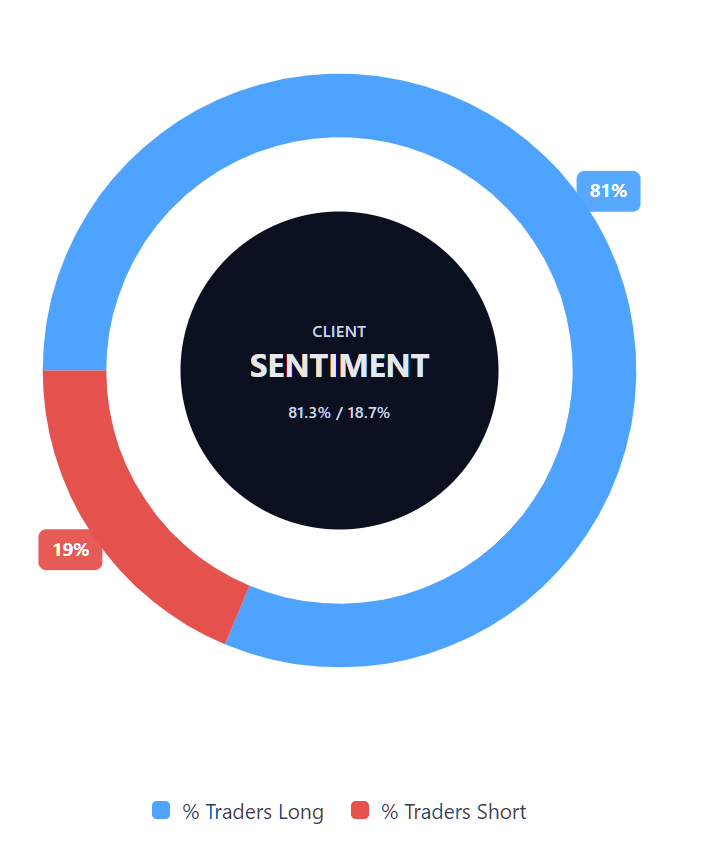
Capital.com’s client sentiment for Nordex CFDs
As of 4 February 2026, Capital.com client positioning in Nordex CFDs is one-sided toward longs, with 81.3% buyers versus 18.8% sellers, which puts buyers ahead by 62.5 percentage points. This places sentiment in a heavy-buy positioning zone, indicating that most open positions are aligned with expectations of further upside, while a smaller minority is positioned for price declines. This snapshot reflects open positions on Capital.com and can change.
Summary – Nordex 2026
- Nordex (NDX1) has climbed from low double digits in early 2024 to the mid-€30s by early February 2026, reflecting a strong two-year rebound in the share price.
- Technicals remain broadly supportive, with price holding above rising 20/50/100/200-day moving averages and firm trend signals from RSI and ADX on the daily chart.
- Key fundamental drivers include order momentum and policy support for renewables, while risks centre on project delays, input-cost pressures, competition, and broader equity-market conditions.
Past performance is not a reliable indicator of future results.
FAQ
Who owns most Nordex stock?
Nordex SE has a widely distributed shareholder base, with ownership spread across institutional investors, asset managers, and retail shareholders. No single shareholder publicly reports a controlling majority stake. Larger institutional holders tend to include European investment funds that track industrial, renewable energy, or mid-cap equity benchmarks. Ownership levels can change over time as funds rebalance portfolios, while insider ownership remains relatively limited relative to total shares outstanding.
What is the five-year Nordex share price forecast?
There is no consolidated or widely published five-year NDX1 stock forecast, as most analyst estimates focus on shorter, typically 12-month, horizons. Longer-term expectations depend on variables such as order intake, execution, profitability trends, policy support for renewables, and broader market conditions. As a result, longer-range projections tend to vary significantly and are generally less precise, with forecasts becoming more assumption-driven as the timeframe extends.
Is Nordex a good stock to buy?
Whether Nordex is a suitable stock depends on individual objectives, time horizon, and risk tolerance. Analysts highlight potential opportunities linked to renewable energy demand and order momentum, while also noting risks such as margin pressure, project execution challenges, and sector competition. Recent price gains suggest that expectations have already shifted meaningfully, which may increase sensitivity to disappointments. This information is provided for general market context only and is not investment advice.
Could Nordex stock go up or down?
Nordex’s share price can move in either direction, influenced by company performance, sector developments, policy changes, and broader equity-market conditions. Positive order announcements, improving margins, or supportive regulation may influence price movements, while cost inflation, delays, or weaker demand could weigh on the share price. Like all equities, Nordex remains exposed to volatility, and past performance does not indicate future outcomes.
Should I invest in Nordex stock?
Deciding whether to invest in Nordex requires an assessment of personal financial circumstances and an understanding of the risks involved. The company operates in a sector associated with long-term structural themes but also faces cyclical and execution-related challenges. Share prices can fluctuate sharply, and outcomes may differ from expectations. This content is for informational purposes only and does not constitute a recommendation or financial advice.
Can I trade Nordex CFDs on Capital.com?
Yes, you can trade Nordex CFDs on Capital.com. Trading share CFDs lets you speculate on price movements without owning the underlying asset and to take long or short positions. However, contracts for difference (CFDs) are traded on margin, and leverage amplifies both profits and losses. You should ensure you understand how CFD trading works, assess your risk tolerance, and recognise that losses can occur quickly.