
Japan 225 forecast: Strait of Hormuz oil shock
Japan 225 is a Japanese equity index that is trading against a backdrop of higher oil prices, yen weakness and a fresh focus on earnings in the US and Japan. Past performance is not a reliable indicator of future results. Explore third-party J225 predictions and technical analysis.
The Nikkei 225 index – referred to as the Japan 225 (J225) on CFD trading platforms such as Capital.com – is trading at 56,667.2 JPY in early European trading as of 10:44am UTC on Monday 13 April 2026, within an intraday range of 55,885.9–57,400.4 JPY. Past performance is not a reliable indicator of future results.
Pressure on the index reflects a renewed surge in crude oil prices after President Trump announced a blockade of the Strait of Hormuz following the breakdown of US-Iran talks in Pakistan over the weekend (Bloomberg, 12 April 2026). With WTI rising above $104.3 per barrel and Brent crossing $101 per barrel, higher energy prices may weigh on Japan's heavily import-dependent economy (Invezz, 13 April 2026). The yen also came under selling pressure amid higher oil costs, with USD/JPY trading near 159 as of 9 April, as currencies of oil-importing nations typically weaken in high-energy-price environments (Mitrade, 9 April 2026). Earnings season adds a further focus, with Goldman Sachs scheduled to report Q1 2026 results on 13 April and JPMorgan Chase on 14 April, while key Japanese corporates are set to disclose figures later in the month (AlphaStreet, 9 April 2026).
Japan 225 forecast 2026–2030: Third-party targets
As of 13 April 2026, third-party Japan 225 predictions reflect a market navigating the crosscurrents of Japan's fiscal stimulus programme, a geopolitically driven oil price surge above $100 per barrel, and yen weakness near 160 JPY against the dollar.
Financial Forecast Center (quantitative monthly model)
Financial Forecast Center models an April 2026 monthly average of approximately 58,347 JPY for the Nikkei 225, with the forecast rising to around 59,005 JPY in May 2026 and edging towards 59,298 JPY by October 2026; the April estimate carries an average error margin of plus or minus 562 points. The model applies quantitative statistical methods to historical index data, with no fundamental macro assumptions stated (Financial Forecast Center, 9 March 2026).
Long Forecast (algorithmic monthly model)
Long Forecast sets an April 2026 close of approximately 52,922 JPY, within a monthly range of 47,953 – 59,682 JPY, before projecting a partial recovery to around 52,419 JPY in May 2026 and a more substantial rebound to 70,413 JPY by year-end 2026. The model uses a proprietary algorithmic approach applied to historical price series, with no stated fundamental inputs (Long Forecast, 7 April 2026).
BYDFi (April 2026 intelligence brief)
BYDFi notes that institutional analysts, including those from Nomura and Bank of America, maintained year-end 2026 Nikkei 225 targets in the 55,500 – 60,000 JPY range, citing the 6.4 trillion JPY 'Sanaenomics' fiscal stimulus package as a structural floor amid the current corrective phase. The brief flags immediate resistance at 54,095 JPY and a critical support floor at 52,070 JPY, below which the 200-day moving average at approximately 48,835 JPY would become the next key reference, attributing the corrective phase to the geopolitical oil price shock following the US-Iran conflict (BYDFi, 8 April 2026).
Trading Economics (short-term data update)
Trading Economics reported that the Nikkei 225 closed at 56,948 JPY, a gain of 1,052 points, or 1.88%, on the session and the highest level since early March 2026, led by gains in Fast Retailing (+11.12%), Fujikura (+11.08%), and Mitsui Mining and Smelting (+6.47%). The move reflected a partial recovery from the index's early-April lows, with the four-week gain to that point standing at 6.53% (Trading Economics, 8 April 2026).
Invezz (April session analysis)
Invezz reports that the Nikkei 225 slipped in early trading as crude oil prices surged following the Trump administration's announcement of a Strait of Hormuz blockade, with Brent crossing $101 per barrel and WTI above $104 per barrel, compounding cost pressures on Japan's energy-dependent economy. The report notes that the index had traded near 56,216 JPY in recent sessions, with analysts referencing the 54,095 JPY resistance level and the 52,070 JPY support floor as the key near-term range boundaries (Invezz, 13 April 2026).
Predictions and third-party forecasts are inherently uncertain, as they cannot fully account for unexpected market developments. Past performance is not a reliable indicator of future results.
J225 index price: Technical overview
The J225 index trades at 56,667.2 JPY as of 10:44am UTC on 13 April 2026, according to Capital.com's quote feed. All moving average readings below are drawn from TradingView's indicator suite.
On the daily chart, the index remains above all key simple moving averages, with the 20/50/100/200-day SMAs sitting at approximately 53,631 / 54,905 / 52,946 / 48,358 JPY in a fully bullish alignment across the entire MA stack. The Hull moving average (9) at 56,729 JPY registers a buy signal and currently runs just above the latest close, reinforcing the near-term constructive posture. The Ichimoku base line at 53,786 JPY reads neutral, indicating that the index remains within the cloud structure on that measure.
Momentum is broadly supportive without being stretched: the 14-day relative strength index sits at 60.19, consistent with an upper-neutral reading, while the average directional index at 21.47 suggests trend strength is present but not yet established above the 25 threshold.
To the upside, the classic R1 pivot at 56,100 JPY sits just below the latest close, with R2 at 61,136 JPY coming into view on a sustained daily close above that level. On pullbacks, the classic pivot point at 53,329 JPY represents initial reference support, followed by the 100-day SMA shelf near 52,946 JPY. A move below that shelf would bring S1 at 48,293 JPY into consideration as the next meaningful reference (TradingView, 13 April 2026).
This is technical analysis for informational purposes only and does not constitute financial advice or a recommendation to buy or sell any instrument.
Japan 225 index history (2024–2026)
The Japan 225 index has had an eventful two years, swinging between sharp tariff-driven sell-offs and post-election rallies linked to Japan's fiscal pivot.
The index opened April 2024 near 39,020 JPY and held a tight range through most of mid-2024 before a violent unwind in early August 2024, when it dropped to a session low of 30,385.2 JPY on 5 August. It was its sharpest single-day collapse in decades, after a surprise Bank of Japan rate hike and a surging yen triggered a rapid unwind of leveraged carry trades. The index recovered through the rest of 2024, closing the year at 39,428.4 JPY on 31 December 2024.
2025 brought further turbulence. The index climbed steadily through the first quarter before President Trump's sweeping tariff announcements hammered global equities in April 2025, pushing J225 to a multi-year intraday low of 30,456.0 JPY on 7 April. A recovery followed, and the index ended 2025 at 50,342.4 JPY on 31 December. That left it up roughly 27.7% over the year as a whole.
In 2026, optimism following the LDP's landslide February election victory drove J225 to a year-to-date high of 59,407.1 JPY on 27 February 2026. The index has since pulled back amid a crude oil price surge linked to renewed US-Iran tensions, trading at 56,659.7 JPY on 13 April 2026. That leaves the index approximately 12.2% up year to date, but 66.9% higher year on year.

Past performance is not a reliable indicator of future results.
Japan 225 (J225): Capital.com analyst view
Japan 225’s price action in 2026 reflects a market that has remained elevated after a strong advance, even as volatility has picked up. Supportive factors include Japan’s fiscal stimulus backdrop, resilient corporate earnings expectations and the index’s ability to hold above key longer-term moving averages. Yen weakness could also support some export-oriented companies by improving overseas revenue translation. However, the same currency move may also signal pressure from higher import costs, while stronger earnings expectations still need to be confirmed by incoming results.
At the same time, several headwinds remain in view. Higher crude oil prices could weigh on Japan’s import-dependent economy and corporate margins, particularly if energy costs stay elevated. Yet the opposite could also apply if oil prices ease, which may reduce cost pressures and improve sentiment. Technical readings suggest momentum remains constructive, but not without risk, as any deterioration in global risk appetite, central bank expectations or geopolitical conditions could shift the near-term picture. Third-party forecasts also vary widely, which underlines the uncertainty around the path ahead rather than a clear directional outcome. Past performance is not a reliable indicator of future results.
This is technical analysis for informational purposes only and does not constitute financial advice or a recommendation to buy or sell any instrument.
Capital.com’s client sentiment for Japan 225 CFDs
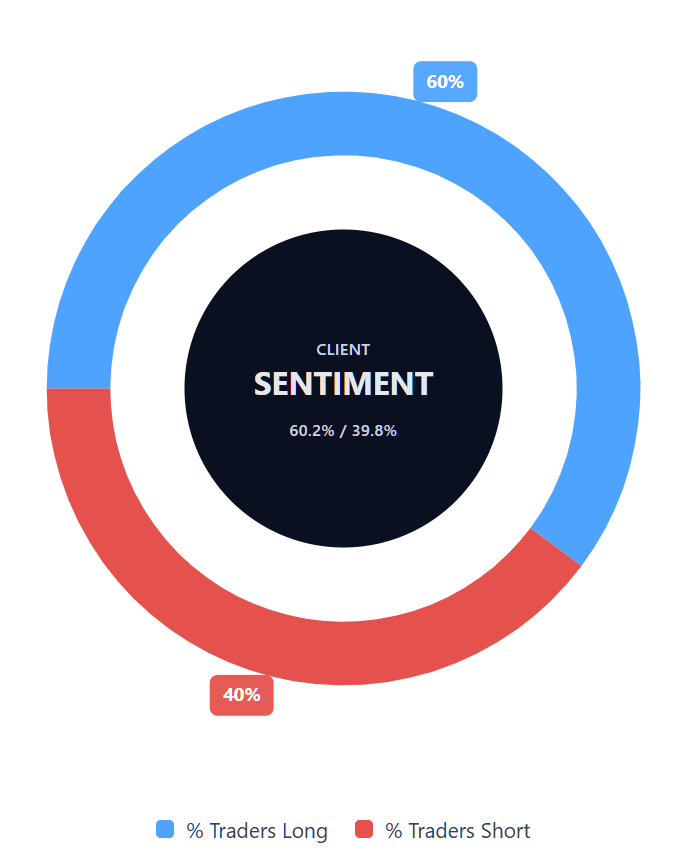
As of 13 April 2026, Capital.com client positioning in Japan 225 CFDs shows 60.2% long and 39.8% short, which keeps it in majority-buy territory but shy of an extreme, with buyers ahead by 20.4 percentage points. This snapshot reflects open positions on Capital.com and can change rapidly in response to market developments.
Summary – Japan 225 2026
- J225 trades at 56,667.2 JPY as of 10:44am UTC on 13 April 2026, up roughly 12.2% year to date and 66.9% year on year.
- Key upside drivers include Japan's 'Sanaenomics' fiscal stimulus package, LDP policy continuity, and improving corporate earnings, with return on equity trends rising.
- Primary headwinds include crude oil above $100 per barrel following US-Iran tensions, yen weakness near 159 JPY per dollar, and sensitivity to further Bank of Japan rate hikes.
Past performance is not a reliable indicator of future results.
FAQ
What is the 5 year Japan 225 forecast?
Is Japan 225 a good CFD to trade?
Could Japan 225 go up or down?
Should I invest in Japan 225?
Can I trade Japan 225 CFDs on Capital.com?
Trading Japan 225 CFDs on Capital.com lets you speculate on movements without owning the underlying asset and to take long or short positions. However, contracts for difference (CFDs) are traded on margin, and leverage amplifies both profits and losses. You should ensure you understand how CFD trading works, assess your risk tolerance, and recognise that losses can occur quickly.