Gold price forecast: Fed pressure, Hormuz disruption
Gold spot has come under pressure as higher inflation expectations, a firmer US dollar and shifting Fed rate expectations offset support typically associated with geopolitical risk. Past performance is not a reliable indicator of future results. Explore third-party Gold price targets.
Gold spot (XAU/USD) is trading at $4,418.77 as of 9:46am UTC on 24 March 2026, within an intraday range of $4,130.23–$4,498.09. Past performance is not a reliable indicator of future results.
Price action continues to face pressure from a combination of hawkish Federal Reserve policy expectations and a relatively firm US dollar, with the DXY last recorded near 99.3, as the Strait of Hormuz closure, which removed roughly 12 million barrels of daily oil supply, has reframed the Middle East conflict as an inflationary shock rather than a traditional safe-haven event (Reuters, 11 March 2026). Iran's denial of ongoing talks with the US, reported on 23 March 2026, extended gold's losing streak to a tenth consecutive session, while gold-backed ETFs have seen net outflows as institutional participants reassess the rate-cut timeline (Investing.com, 24 March 2026). The DXY edged lower on Monday after President Trump postponed further strikes on Iranian energy infrastructure pending diplomatic engagement, offering some support to gold near session lows, though analysts note that rate and dollar dynamics, rather than geopolitical headlines alone, are expected to remain the primary price determinants in the near term (CNBC, 23 March 2026).
Gold price forecast 2026-2030: Analyst price target view
As of 24 March 2026, third-party gold predictions reflect a marked divergence between institutional year-end targets set earlier in the year and the sharp correction that has followed the onset of US–Iran hostilities. The following targets summarise the most recently published views on XAU/USD.
FXStreet (post-sell-off technical outlook)
FXStreet reports that gold defended the critical 100-day simple moving average at $4,605/oz on 19 March 2026, while noting that a bearish bias continues to prevail following the metal's worst weekly decline in over a decade. The outlet flags the $4,605 level as the primary near-term support, with a sustained close below that threshold opening the door to $4,400–$4,200 amid persistent inflation-driven rate-hike speculation (FXStreet, 20 March 2026).
Saxo Bank (macro quick take)
Saxo Bank flags that gold is on course for its largest weekly loss in six years as of 20 March 2026, pressured by rising inflation expectations that are reducing rate-cut bets and pushing long-end yields higher. The bank notes that technical long liquidation accelerated after prices broke below $5,000/oz and highlights emerging, though secondary, speculation that surplus economies in the Middle East may need to raise liquidity through asset sales, which could include gold holdings (Saxo Bank, 20 March 2026).
The Street (Wall Street consensus summary)
The Street compiles the prevailing Wall Street year-end 2026 targets: J.P. Morgan at $6,300/oz, UBS at $6,200/oz for each of March, June, and September 2026, Deutsche Bank and Société Générale each at $6,000/oz, Goldman Sachs at $5,400/oz, and Bank of America at $5,000/oz. The article notes that these targets were largely set before the Iran conflict began driving inflationary pressures and that the current spot price of around $4,400–$4,600 represents a significant discount to all published institutional year-end estimates (The Street, 14 March 2026).
GoldSilver.com (multi-bank scenario analysis)
GoldSilver.com notes that major institutions including J.P. Morgan ($6,300/oz), Wells Fargo ($6,100–$6,300/oz), and BNP Paribas (peak above $6,250/oz) are maintaining their year-end 2026 targets, even as spot prices trade well below those levels. The review underlines that none of these forecasts explicitly incorporated a full Strait of Hormuz closure or a sustained US Federal Reserve rate-hike pivot, making the structural gap between current prices and year-end targets the central unresolved question for the remainder of 2026 (GoldSilver.com, 17 March 2026).
Predictions and third-party forecasts are inherently uncertain, as they cannot fully account for unexpected market developments. Past performance is not a reliable indicator of future results.
Gold price: Technical overview
Gold spot trades at $4,418.77 as of 9:46am UTC on 24 March 2026, sitting below every short-to-medium-term moving average but finding tentative support near the 200-day simple moving average (SMA) shelf. The 20/50/100/200-day SMAs stack at roughly $4,992 / $4,969 / $4,609 / $4,096, all pointing higher in nominal terms but all residing well above the current price, confirming a sustained bearish alignment across the curve.
The 14-day relative strength index (RSI) reads 27.6, deep in oversold territory, which historically indicates exhaustion in selling momentum rather than a directional signal in isolation. The average directional index (ADX) at 25.2 indicates that an established trend is in place, consistent with the directional force behind the decline from the March highs above $5,400.
On the topside, the first reference to watch is the classic R1 pivot at $5,572; a convincing daily close above that level would bring R2 near $5,866 into view. Between the current price and R1, the 100-day SMA at $4,609 represents the most immediate overhead barrier, with the broader $4,609–$4,633 zone (100-day SMA and 100-day exponential moving average (EMA)) likely to cap any near-term recovery attempt.
On pullbacks, the classic pivot point at $4,987 now acts as overhead resistance rather than support given the extent of the sell-off, leaving the 200-day SMA near $4,096 as the primary downside reference. The S1 classic support level at $4,694 sits between the current price and that longer-term shelf; a daily close below $4,418, the lower bound of today's intraday range, would risk a test towards S1, and losing S1 on a sustained basis would put the 200-day SMA near $4,096 directly in focus.
The Hull moving average (9-period) at $4,325 runs beneath the current price and is registering a buy signal, which, taken alongside the oversold RSI, suggests that the pace of decline may be moderating, though the broader moving-average structure remains firmly bearish while price trades below the $4,609–$4,633 shelf (TradingView, 24 March 2026).
This is technical analysis for informational purposes only and does not constitute financial advice or a recommendation to buy or sell any instrument.
Gold price history (2024–2026)
The gold spot price opened March 2024 around $2,173, then climbed steadily throughout that year, closing 2024 at $2,624.69 as central-bank buying, easing monetary policy expectations, and geopolitical uncertainty drove consistent demand.
The rally accelerated sharply through 2025. Gold closed 2025 at $4,319.14, representing a gain of approximately 64.6% over the calendar year, as persistent haven demand, a weaker US dollar, and robust ETF inflows pushed prices into record territory quarter after quarter. The metal briefly touched a record high of $5,419.79 on 2 March 2026 following the outbreak of US–Iran hostilities and the closure of the Strait of Hormuz, which drove a surge in safe-haven positioning.
That peak proved short-lived. Gold gave back its gains sharply through March 2026 as markets repriced Federal Reserve rate-cut expectations lower in response to rising inflation from the energy supply disruption, with prices falling roughly 18.4% from the 2 March high to the $4,400 area.
XAU/USD closed at $4,420.55 on 24 March 2026, approximately 2.3% higher year to date but 18.4% below the all-time high of $5,419.79 set earlier in the month, and 46.9% higher year on year.
Past performance is not a reliable indicator of future results. Share prices are indicative and may differ from live market prices.
Gold price outlook: Capital.com analysis
Gold spot's 2025–2026 price story has been defined by two distinct phases: a sustained, structurally driven rally that took XAU/USD from around $2,624 at the start of 2025 to a record $5,419.79 on 2 March 2026, and a sharp corrective phase that has since unwound roughly 18% of those gains. The earlier advance reflected a combination of central-bank accumulation, a softer US dollar, and growing investor demand for non-yielding assets amid fiscal uncertainty, factors that many market observers still view as intact underpinnings. However, the onset of US–Iran hostilities and the subsequent Strait of Hormuz closure created a paradox: while geopolitical stress would typically support haven demand, the associated oil price shock has heightened inflation expectations, prompting markets to price out Federal Reserve rate cuts and strengthening the dollar, which has historically weighed on gold.
As of 24 March 2026, gold trades at $4,418.77, caught between two competing forces. The structural case, including central-bank diversification, de-dollarisation trends, and persistent geopolitical risk, continues to provide a floor, with several major institutions maintaining year-end targets well above current levels. The counterargument is that elevated real interest rates raise the opportunity cost of holding a non-yielding asset, and any further hawkish Fed signalling could extend the correction, even if broader uncertainty persists. Both dynamics remain in play, and the balance between them is likely to drive the next directional move.
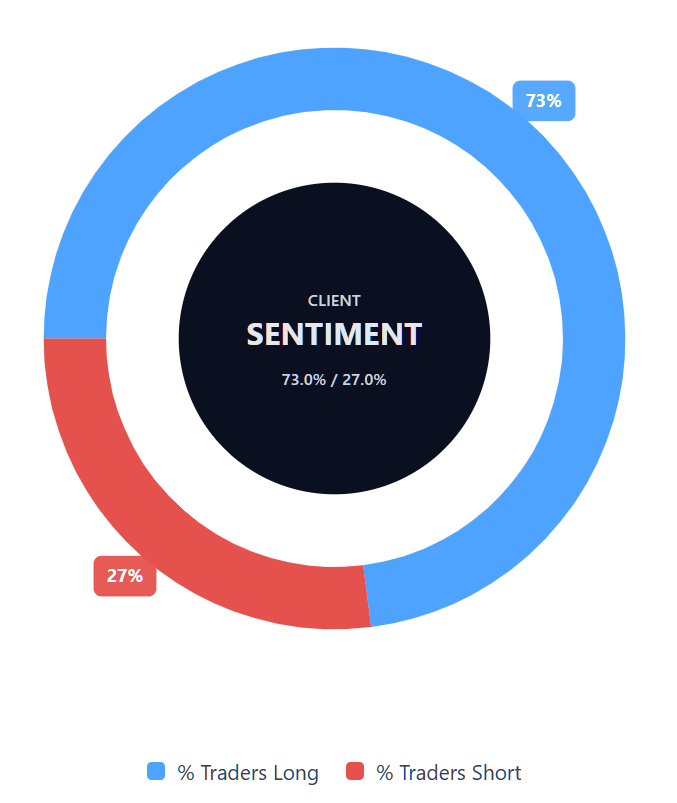
Capital.com’s client sentiment for Gold CFDs
As of 24 March 2026, Capital.com client positioning in Gold spot CFDs shows 73% buyers and 27% sellers, placing sentiment firmly in a heavy-buy, one-sided-towards-longs position. This snapshot reflects open positions on Capital.com and can change rapidly as market conditions evolve.
Summary – Gold price 2026
- Gold spot (XAU/USD) trades at $4,418.77 as of 9:46am UTC on 24 March 2026, down roughly 18% from the 2 March record high of $5,419.79.
- Technical indicators are broadly bearish, with price trading below all short-to-medium-term moving averages; the 14-day RSI at 27.6 signals oversold conditions.
- The 100-day SMA near $4,609 represents the key overhead resistance, while the classic pivot point and 200-day SMA near $4,096 mark the primary downside reference levels.
- The US–Iran conflict and Strait of Hormuz closure have driven an oil-led inflation shock, reducing Federal Reserve rate-cut expectations and pressuring gold despite elevated geopolitical risk.
- A firmer US dollar and rising real yields have increased the opportunity cost of holding gold, weighing on price even as central-bank demand and structural haven appeal remain intact.
- Iran's denial of US talks on 23 March extended gold's losing streak to a tenth consecutive session, while diplomatic signals from Washington briefly steadied prices near session lows.
Past performance is not a reliable indicator of future results.
FAQ
What is the Gold price forecast?
Could Gold’s price go up or down?
Should I invest in Gold?
Can I trade Gold CFDs on Capital.com?
Yes, you can trade Gold CFDs on Capital.com. Trading commodity CFDs lets you speculate on price movements without owning the underlying asset and to take long or short positions. However, contracts for difference (CFDs) are traded on margin, and leverage amplifies both profits and losses. You should ensure you understand how CFD trading works, assess your risk tolerance, and recognise that losses can occur quickly.