Gold price forecast: US payrolls lift rate bets
Gold spot trades near two-month lows after stronger US jobs data lifted Fed rate-hike expectations and added support to the US dollar. Explore third-party Gold price targets and technical analysis. Past performance is not a reliable indicator of future results.
Gold (XAU/USD) is trading at $4,316.19 as of 3:25pm UTC on 8 June 2026, within an intraday range of $4,288.45–$4,473.70. Past performance is not a reliable indicator of future results.
Pressure stems mainly from the stronger-than-expected US non-farm payrolls report for May, which showed 172,000 jobs added against a consensus forecast of around 80,000–85,000 (Reuters, 6 June 2026). This pushed Federal Reserve rate-hike expectations sharply higher, with CME futures pricing a November increase as roughly a 50/50 probability. Traders in rate futures subsequently lifted year-end rate expectations to approximately 3.87%, weighing on non-yielding assets (BullionVault, 5 June 2026). The firmer US dollar, which rose alongside the payrolls data, added further pressure on dollar-denominated commodities (Reuters, 5 June 2026). Ongoing Middle East tensions, including the continuing Iran conflict, have offered only partial safe-haven support, as related inflation concerns also reinforce the case for rates staying elevated (Reuters, 5 June 2026).
Gold price forecast 2026-2030: Analyst price target view
As of 8 June 2026, third-party gold predictions have undergone notable revisions since late May, with several institutions cutting near-term averages while keeping higher year-end directional targets.
J.P. Morgan (revised annual average, year-end target maintained)
J.P. Morgan trimmed its 2026 full-year average gold price forecast to $5,243/oz from $5,708/oz, citing softer near-term investor demand, which it described as having 'dried to a trickle.' The bank maintained its base-case year-end target of around $6,000/oz, as it expects demand to re-accelerate in the second half of 2026, with central bank buying and a recovery in ETF inflows from H2 2026 remaining the pillars supporting its unchanged directional call (Reuters, 18 May 2026).
Goldman Sachs (year-end target reaffirmed)
Goldman Sachs reaffirmed its $5,400/oz year-end 2026 gold price target in a May update, keeping the call unchanged after gold pulled back from record highs near $5,600/oz earlier in the year. The bank said diversification by emerging market central banks and private-sector investors, alongside persistent US policy uncertainty, continues to support its structural case for gold (Canadian Mining Report, 20 May 2026).
Metals Focus (Gold Focus 2026 launch)
Metals Focus, presenting its Gold Focus 2026 supply and demand report in the first week of June, said the key drivers from 2025 remain intact: US policy uncertainty, persistent concerns about the dollar's long-term outlook, elevated geopolitical risks, and stretched equity valuations. The consultancy added that, while inflationary pressures are expected to persist, it does not subscribe to the growing consensus that US Federal Reserve rate hikes are likely over the next 12 months, a stance that underpins its relatively constructive outlook for gold prices (BullionVault, 5 June 2026).
Yahoo Finance (consensus round-up)
Yahoo Finance, reporting on the latest institutional consensus as of late May 2026, noted that J.P. Morgan holds the most bullish major-bank year-end view at around $6,000/oz, while Goldman Sachs sits at $5,400/oz and UBS maintains quarterly markers of $5,200 for June, $5,400 for September, and $5,900 for December 2026. The round-up flags short-term pressure from elevated US interest rate expectations and rising bond yields as the main offset to structural demand support, with most banks having cut annual average estimates while leaving year-end targets broadly intact (Yahoo Finance, 22 May 2026).
MarketScreener (multi-broker overview)
MarketScreener reported that ANZ had revised its $6,000/oz gold target to mid-2027, reflecting a deferral rather than an outright downgrade, while J.P. Morgan's revised average of $5,243/oz contrasts with year-end directional targets clustering between $5,400 and $6,000 across the major brokerages. The overview notes that brokerages broadly remain bullish on gold despite near-term pressure, with softer H1 demand and elevated US rates forming the common basis for average forecast cuts (MarketScreener, 18 May 2026).
Predictions and third-party forecasts are inherently uncertain, as they cannot fully account for unexpected market developments. Past performance is not a reliable indicator of future results.
Gold price: technical overview
Gold spot prices trade at $4,316.19 as of 3:25pm UTC on 8 June 2026, sitting below its full moving-average stack. The 20-, 50-, 100- and 200-day simple moving averages (SMAs) are at approximately $4,517, $4,627, $4,792 and $4,438, respectively, all above the current price. The 200-day exponential moving average (EMA) at $4,382 provides a closer reference; price has slipped beneath it, reinforcing the bearish short-term structure visible across TradingView’s moving-average summary. The Hull moving average (9) at $4,351 sits just above the current print, offering a nearby dynamic reference.
Momentum indicators on TradingView are broadly weak. The 14-day relative strength index (RSI) stands at 34.01, in oversold-adjacent territory but not yet at a historically extreme level. The average directional index (14) reads 27.26, consistent with an established directional move rather than a ranging environment. The commodity channel index (20) at -209.02 and bull bear power at -299.95 also point to downside pressure.
On the classic pivot framework, the pivot point at $4,560.80 represents the first overhead reference. A daily close above that level would put R1 near $4,755.69 back in view. To the downside, S1 at $4,348.06 is the nearest support, with S2 at $4,153.17 the next meaningful reference if S1 gives way (TradingView, 8 June 2026).
This technical analysis is for informational purposes only and does not constitute financial advice or a recommendation to buy or sell any instrument.
Gold price history (2024–2026)
The gold spot price closed 2024 at $2,624.69, then extended a powerful rally through 2025, gaining around 64% across the year before rising further into 2026. Prices broke above $5,000 for the first time on 26 January 2026 amid demand for safe-haven assets, as geopolitical tensions, dollar weakness and heavy central bank accumulation converged. The metal reached an all-time high of $5,595.75 on 29 January 2026, up roughly 113% from its level two years earlier.
A sharp reversal followed. Gold fell more than 17% from that peak through March 2026, as the US dollar and Treasury yields climbed on renewed inflation concerns linked to the Iran conflict, while traders unwound extended positions. The metal stabilised and recovered towards $4,890 in mid-April 2026, briefly supported by ceasefire optimism in the Middle East, but faded back below $4,700 as hopes for a lasting resolution cooled. A stronger-than-expected US non-farm payrolls report for May, released on 5 June 2026 and showing 172,000 jobs added against a consensus near 90,000, drove renewed selling, pushing gold to a two-month low and erasing its year-to-date gains.
Gold spot (XAU) closed at $4,318.27 on 8 June 2026, approximately 22.8% below the January all-time high and roughly 64.5% above the close of 8 June 2025 at $3,318.24. Past performance is not a reliable indicator of future results.
Past performance is not a reliable indicator of future results. Prices are indicative and may differ from live market prices.
Gold price outlook: Capital.com analysis
Gold spot has had a notable run over the past two years, climbing from around $2,625 at the close of 2024 to an all-time high of $5,595.75 on 29 January 2026. The move was driven by a combination of central bank accumulation, safe-haven demand and broader dollar weakness. The World Gold Council reported net central bank purchases of 244 tonnes in Q1 2026, pointing to persistent structural demand from the official sector. Since that January peak, however, gold has given back roughly 22%, with the most recent leg lower following a stronger-than-expected US non-farm payrolls report on 5 June 2026, which lifted Federal Reserve rate-hike expectations and weighed on non-yielding assets.
Looking at the factors at play, a more hawkish Fed trajectory and elevated real yields represent a headwind for gold, as rising rates increase the opportunity cost of holding the metal. On the other hand, ongoing geopolitical uncertainty, continued central bank buying and the possibility of softer US economic data later in 2026 are cited by several institutions as potential supports. The breadth of current analyst forecasts, ranging from $4,800 to $6,000/oz for year-end 2026, reflects the uncertainty around which macro forces may prove most influential in the months ahead.
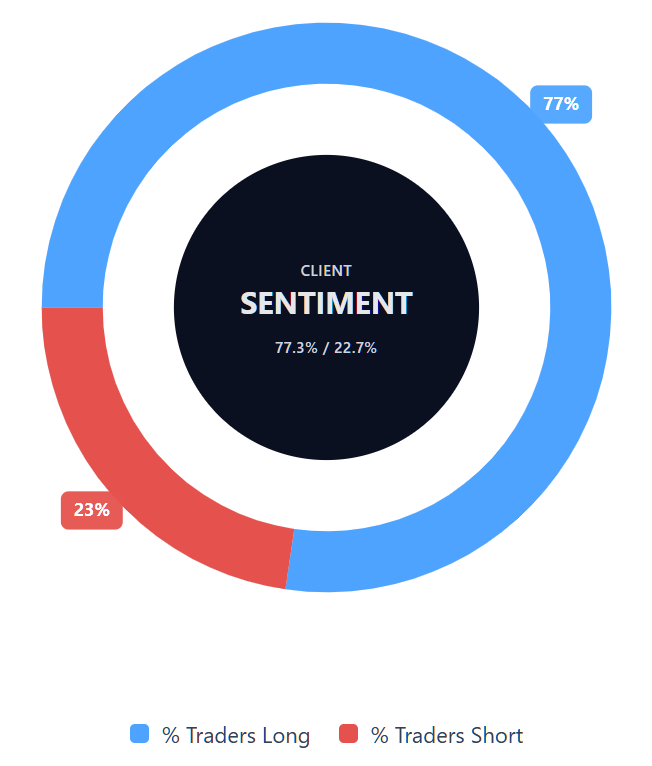
Capital.com’s client sentiment for Gold CFDs
As of 8 June 2026, Capital.com client positioning in Gold spot CFDs shows 77.3% buyers versus 22.7% sellers, putting buyers ahead by 54.6 percentage points. This suggests positioning is heavily skewed towards long exposure in this snapshot, which reflects open positions on Capital.com and can change.
Summary – Gold price 2026
- Gold spot trades at $4,316.19 as of 3:25pm UTC on 8 June 2026, around 22% below the January all-time high of $5,595.75.
- The main near-term driver is a stronger-than-expected May US non-farm payrolls report, which showed 172,000 jobs added and lifted Fed rate-hike expectations, pressuring non-yielding assets.
- Structural supports include persistent central bank buying, with 244 tonnes net in Q1 2026 according to the World Gold Council, alongside ongoing geopolitical risk and de-dollarisation flows.
Past performance is not a reliable indicator of future results.
FAQ
What is the gold price forecast?
Analyst forecasts cited in the article show a wide range of expectations for gold in 2026. Several institutions have lowered their near-term average price forecasts, partly due to softer demand and higher US rate expectations, while keeping higher year-end targets. J.P. Morgan’s year-end view sits around $6,000/oz, while Goldman Sachs has maintained a $5,400/oz target. These forecasts are not guarantees and may change as economic data, central bank policy and geopolitical risks evolve.
Could gold’s price go up or down?
Gold’s price could move in either direction, depending on which market drivers dominate. Higher US interest rates, a stronger US dollar and rising bond yields can weigh on gold because it does not pay interest. However, geopolitical uncertainty, central bank buying, ETF inflows and softer US economic data could provide support. The article shows that gold has already moved sharply in both directions in 2026, underlining the need to consider both potential upside and downside.
Should I invest in gold?
Whether gold is suitable depends on your financial goals, risk tolerance and wider portfolio, and this article does not provide investment advice. Gold can be used by some investors as a diversifier or as exposure to macroeconomic and geopolitical themes, but its price can be volatile. CFDs add further risk because they are leveraged, meaning both profits and losses can be amplified. Always do your own research and consider whether you understand the risks before trading.
Can I trade gold CFDs on Capital.com?
Yes, you can trade Gold CFDs on Capital.com. Trading commodity CFDs lets you speculate on price movements without owning the underlying asset and to take long or short positions. However, contracts for difference (CFDs) are traded on margin, and leverage amplifies both profits and losses. You should ensure you understand how CFD trading works, assess your risk tolerance, and recognise that losses can occur quickly.