Ethereum (ETH) price prediction: ETF outflows, Glamsterdam delay
Ethereum is the native token of the Ethereum network. In June 2026, ETH traded near the low-to-mid $1,700s as ETF flows and upgrade timing shaped sentiment. Explore third-party ETH price targets and technical analysis. Past performance is not a reliable indicator of future results.
Ethereum (ETH/USD) is trading at $1,758.96 as of 12:55pm UTC on 22 June 2026, within an intraday range of $1,702.90–$1,766.18 on Capital.com’s quote feed. Past performance is not a reliable indicator of future results.
Sentiment remains subdued as analysts point to a hawkish Federal Reserve posture under new Chair Kevin Warsh, which has sustained pressure across risk-sensitive assets including crypto (Yahoo Finance, 22 June 2026). ETH spot ETF outflows of $401.62m recorded through late May may also have weighed on demand (BeinCrypto, 28 May 2026). The Glamsterdam protocol upgrade, which targets improvements to MEV fairness and layer-one efficiency via proposals including EIP-7732, was originally anticipated for the first half of 2026 but has since been rescheduled to H2 2026, according to the official Ethereum roadmap (Ethereum.org, accessed 22 June 2026). That shift reduces the likelihood of a near-term technical catalyst. The ETH/BTC ratio stood at approximately 0.02737 as of 17 June 2026, near a 10-month low, reflecting continued underperformance relative to bitcoin as broader crypto market volumes remain thin ahead of summer (Yahoo Finance, 17 June 2026).
Third-party Ethereum outlook: ETF outflows and upgrade
As of 22 June 2026, third-party ETH price predictions reflect a wide range of outlooks shaped by network upgrade timelines, spot ETF flow data, macro conditions and on-chain demand dynamics.
CoinCodex (algorithmic short-term model)
CoinCodex places ETH within a June 2026 trading channel of $1,722–$2,526.30, with a near-term five-day upper target of $1,745.02 by 24 June 2026 and a one-month upper target of $2,526.30 by 21 July 2026. The model flags bearish overall sentiment, with 27 of 31 technical indicators signalling sell as of 21 June 2026. Its data also shows the 50-day SMA at $2,002.82, well above spot, while the RSI reads 42.44, placing it in neutral territory (CoinCodex, 21 June 2026).
Coinpedia (technical and on-chain outlook)
Coinpedia sets a 2026 year-end upper target of $6,100, with a potential low of $1,500 if current support levels fail, as of its 16 June 2026 update. Its rationale cites ETH's break below its ascending channel in early June as a bearish near-term signal. However, it also notes that anchored volume profile support in the $1,500–$1,700 range and a rise in real-world asset tokenisation to $17.90bn on Ethereum's network could attract renewed institutional demand at lower levels (Coinpedia, 16 June 2026).
Changelly (quantitative model)
Changelly projects a June 2026 monthly average of $1,810.68, with a full-year 2026 range of $1,963.05–$2,531.78 and an average of $2,247.42 under its technical forecast model. The framework points to continued consolidation near current spot levels in the near term, with potential for a gradual move higher into year-end if broader crypto market conditions stabilise (Changelly, 20 June 2026).
CoinCodex (weekly article target)
In a dedicated near-term article, CoinCodex estimated ETH could reach $1,909.55 by 20 June 2026, representing an 11.17% gain from its 14 June 2026 spot price of $1,805.94. The short-term model characterised overall sentiment as bearish, citing elevated volatility and a cluster of resistance levels between $1,824.77 and $2,750.63 as conditions that would need to be cleared to shift the technical outlook (CoinCodex, 15 June 2026).
Coinpedia (June 2026 bottom analysis)
In a separate piece published on 5 June 2026, Coinpedia noted that ETH had fallen to approximately $1,560, a decline of more than 22%, and characterised price action as consistent with a capitulation phase rather than a confirmed reversal. The analysis stated that a sustained recovery would require ETH to first reclaim $2,500, then achieve a clean breakout above $3,100, with further upside toward $4,800 contingent on those conditions being met (Coinpedia, 6 June 2026).
Predictions and third-party forecasts are inherently uncertain, as they cannot fully account for unexpected market developments. Past performance is not a reliable indicator of future results.
ETH price: technical overview
The ETH/USD price trades at $1,758.96 as of 12:55pm UTC on 22 June 2026, sitting above the 20-day simple moving average (SMA) at $1,704 and the volume-weighted moving average at $1,690. However, it remains below the 30-, 50-, 100- and 200-day SMAs at $1,809, $1,980, $2,098 and $2,357, respectively. According to TradingView data, that positioning suggests price remains within a broader downtrend on higher time frames.
The 20-over-50 SMA alignment is not intact, with the 20-day SMA at $1,704 running well below the 50-day SMA at $1,980. This points to a sustained corrective phase over recent months. The 14-day relative strength index (RSI) reads 45.7, placing it in lower-neutral territory, which TradingView characterises as neither oversold nor clearly signalling recovering momentum. The average directional index (ADX) at 33.9 suggests an established trend is in place.
On the topside, the classic R1 pivot at $2,297 represents the nearest overhead reference. A sustained daily close back above the 30-day SMA near $1,809 would be a prior step before that level comes into view. Published classic pivot references list the pivot point at $2,131, S1 at $1,838 and S2 at $1,671, although only S2 sits below the current spot price. The Hull moving average (9) at $1,719 and the Ichimoku base line at $1,774 frame the immediate range around current price, per TradingView (TradingView, 22 June 2026).
This technical analysis is for informational purposes only and does not constitute financial advice or a recommendation to buy or sell any instrument.
Ethereum price history (2024–2026)
ETH/USD’s price opened June 2024 trading near $3,420, part of a broader crypto rally that had carried prices well above $3,000 through the spring. The token climbed steadily through the summer, reaching an all-time high of $4,954 on 24 August 2025, driven in part by regulatory tailwinds in the US, growing institutional interest and a wave of treasury companies accumulating ETH.
A prolonged reversal followed. ETH closed 2025 near $2,968, having given back a large portion of those gains in the final months of the year. Selling accelerated into early 2026, with prices sliding from around $3,300 at the start of January to below $1,826 by 6 February, as a broader macro and AI-sector sell-off triggered heavy leveraged liquidations across crypto markets. By late February, ETH was trading near $1,800, marking its worst start to a calendar year on record.
A partial recovery took prices back toward the $2,000–$2,400 range through April and early May 2026. However, renewed selling in late May and early June drove ETH back below $1,600 by 10 June, after it touched lows around $1,511 on 6 June. The token has since stabilised, closing at $1,761.55 on 22 June 2026, approximately 64.4% below its August 2025 all-time high and around 40.6% lower year to date.
Past performance is not a reliable indicator of future results. Prices are indicative and may differ from live market prices.
Capital.com analyst view: Ethereum
Ethereum’s price performance over the past two years reflects the sharp cyclical swings that define the broader digital asset market. After setting an all-time high near $4,954 in August 2025, ETH has retraced significantly, trading around $1,759 in late June 2026. That correction coincides with macro headwinds, sustained spot ETF outflows and a delay to the Glamsterdam protocol upgrade, which had been anticipated as a near-term network catalyst. At the same time, the macro environment that has pressured ETH could shift, while a reversal in institutional flows or a softer interest rate outlook could provide renewed support.
The network’s expanding role in real-world asset tokenisation and a developer base that reportedly reached one million in mid-2025 represent structural positives that some market participants point to as long-term demand drivers. That said, competition from alternative layer-one blockchains, continued regulatory uncertainty across major jurisdictions and ETH’s persistent underperformance relative to bitcoin suggest the near-term picture remains mixed. Both the bullish and bearish cases carry meaningful uncertainty.
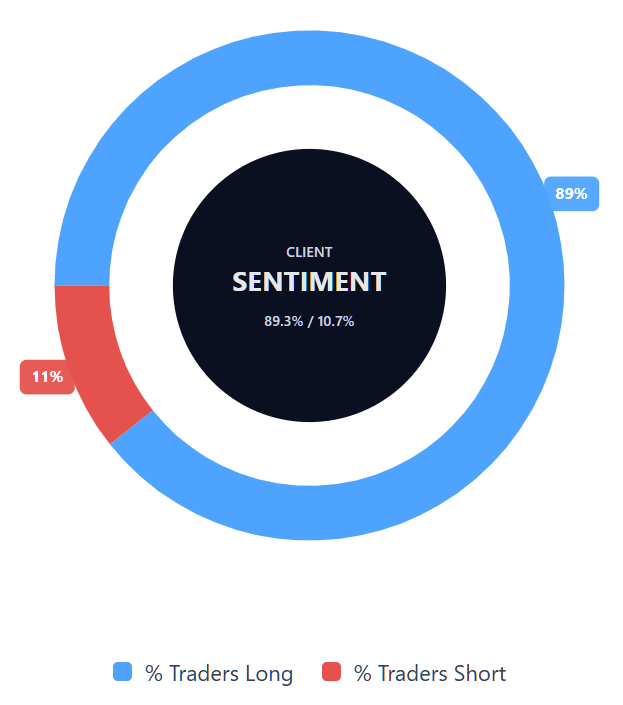
Capital.com’s client sentiment for Ethereum CFDs
As of 22 June 2026, Capital.com client positioning in Ethereum CFDs sits at 89.3% buyers versus 10.7% sellers, placing it in heavy-buy territory, with buyers ahead by 78.6 percentage points. That one-sided skew toward longs represents one of the more extreme readings on the sentiment scale. This snapshot reflects open positions on Capital.com and can change.
Summary – Ethereum (2026)
- ETH trades at $1,758.96 as of 12:55pm UTC on 22 June 2026, approximately 64.4% below its all-time high of $4,954, set on 24 August 2025.
- Technical indicators from TradingView show ETH trading below all major SMAs from the 30-day through to the 200-day, with a bearish 20-over-50 alignment absent.
- Key drivers weighing on price include sustained spot ETF outflows, a hawkish macro backdrop and the Glamsterdam upgrade being pushed to H2 2026.
- Structural positives cited by analysts include growth in real-world asset tokenisation on Ethereum’s network and the expanding developer ecosystem.
Past performance is not a reliable indicator of future results.
FAQ
What is the latest Ethereum crypto price prediction?
Third-party Ethereum price predictions remain mixed. Near-term model forecasts cited in the article cluster around the $1,700–$1,910 range for June 2026, while full-year 2026 upper estimates vary more widely, from $2,531.78 to $6,100. These forecasts depend on factors including technical levels, ETF flows, macro conditions and Ethereum network developments. Forecasts are not guaranteed, and past performance is not a reliable indicator of future results.
Who owns the most Ethereum?
The largest Ethereum holders are typically staking contracts, exchanges, ETF issuers, custodians and other institutional wallets, rather than single individuals. Among identifiable individual holders, Arkham has reported Ethereum pre-sale investor Rain Lohmus as one of the largest, although his wallet is reportedly inaccessible, with Vitalik Buterin also among the largest known individual holders. On-chain ownership data can change and may not always identify the beneficial owner behind a wallet.
How much ETH is there?
Ethereum does not have a fixed maximum supply like bitcoin. Its circulating supply changes over time because new ETH can be issued while part of the transaction fees paid on the network can be burned. YCharts, using Etherscan as its source, listed Ethereum supply at around 117.76m ETH as of 20 June 2026. Supply figures can move gradually with network activity, staking dynamics and fee-burning mechanisms.
Could Ethereum’s price go up or down?
Ethereum’s price could move in either direction. Supportive factors could include stronger institutional demand, a reversal in spot ETF outflows, a softer interest rate backdrop or progress on Ethereum network upgrades. Downside risks include continued macro pressure, weak crypto market volumes, competition from other layer-one blockchains and further underperformance versus bitcoin. As the article shows, analyst targets vary widely, which reflects the uncertainty around both the bullish and bearish cases.
Should I invest in Ethereum?
Whether Ethereum is appropriate depends on your financial situation, objectives, risk tolerance and market knowledge. This article does not provide investment advice or a recommendation to buy, sell or hold ETH. Cryptocurrencies are highly volatile, and CFDs add further risk because they are leveraged products. Before making any decision, consider doing your own research, reviewing the risks carefully and seeking independent professional advice where needed.
Can I trade Ethereum CFDs on Capital.com?
Yes, you can trade Ethereum CFDs on Capital.com. Trading crypto CFDs lets you speculate on price movements without owning the underlying asset and to take long or short positions. However, contracts for difference (CFDs) are traded on margin, and leverage amplifies both profits and losses. You should ensure you understand how CFD trading works, assess your risk tolerance, and recognise that losses can occur quickly.