Dow Jones index forecast: Tariff exemptions support sentiment
US Wall Street 30 tracks 30 major US companies and has recently risen as tariff exemptions supported sentiment, while Fed caution and geopolitical developments kept the outlook uncertain. Explore third-party US30 targets. Past performance is not a reliable indicator of future results.
The Dow Jones Industrial Average index – referred to as the US Wall Street 30 (US30) on CFD trading platforms such as Capital.com – is trading at $48,283.7 as of 8:52am UTC on 14 April 2026, within an intraday range of $47,373.7–$48,281.7. Past performance is not a reliable indicator of future results.
Sentiment has been supported by a series of US tariff exemptions, including those on consumer electronics announced in mid-April, which lifted technology-linked Dow constituents such as Nvidia and Amazon (ABC News, 14 April 2026). The March FOMC minutes, released on 8 April, confirmed that the Federal Reserve is attentive to the risks to both sides of its dual mandate, with policymakers noting that uncertainty about the economic outlook remains elevated and that the implications of Middle East developments for the US economy are uncertain (Federal Reserve, 18 March 2026). That has added uncertainty to the rate outlook, with the Axios report on the same minutes noting that some officials kept rate increases on the table given persistent inflation pressures (Axios, 8 April 2026). A 14-day Middle East ceasefire declared in early April also contributed to a risk-on shift, with the Dow Jones Industrial Average surging more than 1,000 points in early trade on 8 April as oil prices retreated sharply on hopes that the Strait of Hormuz would reopen (KNKX/NPR, 8 April 2026).
US Wall Street 30 forecast 2026–2030: Third-party targets
As of 14 April 2026, third-party US Wall Street 30 predictions reflect a wide range of outcomes, shaped by Federal Reserve policy, US trade tariff developments, and the corporate earnings outlook.
LongForecast (monthly cycle model)
LongForecast places the DJIA at an April 2026 open of $43,940 and a month-end close of $41,835, within a monthly range of $38,329–$47,895. It projects the index will reach a low of about $42,632 by June before recovering to a year-end close of $47,588 in December 2026. The model applies long-term price cycles and seasonal patterns, with the bearish near-term outlook linked to sustained macro pressure and elevated volatility through mid-year (LongForecast, 7 April 2026).
LiteFinance (technical range analysis)
LiteFinance projects an April 2026 trading range of $43,700–$45,934 for the DJIA, with an average of $44,817, before a trough near $41,366–$45,578 in June. The model then expects a recovery towards $50,654–$53,598 by December 2026. The analysis, updated with the index at $46,546, cites a declining rsi of 37, a bearish rising wedge break below $48,434, and a negative macd reading as the primary technical drivers of the near-term downside thesis (LiteFinance, 1 April 2026).
CoinPriceForecast (stepwise algorithmic model)
CoinPriceForecast projects an April 15 2026 intra-month target of $51,959 for the DJIA, with the mid-year level set at $54,082 and a year-end close of $54,651, representing approximately +9% from the index level of $50,116 at the time of the model's update. The service derives stepwise daily targets from extrapolated historical price performance and statistical modelling, noting that the forecast updates on a daily basis, with the trajectory conditioned on continued earnings growth and stable monetary policy (CoinPriceForecast, 7 April 2026).
Predictions and third-party forecasts are inherently uncertain, as they cannot fully account for unexpected market developments. Past performance is not a reliable indicator of future results.
US30 index price: Technical overview
The US30 index trades at $48,283.7 as of 8:52am UTC on 14 April 2026, with price sitting above all 12 moving averages tracked by TradingView, each of which registers a buy signal. The 20/50/100/200-day SMAs stand at approximately $46,588 / $47,982 / $48,111 / $46,868, with price above the 100-day SMA near $48,111, a level now acting as an immediate reference from below.
The 20-over-50 SMA alignment is intact, keeping the near-term trend structure constructive. The 14-day RSI reads 60.20, placing it in the upper-neutral band, while the ADX at 25.23 indicates that an established trend is in place rather than a weak one, according to TradingView data. The Hull moving average (9) at $48,485.05 carries a sell signal and sits just above the last price, forming a near-term reference overhead.
On the upside, the classic R1 pivot at $48,585.03 is the nearest overhead level; a daily close above that area would put R2 at $50,828.54 in view. On pullbacks, the classic pivot point at $46,821.15 represents initial support, with the 50-day SMA near $47,982 and the 100-day SMA near $48,111 forming a broader moving average shelf. A move below the classic pivot could shift attention towards the S1 level at $44,577.64 (TradingView, 14 April 2026).
This is technical analysis for informational purposes only and does not constitute financial advice or a recommendation to buy or sell any instrument.
US Wall Street 30 index history (2024–2026)
The US Wall Street 30 (US30) tracks the Dow Jones Industrial Average (DJIA), a price-weighted index of 30 large-cap US companies that has served as a barometer of American corporate health since 1896.
The index entered 2024 around $42,509.0 and rose steadily through the year, reaching the $44,000s by autumn before closing 2024 at $42,509.0. It extended those gains into 2025, trading above $44,500 in January and pushing towards $45,000 by March before conditions changed sharply. President Trump's sweeping tariff announcement on 2 April 2025 triggered a severe sell-off, dragging US30 to a multi-month low of $36,964.8 on 7 April 2025. The index recovered quickly once a 90-day tariff pause was announced, reclaiming $40,000 within days and closing 2025 up 13.1% year on year at $48,066.5.
That momentum carried into early 2026, with US30 reaching a recent high of $50,268.2 on 10 February 2026 before renewed trade uncertainty pulled prices back below $45,000 in late March. A recovery followed, and the index had climbed back to $48,283.7 by 14 April 2026, approximately 19.4% above where it stood on the same date a year earlier, though still around 3.9% off February’s peak, and just 0.3% higher year to date from the 1 January 2026 open of $48,128.9.
Past performance is not a reliable indicator of future results. Share prices are indicative and may differ from live market prices.
US Wall Street 30 (US30): Capital.com analyst view
US Wall Street 30's (US30) price action over the past year illustrates how quickly sentiment can shift in large-cap equity markets. The April 2025 tariff-driven sell-off, which briefly pulled the index to $36,964.8, was followed by a sharp recovery once trade tensions eased, demonstrating the market's capacity to reprice rapidly in both directions. By early February 2026, US30 had pushed to a recent high of $50,268.2, reflecting broad confidence in US corporate earnings and a relatively resilient economic backdrop. However, that advance has since partially unwound amid fresh policy uncertainty, underlining that recoveries in risk assets are not always linear.
Looking at the current picture, US30 trades broadly flat year to date near $48,283.7, having rebounded from a late-March low around $44,878.1 in under three weeks. The index's responsiveness to trade policy headlines cuts both ways, with positive developments capable of lifting prices quickly and renewed escalation equally able to reverse gains. Earnings momentum and Federal Reserve guidance remain the two most closely watched fundamental inputs, and shifts in either could move the index materially in either direction.
Capital.com’s client sentiment for US Wall Street 30 CFDs
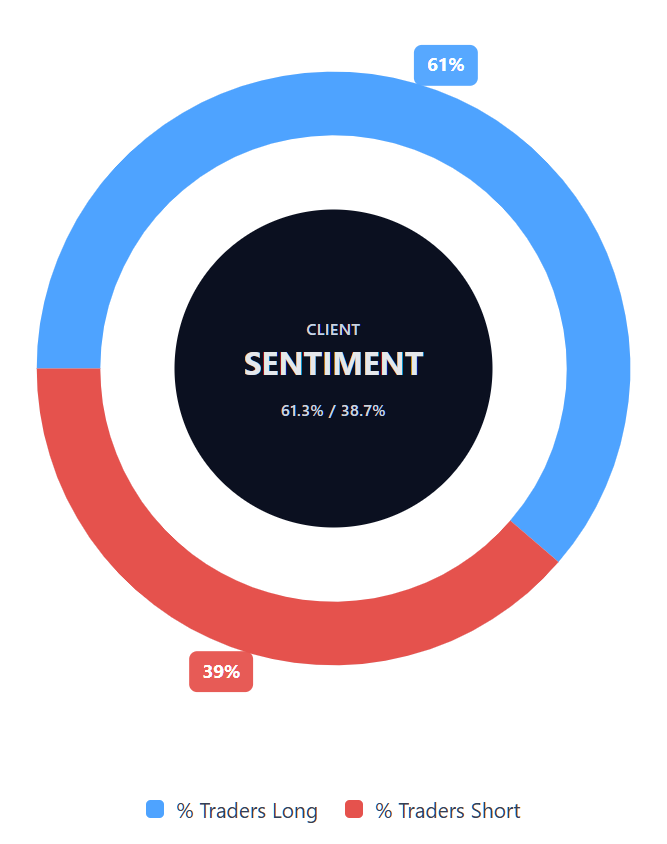
As of 14 April 2026, Capital.com client positioning in US Wall Street 30 CFDs shows that 61.3% of open positions are held long versus 38.7% short, which keeps it in majority-buy territory but shy of an extreme, with buyers ahead by 22.6 percentage points. This snapshot reflects open positions on Capital.com at the time of writing and can change rapidly as market conditions evolve.
Summary – US Wall Street 30 2026
- US Wall Street 30 (US30) trades at $48,283.7 as of 8:52am UTC on 14 April 2026, approximately 19.4% above the same date a year prior, though roughly 3.9% below the February 2026 peak of $50,268.2.
- TradingView data shows all 12 tracked moving averages in buy territory, the 14-day RSI at 60.20 (upper-neutral), and the ADX at 25.23, indicating an established trend. The Hull moving average (9) at $48,485.05 carries a sell signal just overhead.
- Key price drivers include US trade tariff developments, Federal Reserve policy guidance, and the corporate earnings outlook, with Middle East geopolitical tensions providing additional macro volatility across the period.
- Recent attention has focused on tariff exemptions for electronics announced in April 2026 and a 14-day Middle East ceasefire declared in early April, both of which contributed to the index's rebound from late-March lows near $44,878.1.
Past performance is not a reliable indicator of future results.
FAQ
What is the five-year US Wall Street 30 forecast?
Is US Wall Street 30 a good CFD to trade?
Could US Wall Street 30 go up or down?
Should I invest in US Wall Street 30?
Can I trade US Wall Street 30 CFDs on Capital.com?
Yes, you can trade US Wall Street 30 CFDs on Capital.com. Trading index CFDs lets you speculate on price movements without owning the underlying asset and to take long or short positions. However, contracts for difference (CFDs) are traded on margin, and leverage amplifies both profits and losses. You should ensure you understand how CFD trading works, assess your risk tolerance, and recognise that losses can occur quickly.