Cardano price prediction: Third-party outlook
Cardano (ADA) is a blockchain-based cryptocurrency traded globally, with its price influenced by network developments, market sentiment, and wider conditions across the digital asset sector. Explore third-party ADA price targets and technical analysis.
Cardano (ADA) is trading around $0.33 against the US dollar on Capital.com, with an intraday range between a low of $0.32 and a high of $0.36 as of 2:47pm UTC on 30 January 2026. Past performance is not a reliable indicator of future results.
Recent ADA moves are unfolding amid a broader pullback in major cryptocurrencies, with industry analysis noting that leading assets such as bitcoin have extended recent declines following heavy ETF outflows and a wider risk-off tone across digital assets (Amberdata, 27 January 2026). Cardano-specific news flow remains focused on protocol development and upgrade planning, with coverage this week highlighting an upcoming intra-era hard fork towards Protocol version 11, which developers describe as a minor technical update rather than one expected to disrupt transaction activity (Cryptonews.net, 29 January 2026).
Cardano price prediction 2026-2030: Analyst price target view
As of 30 January 2026, third-party ADA price predictions present a wide range of potential paths, reflecting differing views on network development, market structure, and broader crypto risk appetite. The following summaries highlight five recent third-party forecast snapshots and the assumptions they emphasise.
AInvest (news analysis with target band)
AInvest reports that selected technical analysts are monitoring whether ADA can revisit the $0.50–$0.54 zone into 2026, contingent on support near $0.37 holding and resistance around $0.4350 being overcome. The article links this price band to a mix of chart indicators, including bullish RSI divergence and MACD signals, alongside expectations for roadmap items such as Ouroboros Leios and potential institutional custody integrations (AInvest, 29 December 2025).
Benzinga (multi-year forecast overview)
Benzinga’s 2026 Cardano view cites an upside scenario around $0.57, an average near $0.54, and a lower-end case close to $0.48, suggesting a potentially more moderate phase following earlier price gains. It links more positive outcomes to the successful rollout of scalability upgrades such as Hydra and Mithril, alongside clearer regulatory alignment, while noting that policy uncertainty and slower decentralised application adoption compared with networks such as Ethereum or Solana could still limit upside potential (Benzinga, 30 January 2026).
CoinLore (model-driven yearly target)
CoinLore’s algorithmic Cardano model points to a projected ADA price of around $0.27 - $0.80 for 2026, with a price target of $1.55 indicated for 2030. The site states that these projections are generated from historical price patterns and shorter-term trend extrapolation, while emphasising the usual caveats that actual outcomes may differ materially (CoinLore, 30 January 2026).
Predictions and third-party forecasts are inherently uncertain, as they cannot fully account for unexpected market developments. Past performance is not a reliable indicator of future results.
ADA price: Technical overview
On the daily chart, ADA/USD is trading around $0.33 as of 2:47pm UTC on 30 January 2026, below its main simple moving-average cluster, with the 20/50/100/200-day moving averages near approximately 0.37, 0.37, 0.44, and 0.63. The 20-day EMA around 0.36 also sits above spot, reinforcing an overall capped tone while price remains below this layered resistance zone. The 14-day RSI near 35.6 sits in lower-neutral territory, while the ADX around 26 points to an established trend backdrop rather than a directionless range.
On the upside, the first area to monitor is the classic R1 pivot near 0.43. A daily close above this level would bring the 0.54–0.56 region, around R2 and R3, back into focus as the next resistance band. On pullbacks, initial support aligns with the classic pivot near 0.38. The 100-day simple moving average around 0.44 represents a key technical level that would need to be reclaimed to ease downside pressure, while a move towards S1 near 0.28 would mark a deeper test of the recent lower zone (TradingView, 30 January 2026)
This technical analysis is provided for informational purposes only and does not constitute financial advice or a recommendation to buy or sell any instrument.
Cardano price history (2024–2026)
Over the past two years to 30 January 2026, ADA’s price has swung from a strong bull phase above $1.10 in mid-January 2025 to trading back near $0.33, highlighting the extent of volatility during this period. After starting 2025 around $0.92 and briefly pushing as high as roughly $1.17 on 3 March, the price then rolled over. Sharp moves in March and early April gave way to a choppy downtrend, with ADA finishing 2025 at about $0.33.
In 2024, ADA climbed from the low $0.30s in early September to peaks above $1.20 in early December, before fading into year-end as profit-taking and weaker market sentiment emerged. Across 2024 and 2025, the chart shows repeated rallies towards the $0.70–$0.90 area that ultimately failed. The token later slipped below $0.40 again in late December 2025 and early 2026, leaving it roughly two-thirds below its early-2025 highs by 30 January 2026.
Past performance is not a reliable indicator of future results. Share prices are indicative and may differ from live market prices.
Capital.com analyst view: Cardano
Cardano’s ADA has spent much of the past two years alternating between brief rallies and extended pullbacks, underscoring its sensitivity to broader crypto cycles and shifts in liquidity conditions. On the one hand, recent data point to a still-active ecosystem and periodic bouts of relative outperformance versus larger peers. On the other, the price has retreated from its early-2025 highs to trade closer to levels seen before that run-up, illustrating how both upside and downside moves can unfold quickly.
From a drivers perspective, structural factors such as ongoing protocol upgrades, decentralised finance development, and derivatives listings are often cited as potential supports for ADA, although their impact is not always linear. Increased on-chain activity and new futures products may attract additional participation and deepen liquidity, but they can also amplify volatility. Prices may become more exposed if risk appetite fades or if competition, regulatory uncertainty, or technical setbacks weigh on sentiment instead. Past performance is not a reliable indicator of future results.
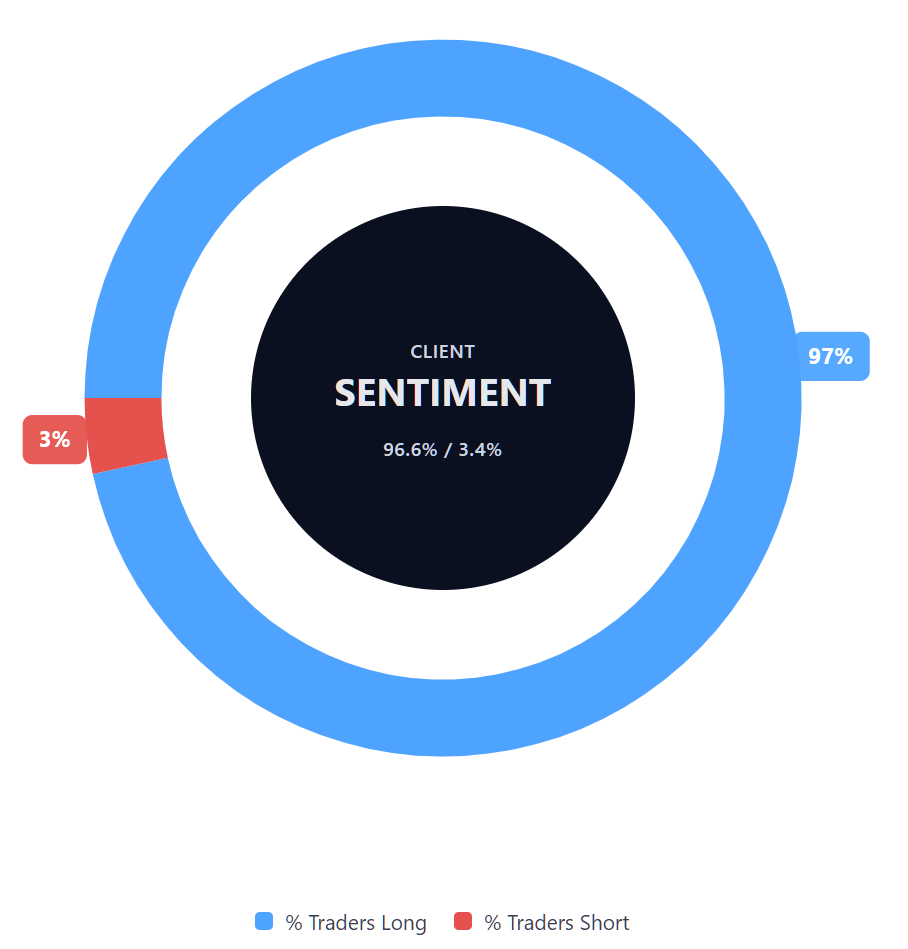
Capital.com’s client sentiment for Cardano CFDs
As of 30 January 2026, Capital.com client positioning in Cardano CFDs is heavily skewed to the upside, with 96.6% of open positions held by buyers versus 3.4% by sellers. This represents a heavy long bias, with buyers ahead by around 93 percentage points. This snapshot reflects open positions on Capital.com at a specific point in time and may change as traders adjust their exposure.
Summary – Cardano (2026)
- ADA has been volatile over the past two years, moving from above $1.10 in early 2025 to around $0.33 by 30 January 2026.
- After starting 2025 near $0.92, Cardano briefly pushed towards $1.17 in early March before sliding into a choppy downtrend and ending the year close to $0.33.
- Technical signals currently show ADA trading below its main daily moving averages, with RSI in lower-neutral territory and ADX pointing to an established trend backdrop.
- Cardano’s price remains sensitive to protocol developments, market-wide risk appetite, regulation, and competition from other layer-1 networks, all of which can influence price action in either direction over time.
Past performance is not a reliable indicator of future results.
FAQ
What is the latest Cardano crypto price prediction?
Recent third-party Cardano price predictions published in late 2025 and early 2026 vary widely, reflecting different assumptions about network development, broader crypto market conditions, and overall risk appetite. Some analysts outline scenarios in which ADA trades around the $0.50 area in 2026, while more optimistic long-term models extend into multi-dollar ranges. These projections are illustrative rather than definitive and highlight the uncertainty that remains around future price paths.
Who owns the most Cardano?
Cardano does not have a single owner, as ADA is a decentralised cryptocurrency distributed across many wallets globally. Larger holdings are typically associated with early adopters, long-term investors, staking pools, exchanges, and entities involved in network development. Public blockchain data allows observers to track wallet balances, although ownership concentration can change over time as tokens move between addresses, exchanges, and participants within the Cardano ecosystem.
How many Cardanos are there?
Cardano has a capped maximum supply of 45 billion ADA tokens, set at the protocol level. As of early 2026, the majority of this supply is already in circulation, with the remainder distributed gradually through staking rewards. This fixed supply structure contrasts with inflationary models used by some other digital assets, although changes in the circulating supply can still influence price dynamics depending on demand, trading activity, and broader market conditions.
Could Cardano’s price go up or down?
Cardano’s price can move in either direction and has shown significant volatility over recent years. Factors that may influence price action include broader cryptocurrency market sentiment, protocol upgrades, regulatory developments, competition from other layer-1 networks, and shifts in liquidity or risk appetite. While network development and adoption can support activity, downside moves remain possible if sentiment weakens or external pressures emerge.
Should I invest in Cardano?
Whether Cardano is suitable depends on individual circumstances, objectives, and risk tolerance. Cryptocurrencies, including ADA, are volatile and can experience sharp price movements over short periods. This article provides market context and third-party analysis for informational purposes only and does not constitute investment advice. Anyone considering exposure may wish to assess the risks carefully and, where appropriate, seek independent financial guidance.
Can I trade Cardano CFDs on Capital.com?
Yes, you can trade Cardano CFDs on Capital.com. Trading crypto CFDs lets you speculate on price movements without owning the underlying asset and to take long or short positions. However, contracts for difference (CFDs) are traded on margin, and leverage amplifies both profits and losses. You should ensure you understand how CFD trading works, assess your risk tolerance, and recognise that losses can occur quickly.