Bitcoin price prediction: Iran tensions, Fed watch
Bitcoin trades in the mid-$60,000s after briefly nearing $68,000 following reports on Iran’s leadership, with price action also shaped by Federal Reserve expectations and spot Bitcoin ETF flows. Explore third-party BTC price targets and technical analysis.
Bitcoin (BTC/USD) is trading near $66,100 in the morning session on 2 March 2026, moving within an intraday range of $65,214–$67,739 on Capital.com’s feed at 11:10am UTC, as the market consolidates after recent volatility in the mid-$60,000 area. Intraday conditions reflect choppy trading around levels seen over the weekend, when Bitcoin fluctuated near $66,000 amid rapid reactions to geopolitical headlines and shifting risk appetite across digital assets. Past performance is not a reliable indicator of future results.
Price action is unfolding amid elevated geopolitical tension linked to conflict involving Iran (Yahoo Finance, 2 March 2025). Bitcoin briefly moved toward $68,000 following reports concerning Iran’s leadership before easing back as uncertainty persisted (Yahoo Finance, 1 March 2026). Market participants continue to monitor upcoming economic data and the Federal Reserve’s mid-month meeting, alongside ongoing swings in spot Bitcoin ETF flows and broader crypto market liquidity (Investing.com, 20 February 2026).
Bitcoin price prediction 2026-2030: Analyst price target view
As of 2 March 2026, third-party BTC price predictions highlight a wide range of potential outcomes and significant sensitivity to institutional flows, macroeconomic conditions and overall risk sentiment. The following summaries outline selected third-party targets and scenario-based projections for BTC/USD published in February–March 2026.
Standard Chartered (2026 year-end target)
Standard Chartered expects Bitcoin to end 2026 around $100,000, cutting its previous year-end 2026 target of $150,000 in a February 2026 strategy update. The bank also flagged the possibility of a decline toward $50,000 before any recovery. It describes this as a still-positive longer-term view supported by ETF-led institutional demand, while warning that tighter liquidity and softer risk appetite could weigh on prices as markets adjust to reduced inflows (Bloomberg, 12 February 2026).
24/7 Wall St. (downside scenario flag)
24/7 Wall St. notes that Stifel strategists present a scenario in which Bitcoin could fall toward $38,000, using a long-term trendline as a reference point while also citing a contrasting JPMorgan view that allows for upside toward $170,000. The piece underscores how these divergent profiles reflect different readings of macro risks, liquidity cycles and positioning across crypto markets (24/7 Wall St., 25 February 2026).
Finbold (economist cycle call)
Finbold reports that macro economist Henrik Zeberg outlines a primary scenario in which Bitcoin peaks in the $110,000–$120,000 area in March 2026, with an alternative extension case toward $140,000–$150,000. Zeberg frames the call around a 'risk-on' phase with strong spot ETF inflows and continued institutional adoption as key drivers (Finbold, 1 March 2026).
Coinpedia (strategist upside scenario)
Coinpedia highlights commentary that places a Bitcoin target regionally around $100,000 in a base case for the current cycle, with scope for a further move into the $110,000–$120,000 band under stronger momentum. The article notes that this view leans on expectations of robust ETF-driven inflows and sustained institutional participation amid easing macro headwinds (Coinpedia, 2 March 2026).
Predictions and third-party forecasts are inherently uncertain, as they cannot fully account for unexpected market developments. Past performance is not a reliable indicator of future results.
BTC price: Technical overview
The BTC/USD price is trading around $66,100 early Monday, sitting just below a dense moving-average cluster. The 20-, 50-, 100- and 200-day simple moving averages (SMAs) stand near 67,143, 77,218, 83,361 and 96,821 respectively. The relative strength index (RSI 14) near 40 remains in lower-neutral territory, while the average directional index (ADX 14) around 49 indicates an established trend. Together, these readings suggest mixed momentum as price holds beneath the short-term moving-average band.
On the topside, traders may watch the classic R1 pivot around 73,161. A daily close above this level would bring the R2 region near 88,142 into focus as a broader recovery zone.
On pullbacks, initial support lies near the classic pivot at 68,750. A sustained move below this level could shift attention toward the S1 area around 58,179, potentially exposing deeper downside levels beneath recent trading ranges. Shorter-term indicators, including the 10-day SMA near 66,448 and the volume-weighted moving average (VWMA 20) around 66,939, currently slope lower, which may reinforce near-term pressure if selling persists (TradingView, 2 March 2026).
This technical analysis is provided for informational purposes only and does not constitute financial advice or a recommendation to buy or sell any instrument.
Bitcoin price history (2024–2026)
BTC/USD’s price traded within a broad and volatile range through 2024 and early 2025, moving from below $55,000 in August 2024 to above $120,000 at points in mid-2025. Liquidity conditions, macroeconomic developments and crypto-specific events contributed to sharp intraday fluctuations. After dipping under $50,000 in early August 2024, BTC/USD recovered into year-end, closing 2024 near $93,400 before extending above $100,000 in January 2025.
In 2025, BTC/USD reached highs above $123,000 in August before losing momentum. By late December, it had declined toward the mid-$80,000s amid uneven trading conditions. Into 2026, the pair retreated further from those peaks, closing at about $88,800 on 1 January 2026 and moving toward the mid-$60,000s by late February and early March as volatility remained elevated.
Past performance is not a reliable indicator of future results.
Capital.com analyst view: Bitcoin
Over the past two years, Bitcoin has experienced significant price swings, with BTC/USD moving from below $55,000 in August 2024 to peaks above $120,000 in mid-2025 before retracing toward the mid-$80,000s by year-end. These movements reflected shifting macroeconomic conditions, changing expectations for interest rates and liquidity, and evolving sentiment toward digital assets. At times, market participants treated Bitcoin as a risk-sensitive asset; at others, they viewed it as a potential store-of-value alternative.
In early 2026, BTC/USD continues to trade with elevated volatility, pulling back from late-2025 highs to the mid-$60,000s. Short-term flows respond to geopolitical developments, regulatory updates and changes in crypto-linked product demand. The same factors that may support prices — such as broader institutional participation or portfolio diversification — can also contribute to downside risk if liquidity tightens or risk appetite declines. As a result, price movements in either direction can develop quickly.
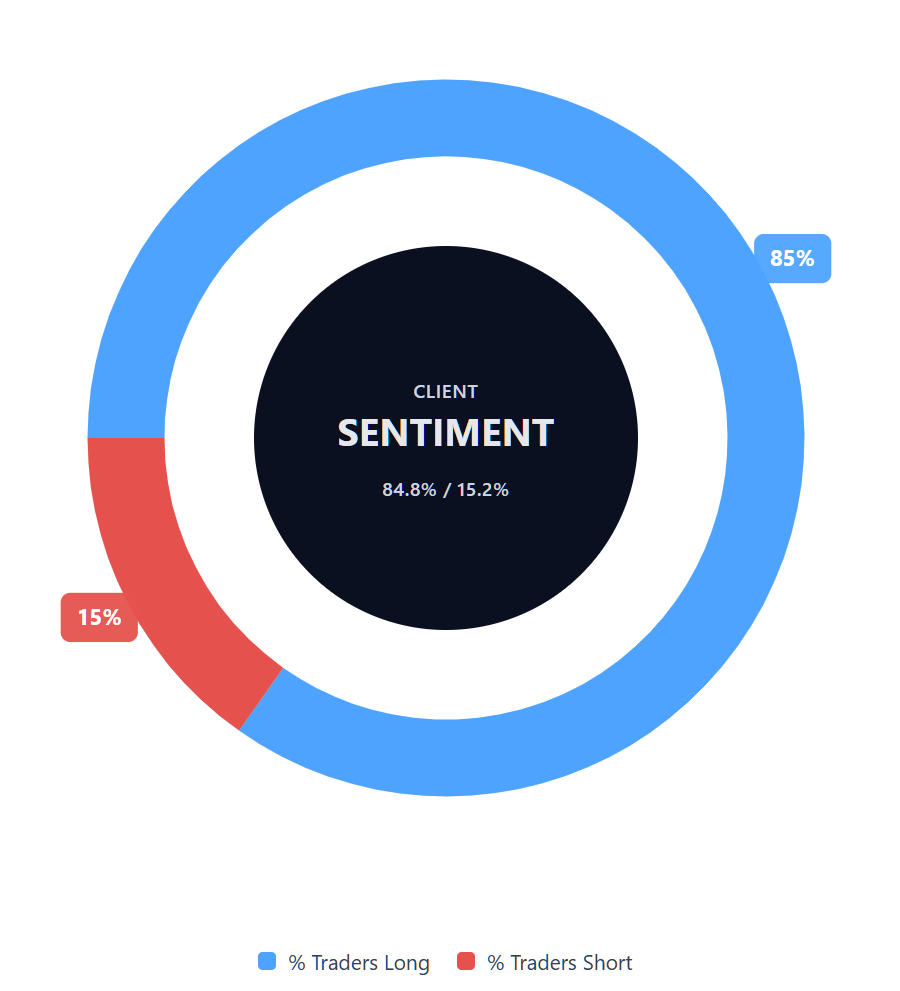
Capital.com’s client sentiment for Bitcoin CFDs
As of 2 March 2026, Capital.com client positioning in Bitcoin CFDs shows 84.8% buyers and 15.2% sellers, leaving buyers ahead by approximately 69 percentage points. This distribution indicates that open positions are concentrated on the long side rather than evenly balanced.
Client sentiment reflects live positioning on the Capital.com platform and can change as market conditions evolve.
Summary – Bitcoin (2026)
- As of 11:10am UTC on 2 March 2026, Bitcoin (BTC/USD) trades near $66,100, after moving between sub-$55,000 levels and above $120,000 over the past two years.
- Daily technical indicators show BTC/USD trading below its 20-, 50-, 100- and 200-day moving averages, with RSI near 40 and ADX around 49 indicating an established trend with mixed momentum.
- Key drivers include macroeconomic conditions, interest-rate and liquidity expectations, developments in crypto regulation, and flows into or out of Bitcoin-linked products.
- Recent news flow highlights geopolitical tension involving Iran and variable risk appetite across markets, with Bitcoin continuing to react to headline-driven developments around the mid-$60,000 area.
Past performance is not a reliable indicator of future results.
FAQ
What is the latest Bitcoin crypto price prediction?
There is no single latest Bitcoin price prediction. As outlined above, third-party forecasts for 2026 range widely, with some analysts projecting six-figure levels, while also acknowledging the possibility of significant drawdowns along the way. These projections typically depend on factors such as institutional flows, macroeconomic conditions, liquidity and adoption trends. Forecasts reflect opinion and modelling assumptions, not guarantees, and actual outcomes may differ materially.
Who owns the most Bitcoin?
Bitcoin ownership is distributed across individual holders, institutional investors, exchanges and corporate entities. Public blockchain data shows that a relatively small number of wallet addresses hold large balances, although a single address may represent an exchange or custodian holding assets on behalf of many users. Some publicly listed companies and investment funds also disclose Bitcoin holdings. Ownership concentration can influence liquidity and volatility, particularly during periods of heightened market activity.
How many Bitcoins are there?
Bitcoin has a fixed maximum supply of 21 million coins, as defined by its underlying protocol. New bitcoins enter circulation through a process known as mining, where participants validate transactions and secure the network. The issuance rate slows over time through programmed ‘halving’ events, which reduce block rewards approximately every four years. This capped supply forms part of Bitcoin’s value proposition, although price remains driven by demand dynamics and market conditions.
Could Bitcoin’s price go up or down?
Bitcoin’s price can move sharply in either direction. It responds to a range of influences, including macroeconomic developments, interest-rate expectations, regulatory updates, geopolitical events, institutional participation and shifts in market sentiment. Liquidity conditions and positioning can also amplify short-term moves. While some investors view limited supply as supportive over the long term, volatility remains a defining feature, and both gains and losses can occur quickly.
Should I invest in Bitcoin?
Whether to invest in Bitcoin depends on your financial circumstances, objectives and risk tolerance. Bitcoin is highly volatile and can experience substantial price swings over short periods. You should consider your investment horizon, ability to absorb losses and overall portfolio diversification before making any decision. This information is provided for educational purposes only and does not constitute investment advice. You may wish to seek independent financial advice if needed.
Can I trade Bitcoin CFDs on Capital.com?
Yes, you can trade Bitcoin CFDs on Capital.com. Trading crypto CFDs lets you speculate on price movements without owning the underlying asset and to take long or short positions. However, contracts for difference (CFDs) are traded on margin, and leverage amplifies both profits and losses. You should ensure you understand how CFD trading works, assess your risk tolerance, and recognise that losses can occur quickly.