Bitcoin price prediction: US-Iran deal, ETF outflows
Bitcoin’s 2026 price action reflects ETF outflows, Fed policy signals and easing geopolitical risk after the US–Iran peace agreement. Explore third-party BTC price targets and technical analysis. Past performance is not a reliable indicator of future results.
Bitcoin (BTC/USD) is trading at $64,035.15 as of 11:39am UTC on 22 June 2026, within an intraday range of $63,235.05–$64,588.15. Past performance is not a reliable indicator of future results.
Several intersecting drivers have shaped recent price action. The formal signing of the US–Iran peace agreement in Switzerland on 19 June 2026, which included an immediate halt to military operations and the reopening of the Strait of Hormuz, reduced geopolitical risk premiums and lifted risk assets broadly after BTC had fallen to a low near $59,000 the prior week (Al Jazeera, 18 June 2026). Bitcoin spot ETFs recorded a net outflow of $90.66m on 18 June, led by BlackRock's IBIT at $96.66m, adding near-term selling pressure even as Morgan Stanley's newly launched MSBT attracted $10.43m in inflows during the same session (PANews, 19 June 2026). Broader macro sentiment has remained cautious ahead of Federal Reserve policy signals, with elevated US Treasury yields continuing to raise the opportunity cost of holding non-yielding assets (Investing.com, 8 June 2026). Meanwhile, oil prices declined as Middle East supply concerns eased following the ceasefire framework, helping to keep inflation expectations in check and limiting a stronger recovery in risk assets, including crypto (CNBC, 21 June 2026).
Third-party BTC forecast: US-Iran deal and ETF outflows
As of 22 June 2026, third-party BTC price predictions show a wide range of outcomes, shaped by post-halving supply dynamics, ETF flows, macroeconomic conditions and geopolitical developments. The targets below summarise third-party predictions for the BTC/USD market.
Reuters (technical analysis note)
Reuters notes that Bitcoin has lost around 50% of its value since its record peak in October 2025, placing it near the widely watched $60,000 level, which technical analysts have identified as a key support threshold. The piece flags $50,000 as the next notable downside reference, after prior support at $60,000 was tested in February 2026. A sustained recovery, it adds, would need to reclaim levels broken during the spring selloff (Reuters, 8 June 2026).
Coinpedia (June 2026 price outlook)
Coinpedia identifies a near-term demand zone at $64,000–$66,000, noting that price has stabilised in this area following a rejection near $80,000 and a subsequent drop from the $70,000 support level. The publication states that a recovery above $70,000–$71,000 would be needed to bring $76,000–$80,000 back into focus. A failure to hold current levels, however, could put $60,000 back in view, with ongoing ETF outflows and geopolitical uncertainty cited as key headwinds (Coinpedia, 15 June 2026).
CoinCodex (algorithmic model forecast)
CoinCodex projects Bitcoin to trade within a range of $64,963–$92,500 across the remainder of 2026, with its algorithmic model placing the average annualised price at $83,218. The model flags a bearish near-term signal, with 20 out of 30 technical indicators reading bearish as of 21 June 2026. It also notes BTC's 50-day simple moving average at $72,450 and 200-day simple moving average at $76,911, both well above the current price, as key overhead resistance references (CoinCodex, 21 June 2026).
Yahoo Finance (June 2026 price reporting)
Yahoo Finance reports Bitcoin opened at $63,553.08 on 12 June 2026, up 3.4% from the prior day's open, reflecting a partial recovery after BTC/USD's multi-week slide. The report notes that price action remains closely linked to broader risk appetite, with rate expectations, equity market flows toward AI names and upcoming IPOs continuing to shape short-term direction (Yahoo Finance, 12 June 2026).
Reuters (capital flows and market context)
Reuters reports that Bitcoin recorded its steepest year-to-date decline at this point in the calendar since at least 2015, citing LSEG data showing net ETF outflows of more than $2.7bn in the week to 5 June 2026. Total 2026 net outflows had reached $3.1bn, as capital rotated toward AI equities and high-profile upcoming IPOs. The wire service also notes that Bitcoin's share of total cryptocurrency market capitalisation stood at 56% according to CoinGecko data, down from 63% a year prior, pointing to a shift in investor allocation across digital assets (Reuters, 6 June 2026).
Predictions and third-party forecasts are inherently uncertain, as they cannot fully account for unexpected market developments. Past performance is not a reliable indicator of future results.
BTC price: technical overview
The BTC/USD price trades at $64,035.15 as of 11:39am UTC on 22 June 2026, sitting below its key moving averages. The 20/50/100/200-day SMAs stand at approximately $63,539 / $71,813 / $72,235 / $76,587, with price currently beneath all four. This points to a weaker technical set-up and reflects the broader downtrend from the October 2025 peak. The 20-day SMA at $63,539 sits marginally below the last price, offering a nearby reference, while the Hull moving average (9) at $63,324 and the volume-weighted moving average (20) at $63,145 suggest short-term trend pressure remains tilted to the downside, according to TradingView data.
Momentum indicators are mixed-to-soft. The 14-day relative strength index reads 41, placing it in neutral-to-weak territory, below the 50 midline but not yet at oversold extremes. The average directional index (14) at 36 indicates an established trend is in force, suggesting the prevailing directional move still carries some conviction.
On the upside, the classic R1 pivot at $80,136 represents the first overhead reference. A sustained daily close above that level would put the R2 area near $86,704 in view. To the downside, the classic pivot at $76,265 sits above current price, with S1 at $69,697 as the next classic support reference, followed by S2 near $65,827, close to present levels (TradingView, 22 June 2026).
This is technical analysis for informational purposes only and does not constitute financial advice or a recommendation to buy or sell any instrument.
Bitcoin price history (2024–2026)
BTC/USD’s price was trading around $63,200 in late June 2024, holding a range formed after the April 2024 halving event, which reduced the block reward from 6.25 BTC to 3.125 BTC. Analysts often monitor halvings because previous cycles have been followed by strong rallies, though past performance is not a reliable indicator of future returns.
Price climbed steadily into year-end, breaching $100,000 for the first time in December 2024, supported by the launch of US spot Bitcoin ETFs earlier in the year and a surge in institutional inflows. BTC closed 2024 at approximately $93,400. The rally extended into early 2025, with BTC touching $109,146 on 20 January 2025, coinciding with Donald Trump’s presidential inauguration and optimism around a more supportive cryptocurrency regulatory environment. Further gains followed through mid-2025, with BTC reaching an all-time high near $126,287 on 6 October 2025.
The picture shifted sharply in late 2025 and into 2026. BTC closed 2025 at approximately $87,524, already off its highs. Escalating US–Iran tensions in early 2026 weighed on risk assets, with price sliding to near $63,400 on 28 February 2026 after military strikes. A brief partial recovery faded, and BTC fell to a 2026 low of around $59,120 on 5 June 2026 before stabilising.
BTC closed at $64,084.15 on 22 June 2026, approximately 26.8% down year to date and 36.6% lower year on year.
Past performance is not a reliable indicator of future results. Prices are indicative and may differ from live market prices.
Capital.com analyst view: Bitcoin
Bitcoin’s 2026 price trajectory reflects a sharp reversal from the record highs of late 2025, when BTC briefly traded above $126,000. The year began near $88,000 and has trended lower, weighed by persistent ETF outflows, with cumulative 2026 net outflows reaching $3.1bn by early June, according to Reuters, and a broader rotation of institutional capital toward AI equities and high-profile IPOs. Geopolitical volatility, particularly the US–Iran conflict earlier in the year, amplified downside moves and added uncertainty across risk assets, including crypto. At the same time, BTC’s periodic recoveries during those tensions, rising roughly 6% during some flare-ups, per CoinShares research, suggest some participants continued to treat the asset as a potential hedge, even as others exited.
The structural picture is more nuanced. Continued institutional infrastructure buildout, including expanded ETF distribution through major US banks, has supported baseline demand, while a potential easing in geopolitical risk following the June 2026 US–Iran peace agreement could help stabilise sentiment. However, BTC currently trades well below all major moving averages, and sustained ETF outflows, tighter macro conditions and competition for risk capital remain meaningful headwinds. Whether current levels represent a base or a pause in a broader decline depends on factors that remain unresolved.
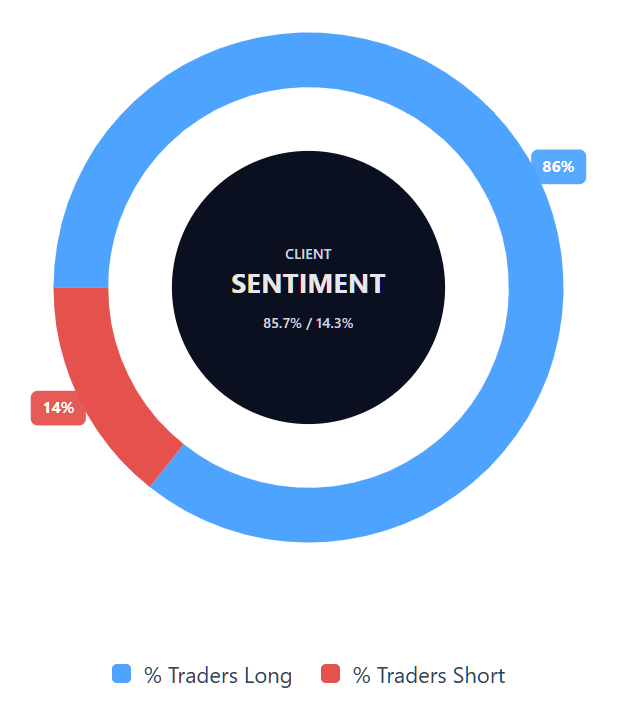
Capital.com’s client sentiment for Bitcoin CFDs
As of 22 June 2026, Capital.com client positioning in Bitcoin CFDs sits at 85.7% buyers vs 14.3% sellers, putting buyers ahead by 71.4 percentage points and placing sentiment in heavy-buy, one-sided-toward-longs territory. This snapshot reflects open positions on Capital.com and can change.
Summary – Bitcoin (2026)
- Bitcoin (BTC) trades at $64,035.15 as of 11:39am UTC on 22 June 2026, down approximately 26.8% year to date and 36.6% year on year.
- Key price drivers include persistent US spot Bitcoin ETF outflows totalling $3.1bn in 2026, a rotation of institutional capital toward AI equities, and geopolitical volatility tied to the US–Iran conflict earlier this year.
- The formal signing of the US–Iran peace agreement on 19 June 2026 reduced geopolitical risk premiums, offering some near-term support, although BTC spot ETFs still recorded a net outflow of $90.66m on 18 June.
Past performance is not a reliable indicator of future results.
FAQ
What is the latest Bitcoin crypto price prediction?
Third-party Bitcoin price predictions remain wide. Recent forecasts cited in the article place near-term support around $60,000–$66,000, while CoinCodex’s algorithmic model projects a possible 2026 range of $64,963–$92,500. These estimates reflect technical levels, ETF flows, macro conditions and geopolitical developments. Forecasts can change quickly, so they should be treated as scenarios rather than reliable indicators of future performance.
Who owns the most Bitcoin?
Satoshi Nakamoto, Bitcoin’s pseudonymous creator, is generally treated as the largest estimated Bitcoin holder when related early-mining wallets are grouped together. Arkham’s 2026 analysis attributes around 1.096m BTC to Satoshi, based on the so-called Patoshi mining pattern. Ownership data is imperfect because wallet labels can be uncertain, some holdings sit with custodians on behalf of customers, and many large addresses remain unidentified.
How many Bitcoins are there?
Bitcoin has a maximum supply of 21m BTC. As of 21 June 2026, MacroMicro data showed around 20.05m BTC in circulation, meaning less than 1m BTC remains to be mined. New bitcoin enters circulation through mining rewards, which were reduced from 6.25 BTC to 3.125 BTC at the April 2024 halving. Circulating supply does not necessarily equal actively available supply, as some coins may be lost or inactive.
Could Bitcoin’s price go up or down?
Yes. Bitcoin’s price could rise or fall depending on ETF flows, interest-rate expectations, risk appetite, regulatory developments, institutional demand and broader market sentiment. In the article, analysts point to support around $60,000–$66,000 and resistance around $70,000–$72,000. A move through either area could affect short-term momentum, but technical levels are not guaranteed. Crypto markets can be volatile, and CFDs add further risk because of leverage.
Should I invest in Bitcoin?
Whether Bitcoin is suitable depends on your financial situation, risk tolerance, goals and understanding of crypto markets. Bitcoin has delivered periods of strong gains and sharp losses, and the article shows how quickly sentiment can shift with ETF flows, macro signals and geopolitical events. This content is for information only and isn’t financial advice. Consider independent advice if you’re unsure, and never trade or invest money you can’t afford to lose.
Can I trade Bitcoin CFDs on Capital.com?
Yes, you can trade Bitcoin CFDs on Capital.com. Trading crypto CFDs lets you speculate on price movements without owning the underlying asset and to take long or short positions. However, contracts for difference (CFDs) are traded on margin, and leverage amplifies both profits and losses. You should ensure you understand how CFD trading works, assess your risk tolerance, and recognise that losses can occur quickly.