US Equities Recover, Yet Key Technical Barriers Remain Intact
US markets rebounded on Monday, 13 October, following Friday’s sharp sell-off.
US markets rebounded on Monday, 13 October, following Friday’s sharp sell-off. Attention now turns to Tuesday, 14 October, when FOMC Chairman Jay Powell is scheduled to speak at the National Association for Business Economics Annual Meeting at 11:20 a.m. ET, with the lead-up to that event potentially prompting heightened market volatility.
Equity Indices Rebound
The S&P 500 finished on 13 October higher by about 1.5%. For the most part, the rally appeared to be driven by implied volatility and options positioning.
On Friday, implied volatility levels, particularly on the VIX 1-Day Index, reached elevated levels. As expected, these volatility metrics reset sharply lower at the open on Monday morning, helping to push the S&P 500 higher by around 1.5%. Once implied volatility stabilised, the S&P 500 also stalled, becoming pinned around a major options gamma level near the 6,650 area.
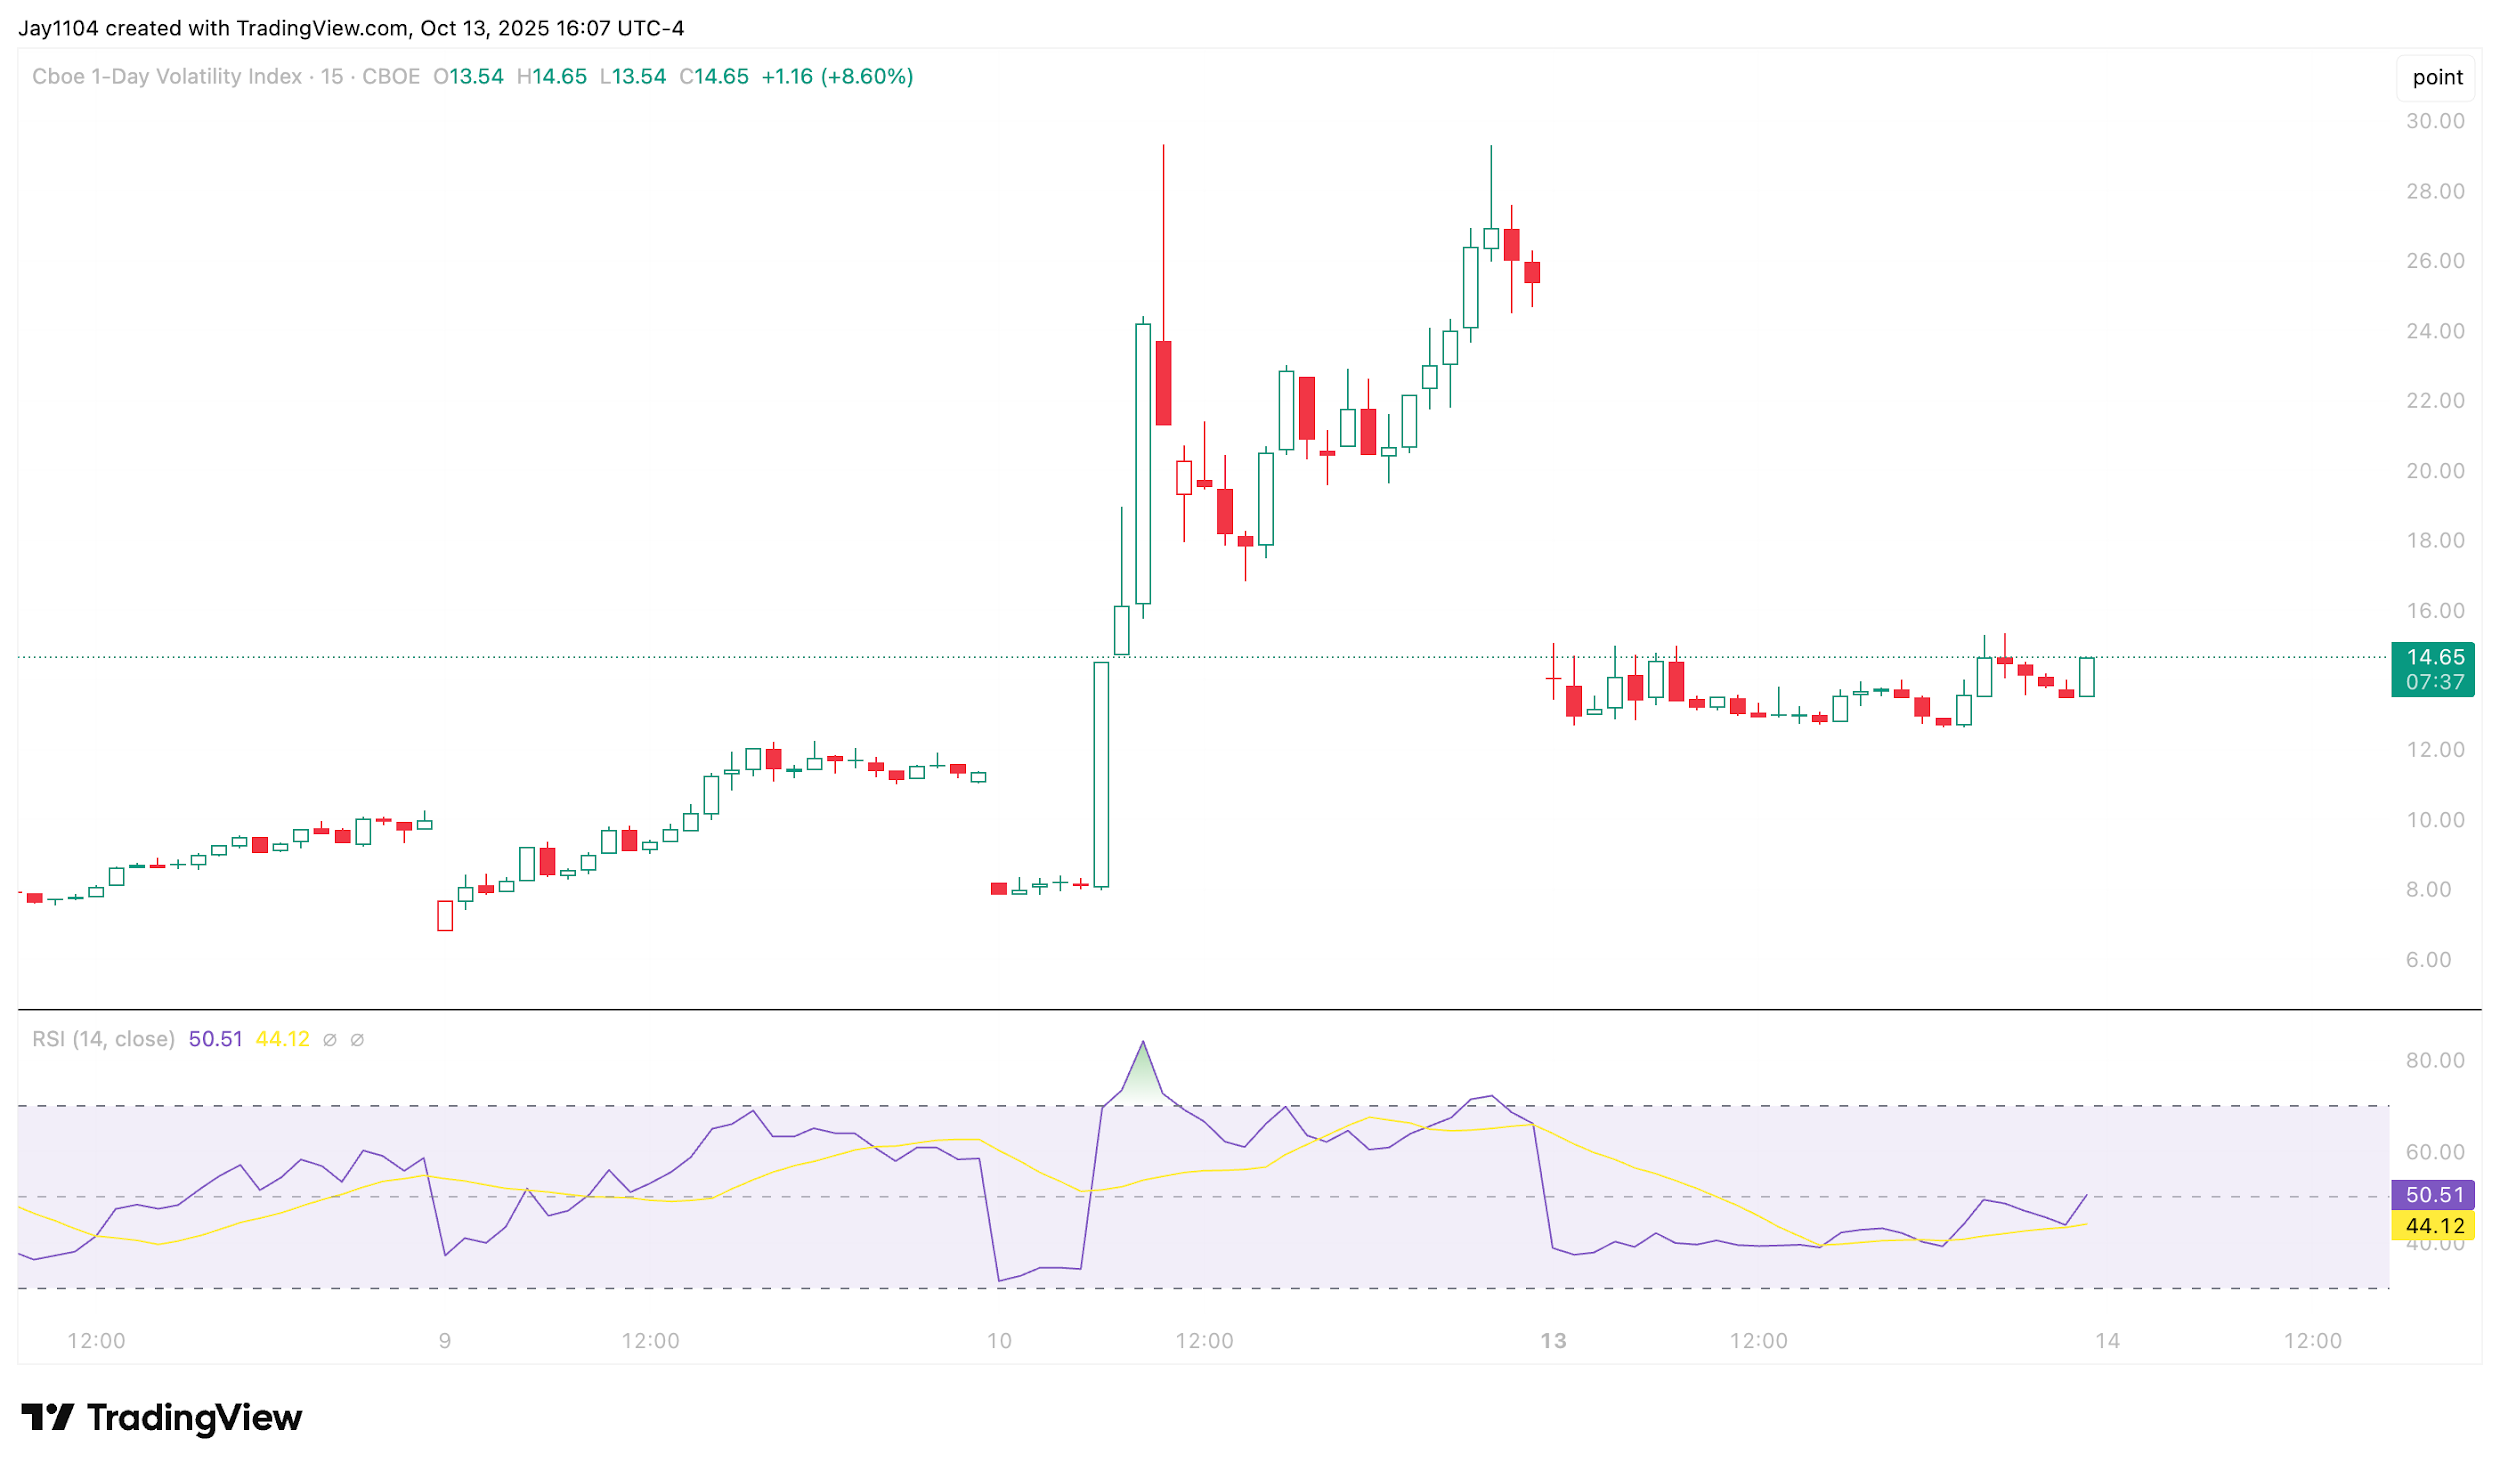
(Source: TradingView)
Past performance is not a reliable indicator of future results.
More intricately, the S&P 500 also struggled to move above its 20-day moving average — a key technical level. Remaining below this average suggests systematic fund flows could act as sellers in the market.
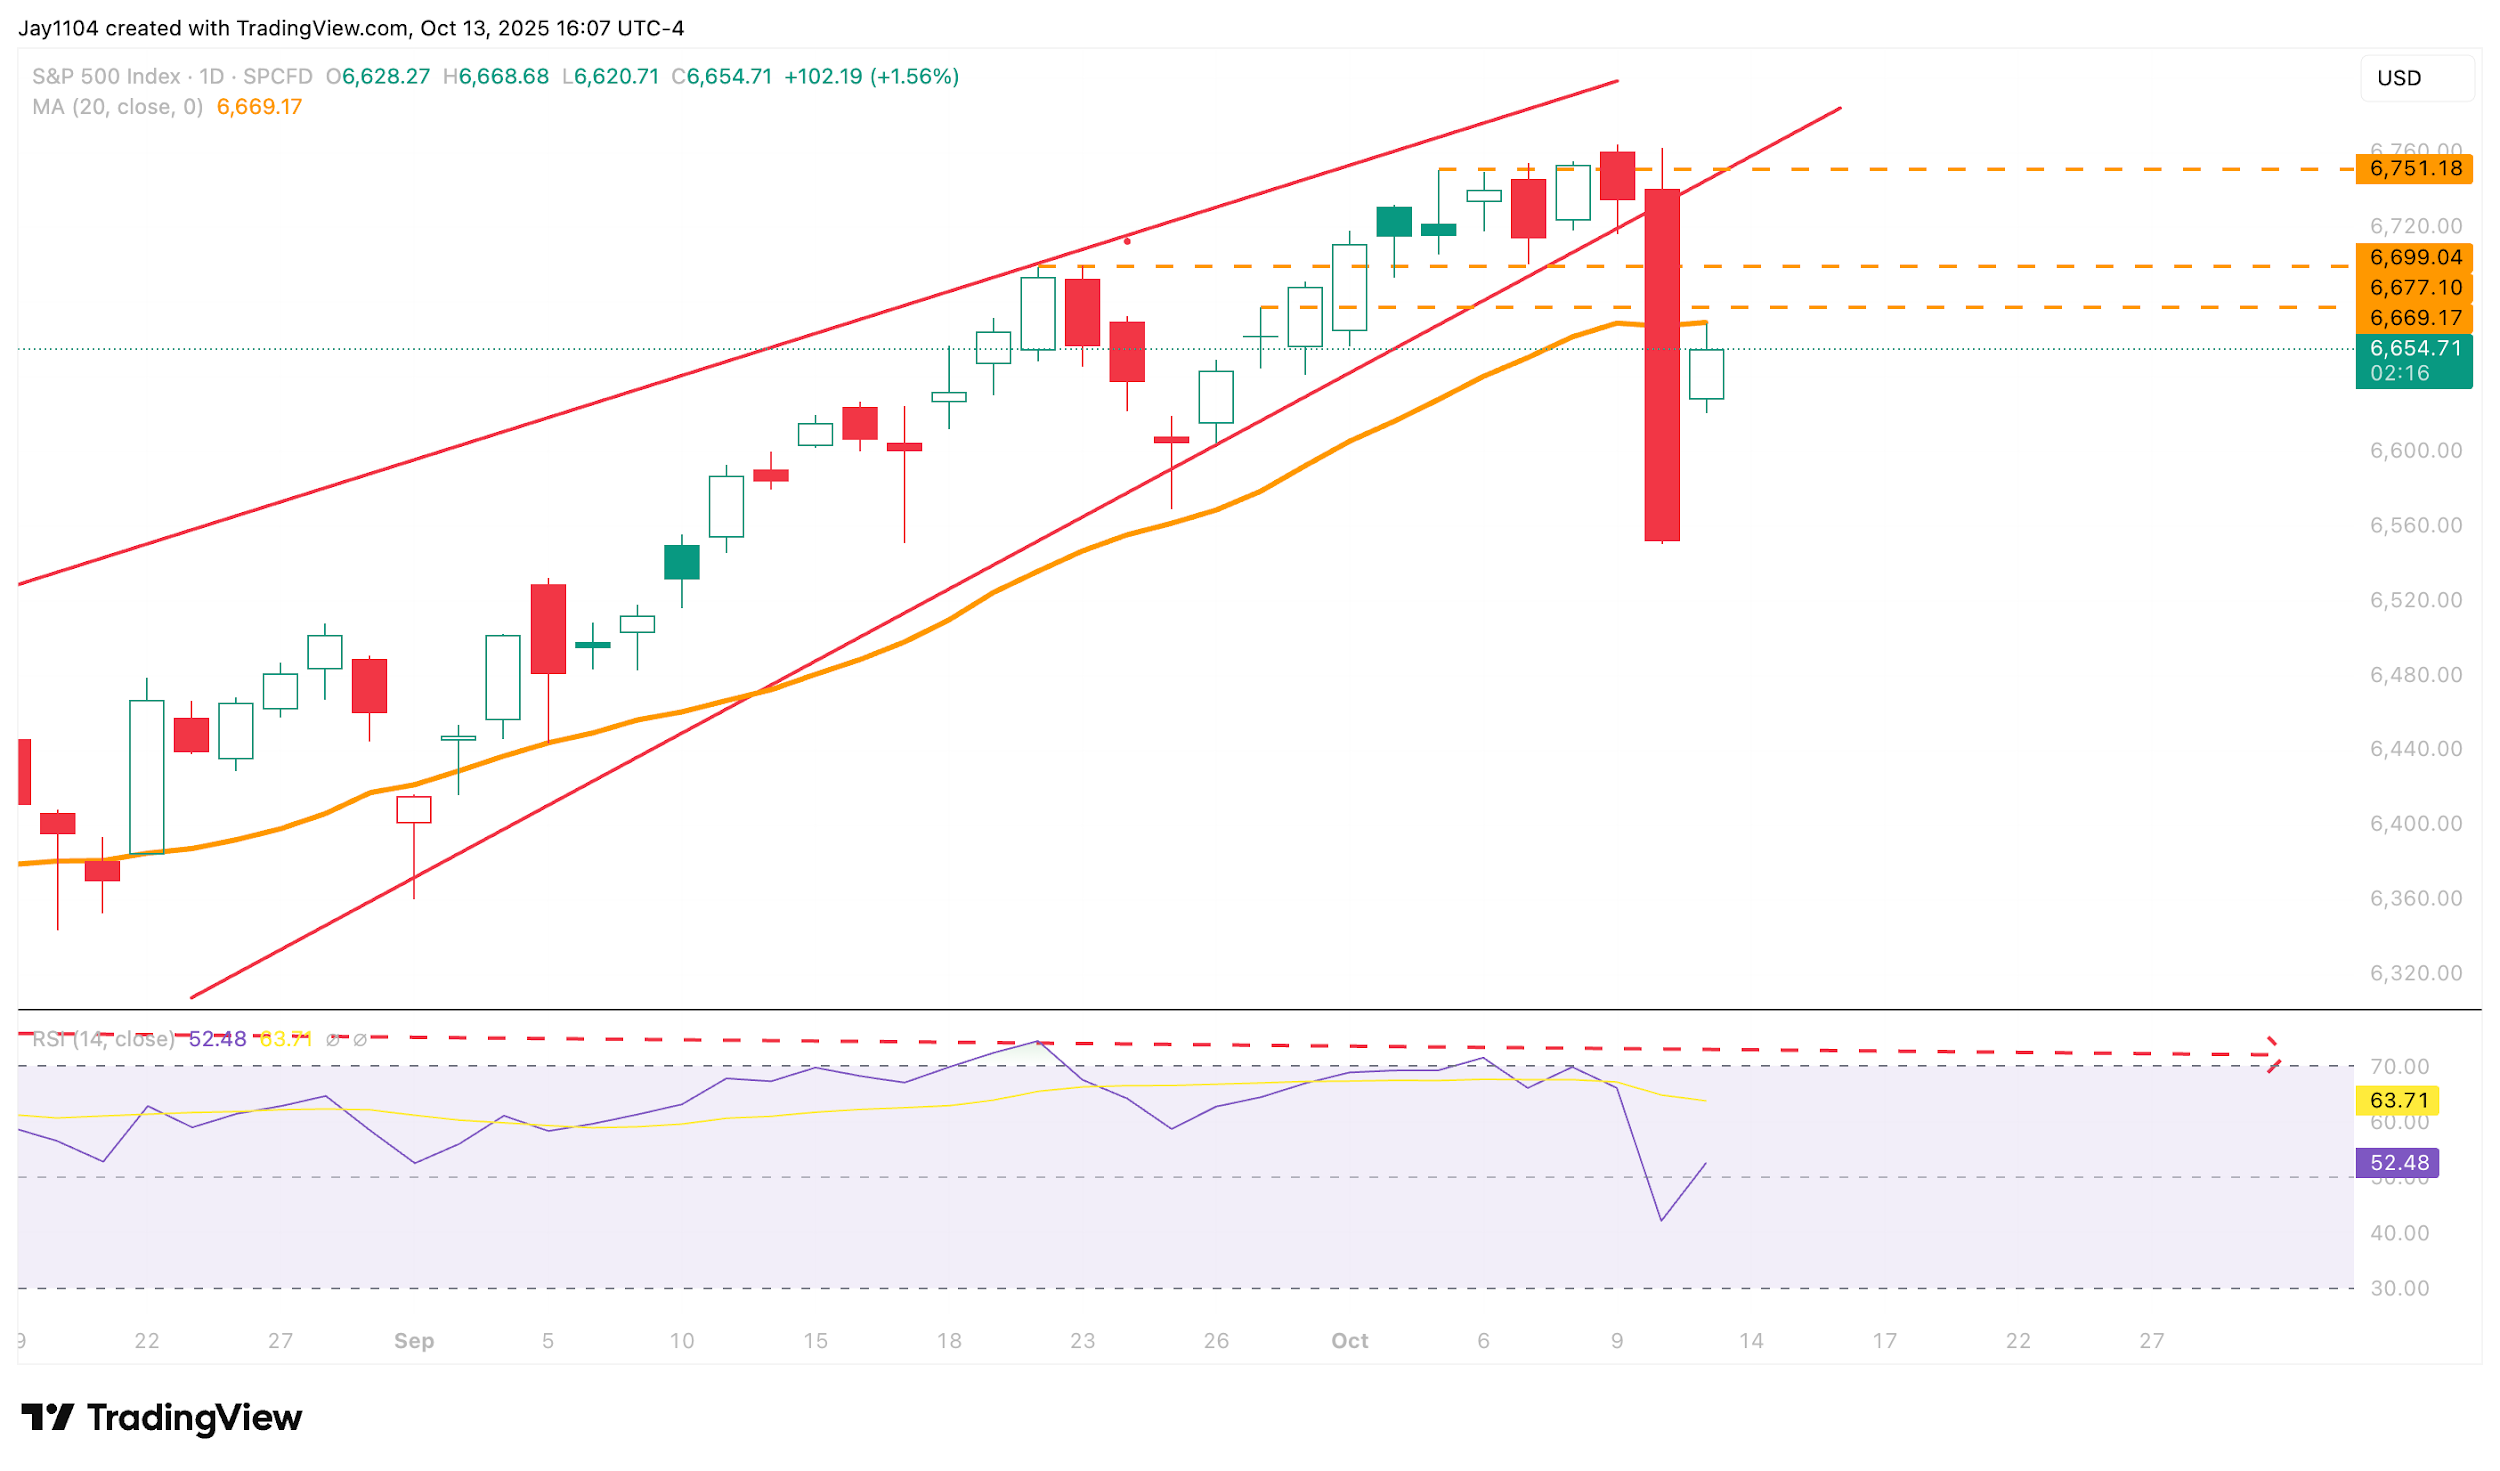
(Source: TradingView)
Past performance is not a reliable indicator of future results.
It’s also worth noting that Friday’s late-day drop formed a sharp, straight-line decline into the close, followed by a gap higher on Monday’s open. Such patterns are typically unstable and often get filled relatively quickly. Therefore, it would not be surprising if the S&P 500 were to give back much of Monday’s gains over the next few sessions, now that volatility levels have largely reset — particularly while the index remains below its 20-day moving average, which is also likely to remain a big level of resistance for now.
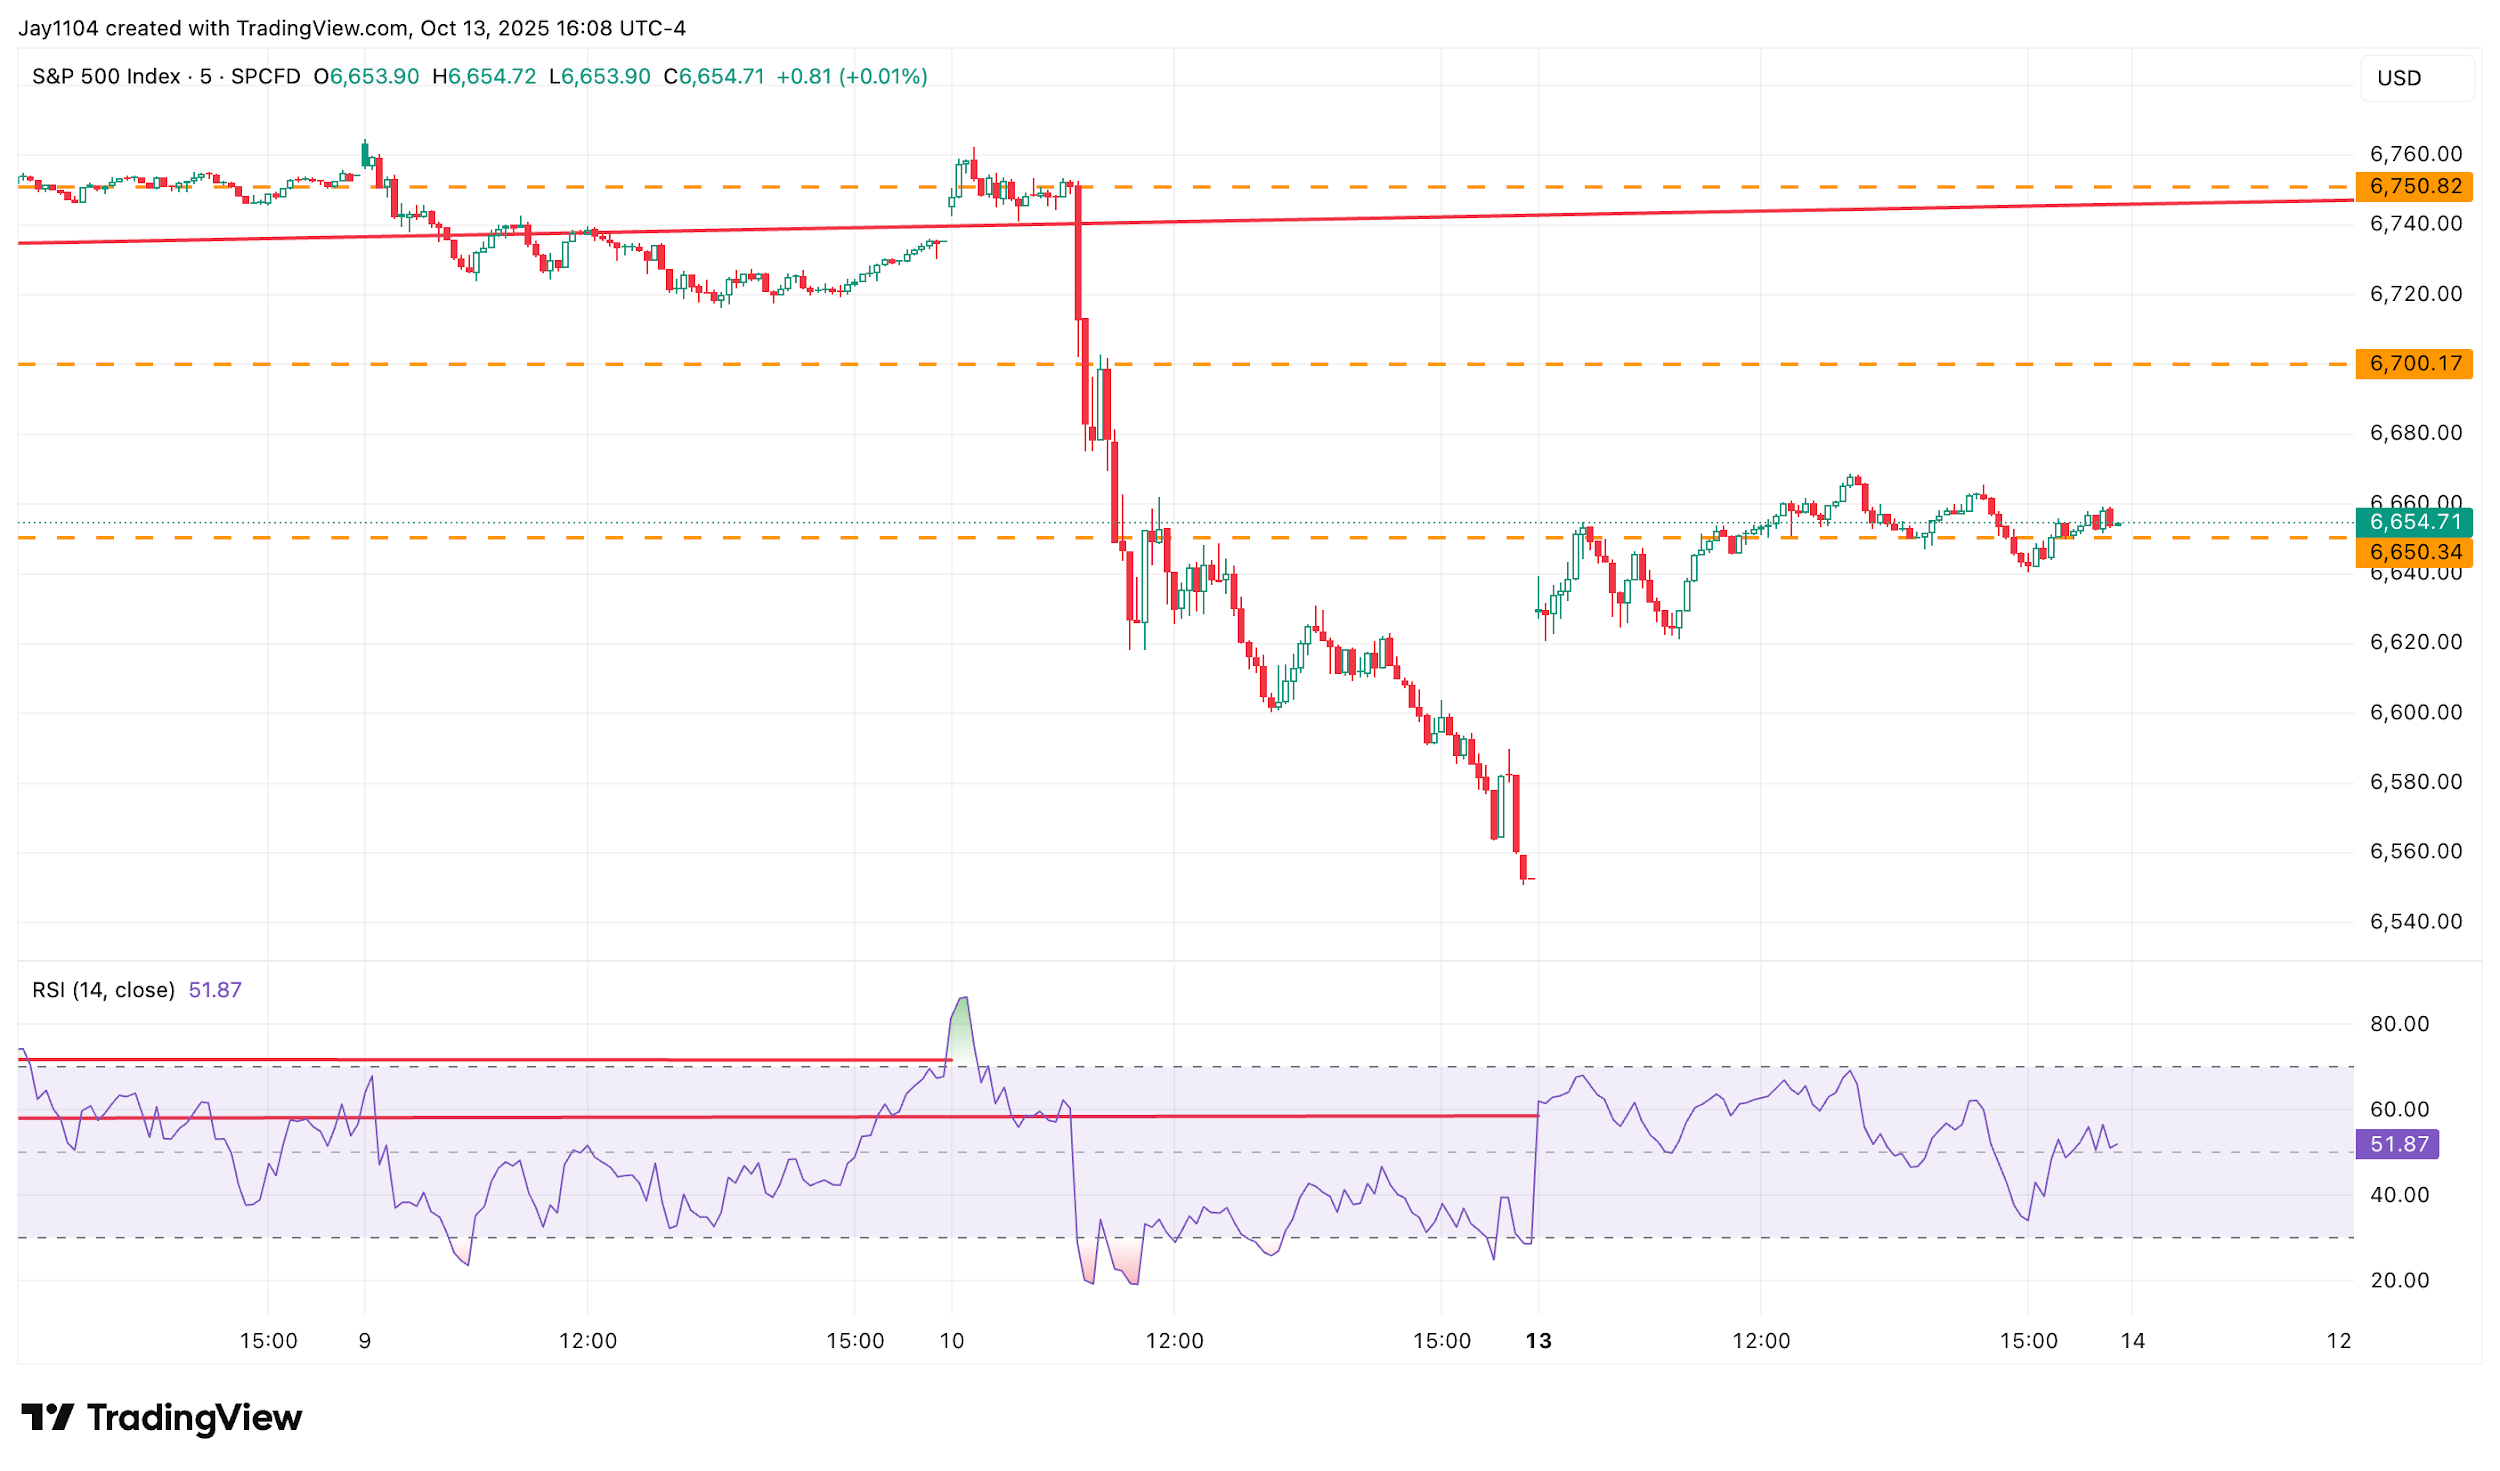
(Source: TradingView)
Past performance is not a reliable indicator of future results.
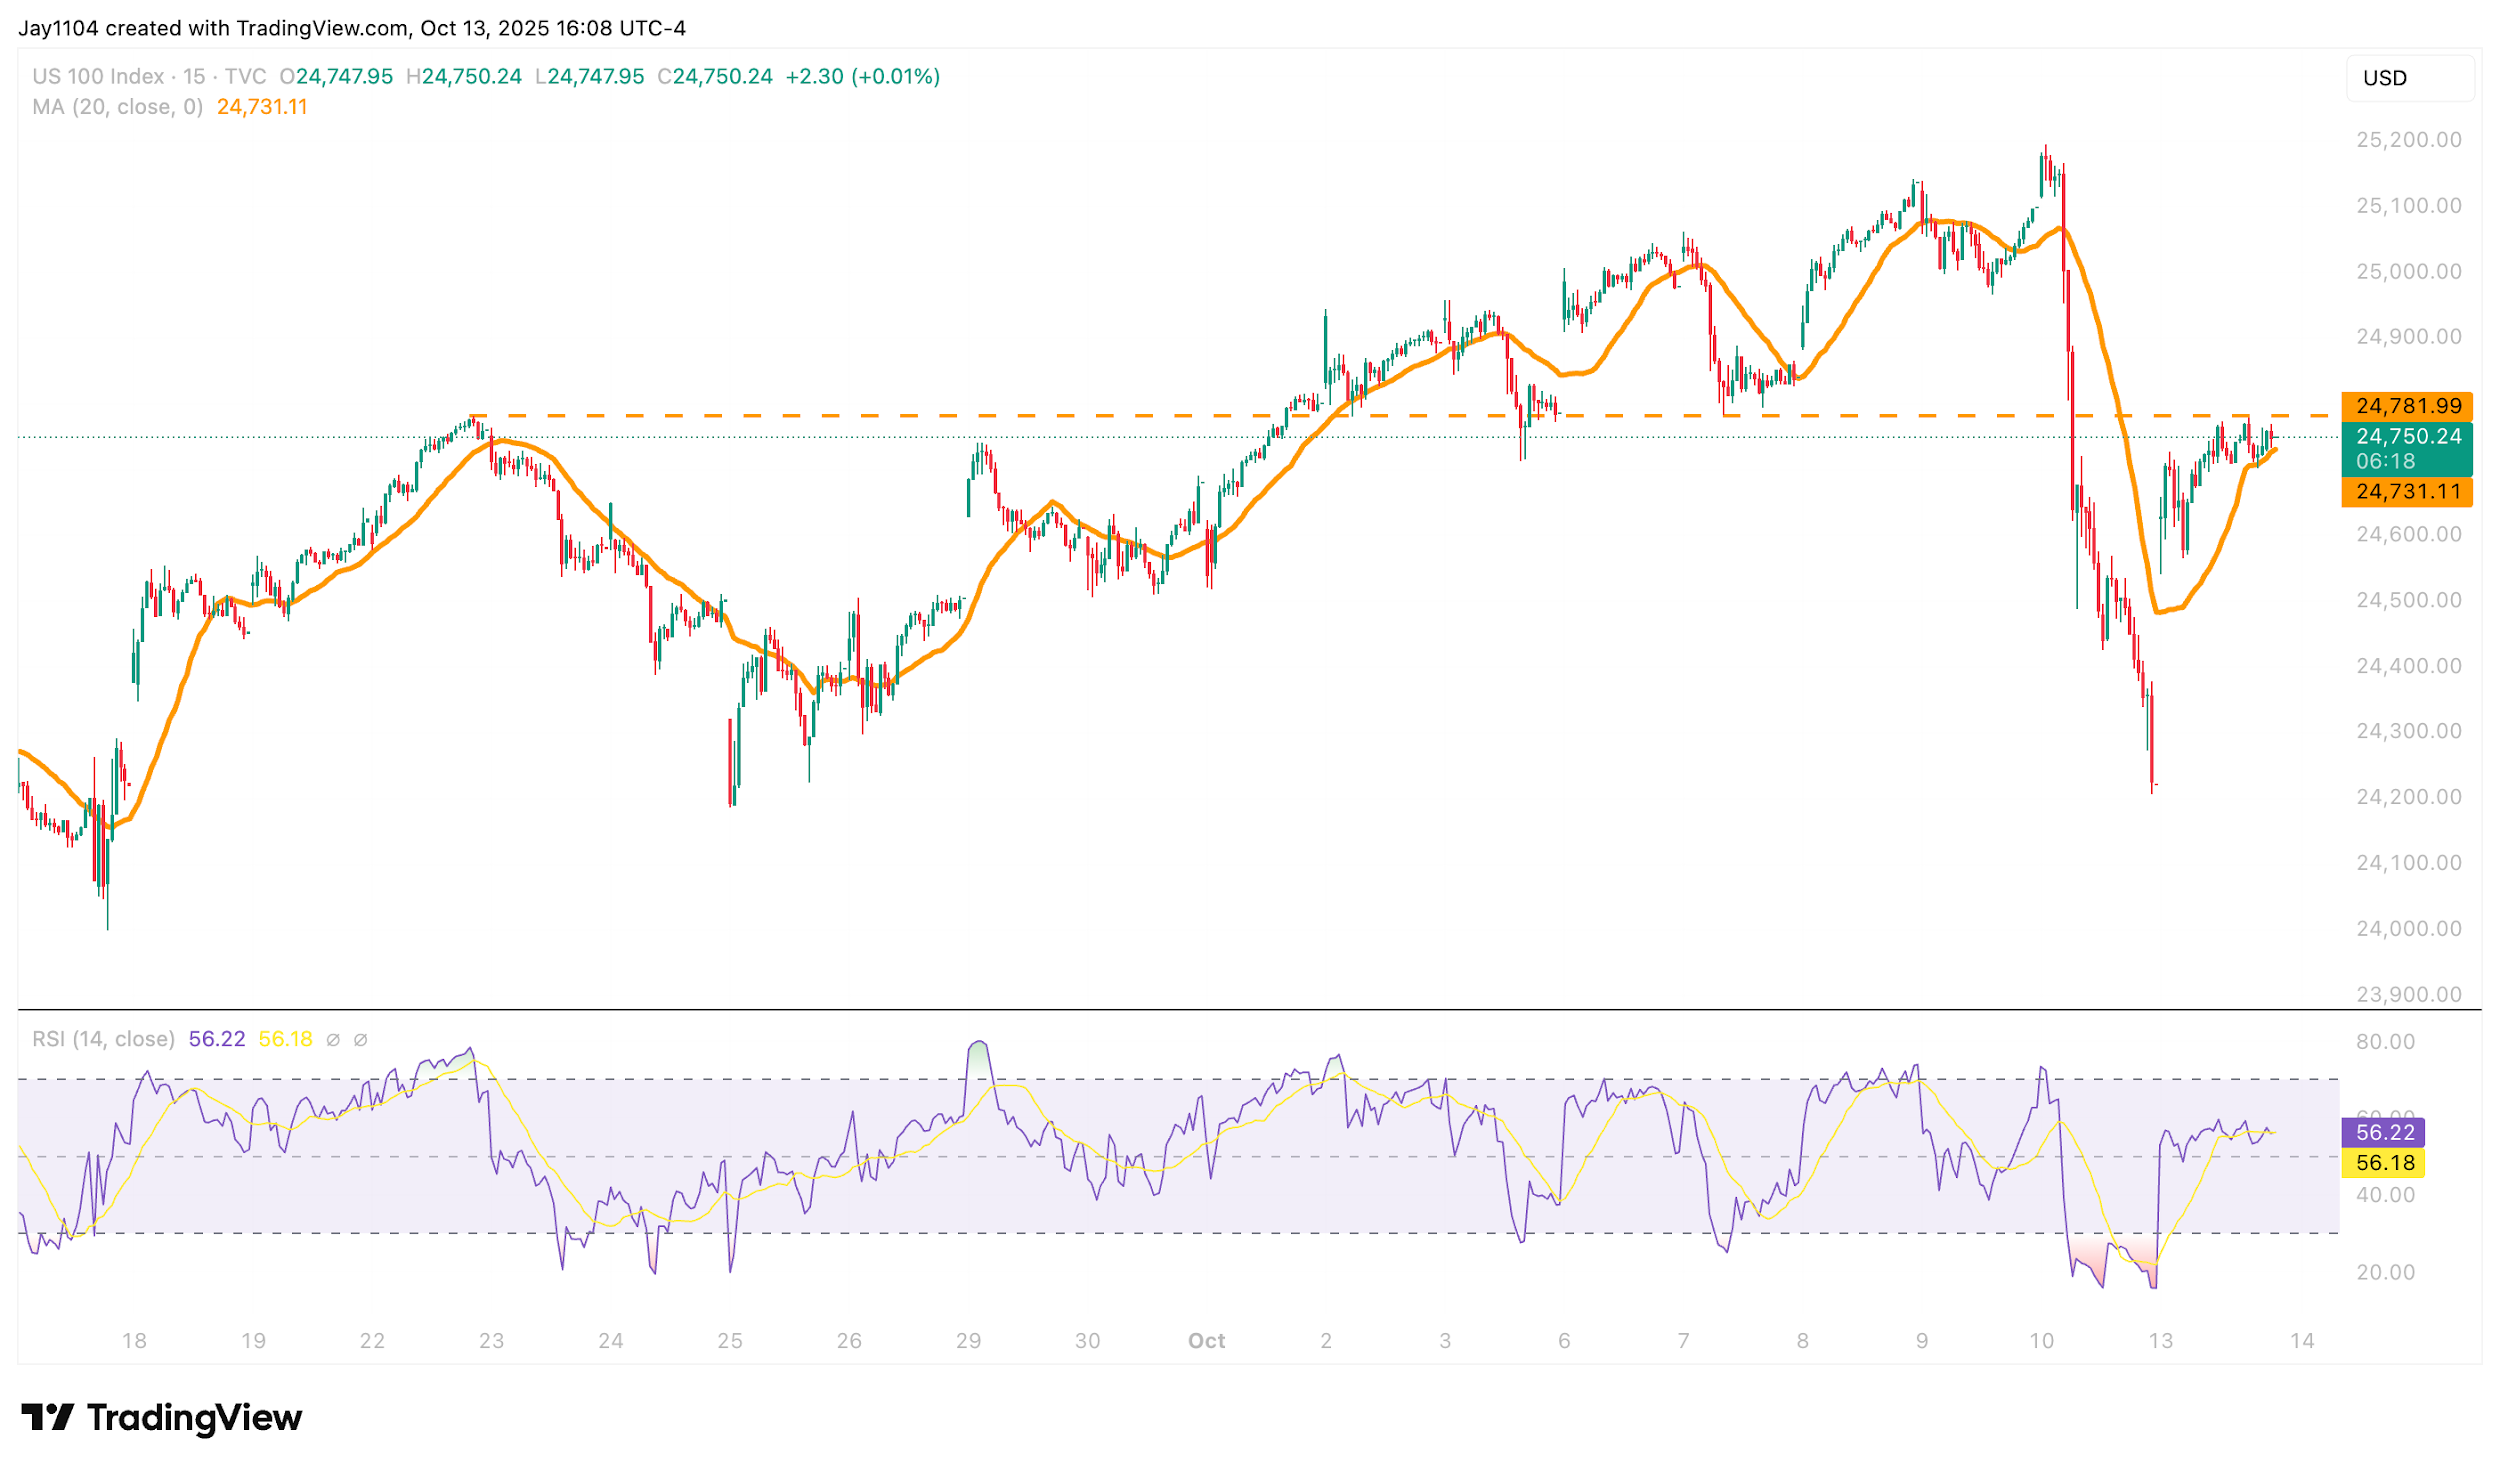
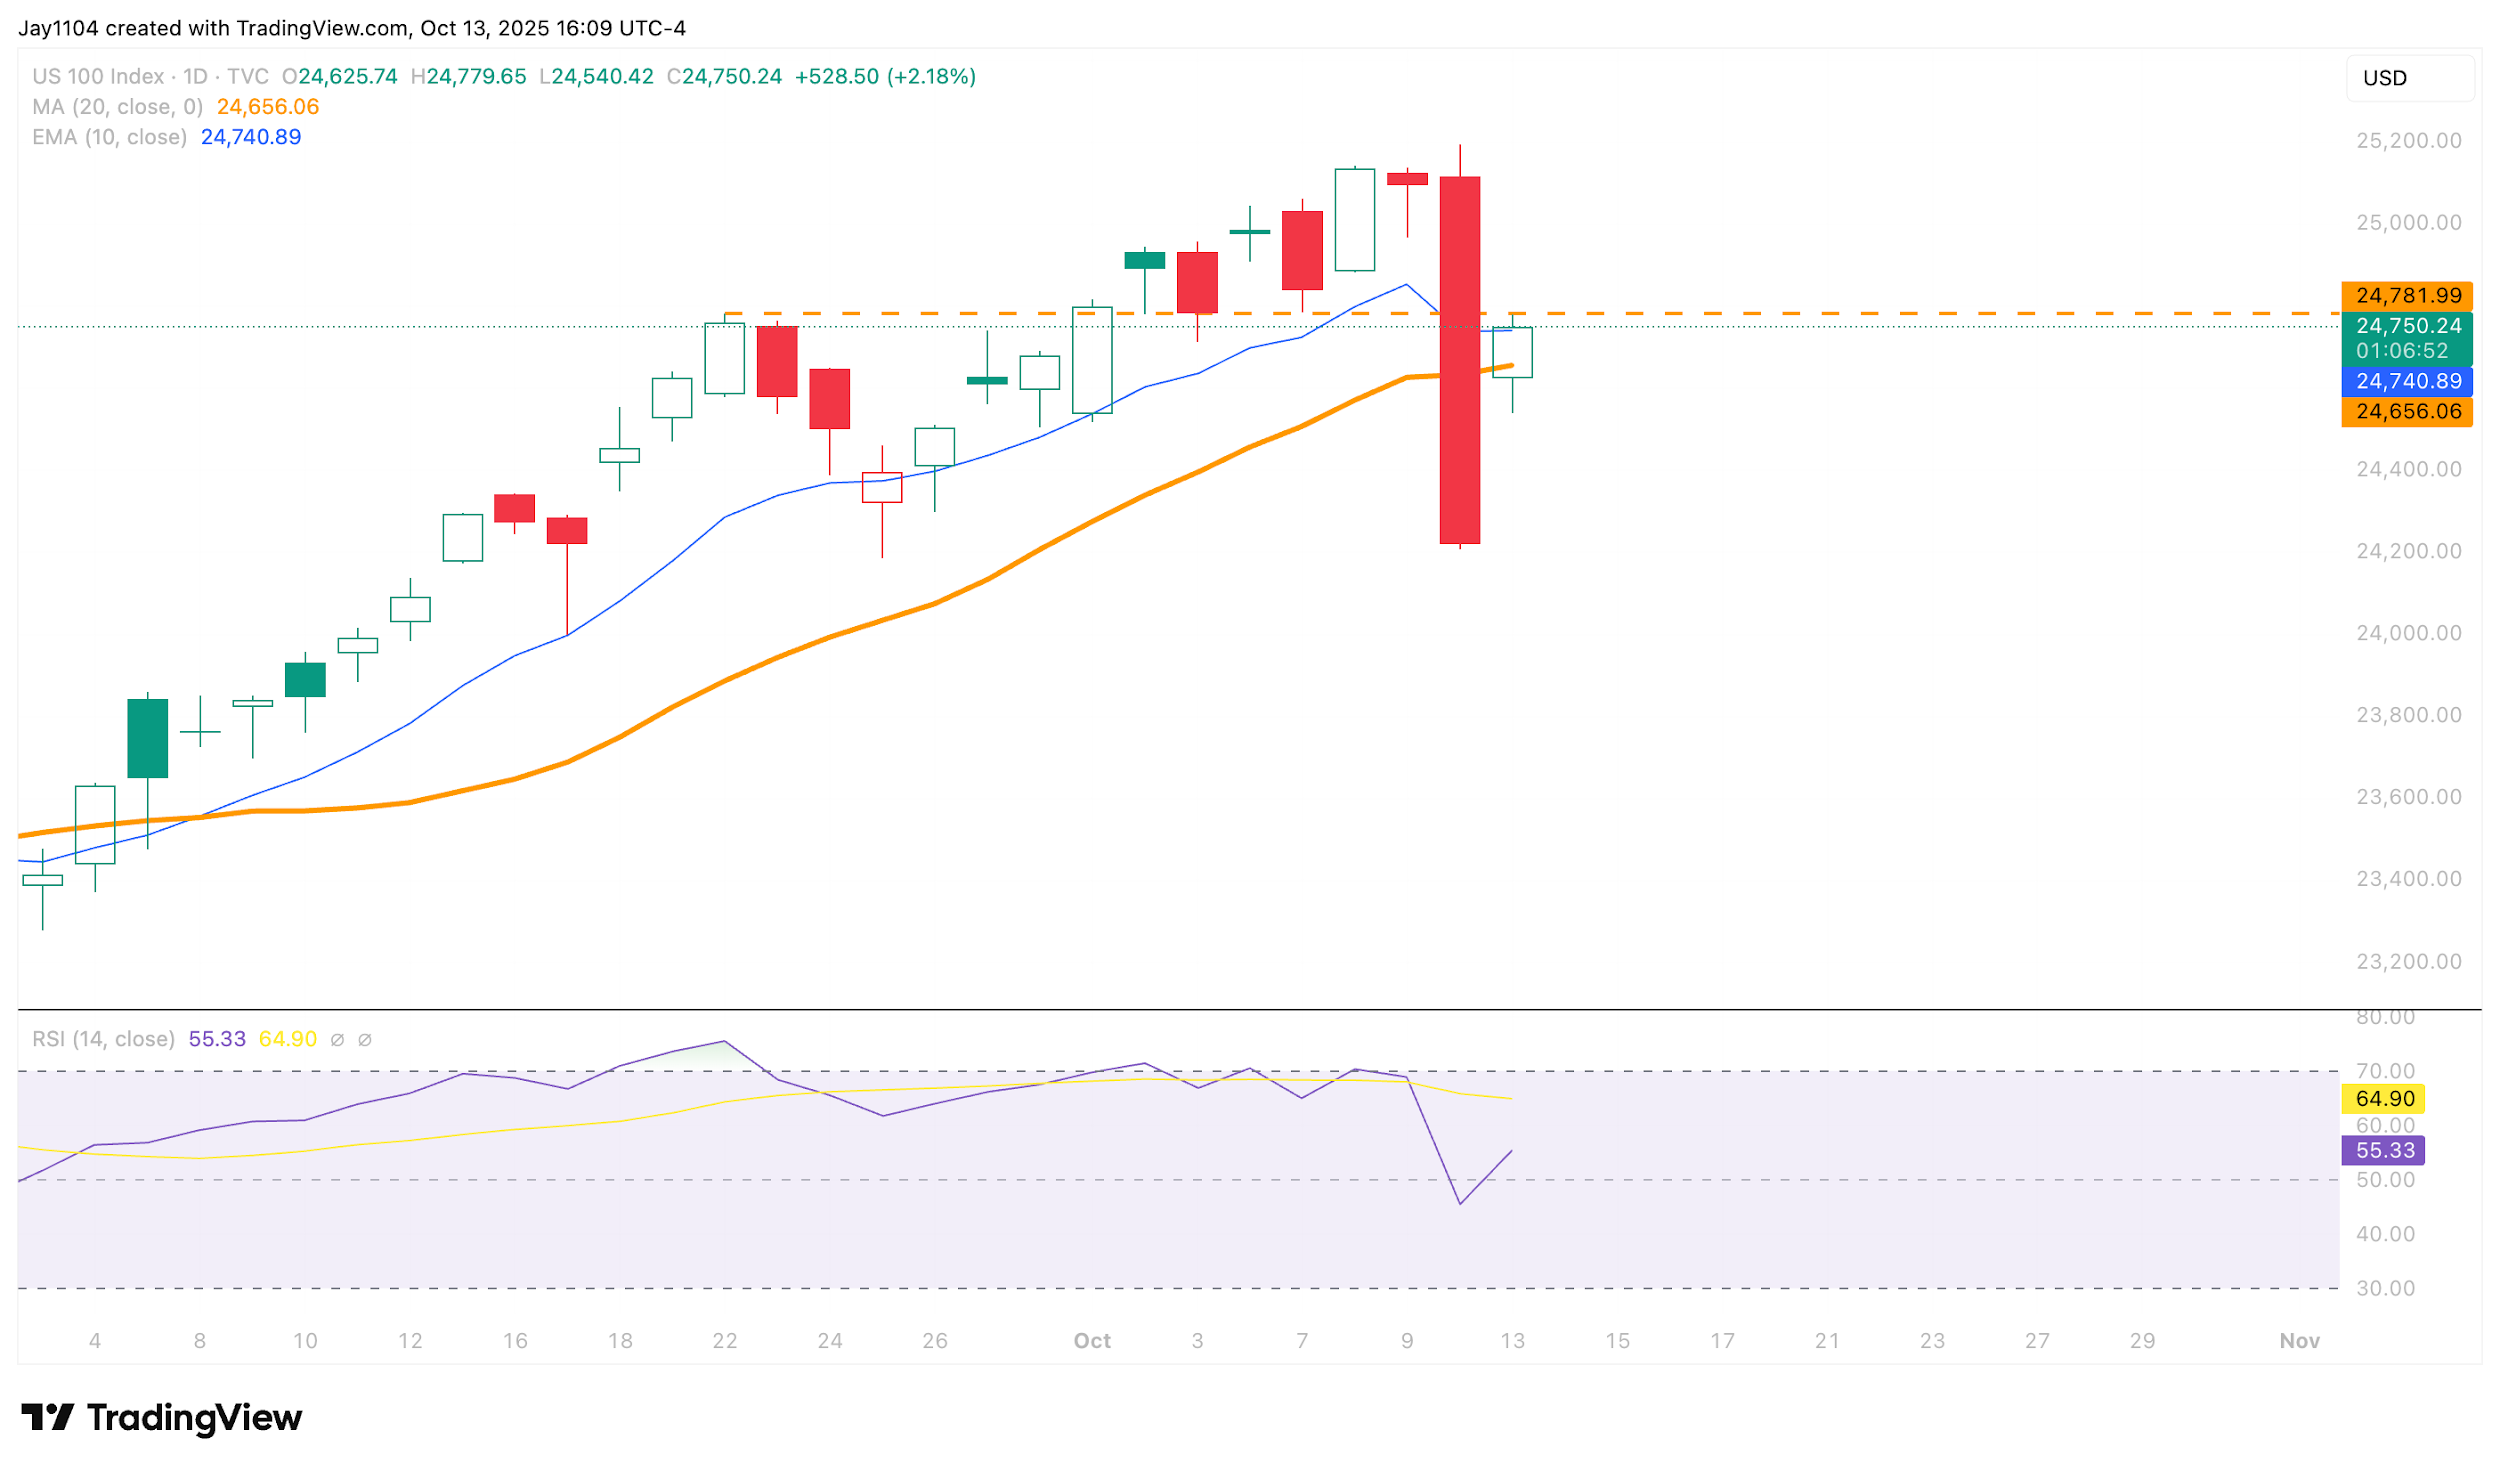
Not surprisingly, the NASDAQ 100 also performed very strongly, rising by around 2.2%. What’s noteworthy, however, is that the index stalled precisely at 24,780 — a level that marked the top on 25 September, acted as support around 3 and 7 October, and now appears to be serving as resistance.
(Source: TradingView) (Past performance is not a reliable indicator of future results)
(Source: TradingView)
Past performance is not a reliable indicator of future results.
Adding to that resistance is the 10-day exponential moving average, which the NASDAQ 100 briefly traded above before falling back below by the end of the session. This suggests that there is strong resistance around the 24,780 area.
 (Source: TradingView)
Past performance is not a reliable indicator of future results.
If the index were to gap higher during Tuesday’s trading session, it could potentially set up a rebound back towards the previous highs, around 25,100. However, if the index remains below that resistance level, the NASDAQ 100 shows a similar setup to the S&P 500 — a sharp, straight-line drop into Friday’s close followed by a gap higher on Monday. Such patterns are typically unstable and often result in a full retracement back to the origin, which in this case would take the index down towards 24,200.
Euro Weakens Vs. U.S. Dollar
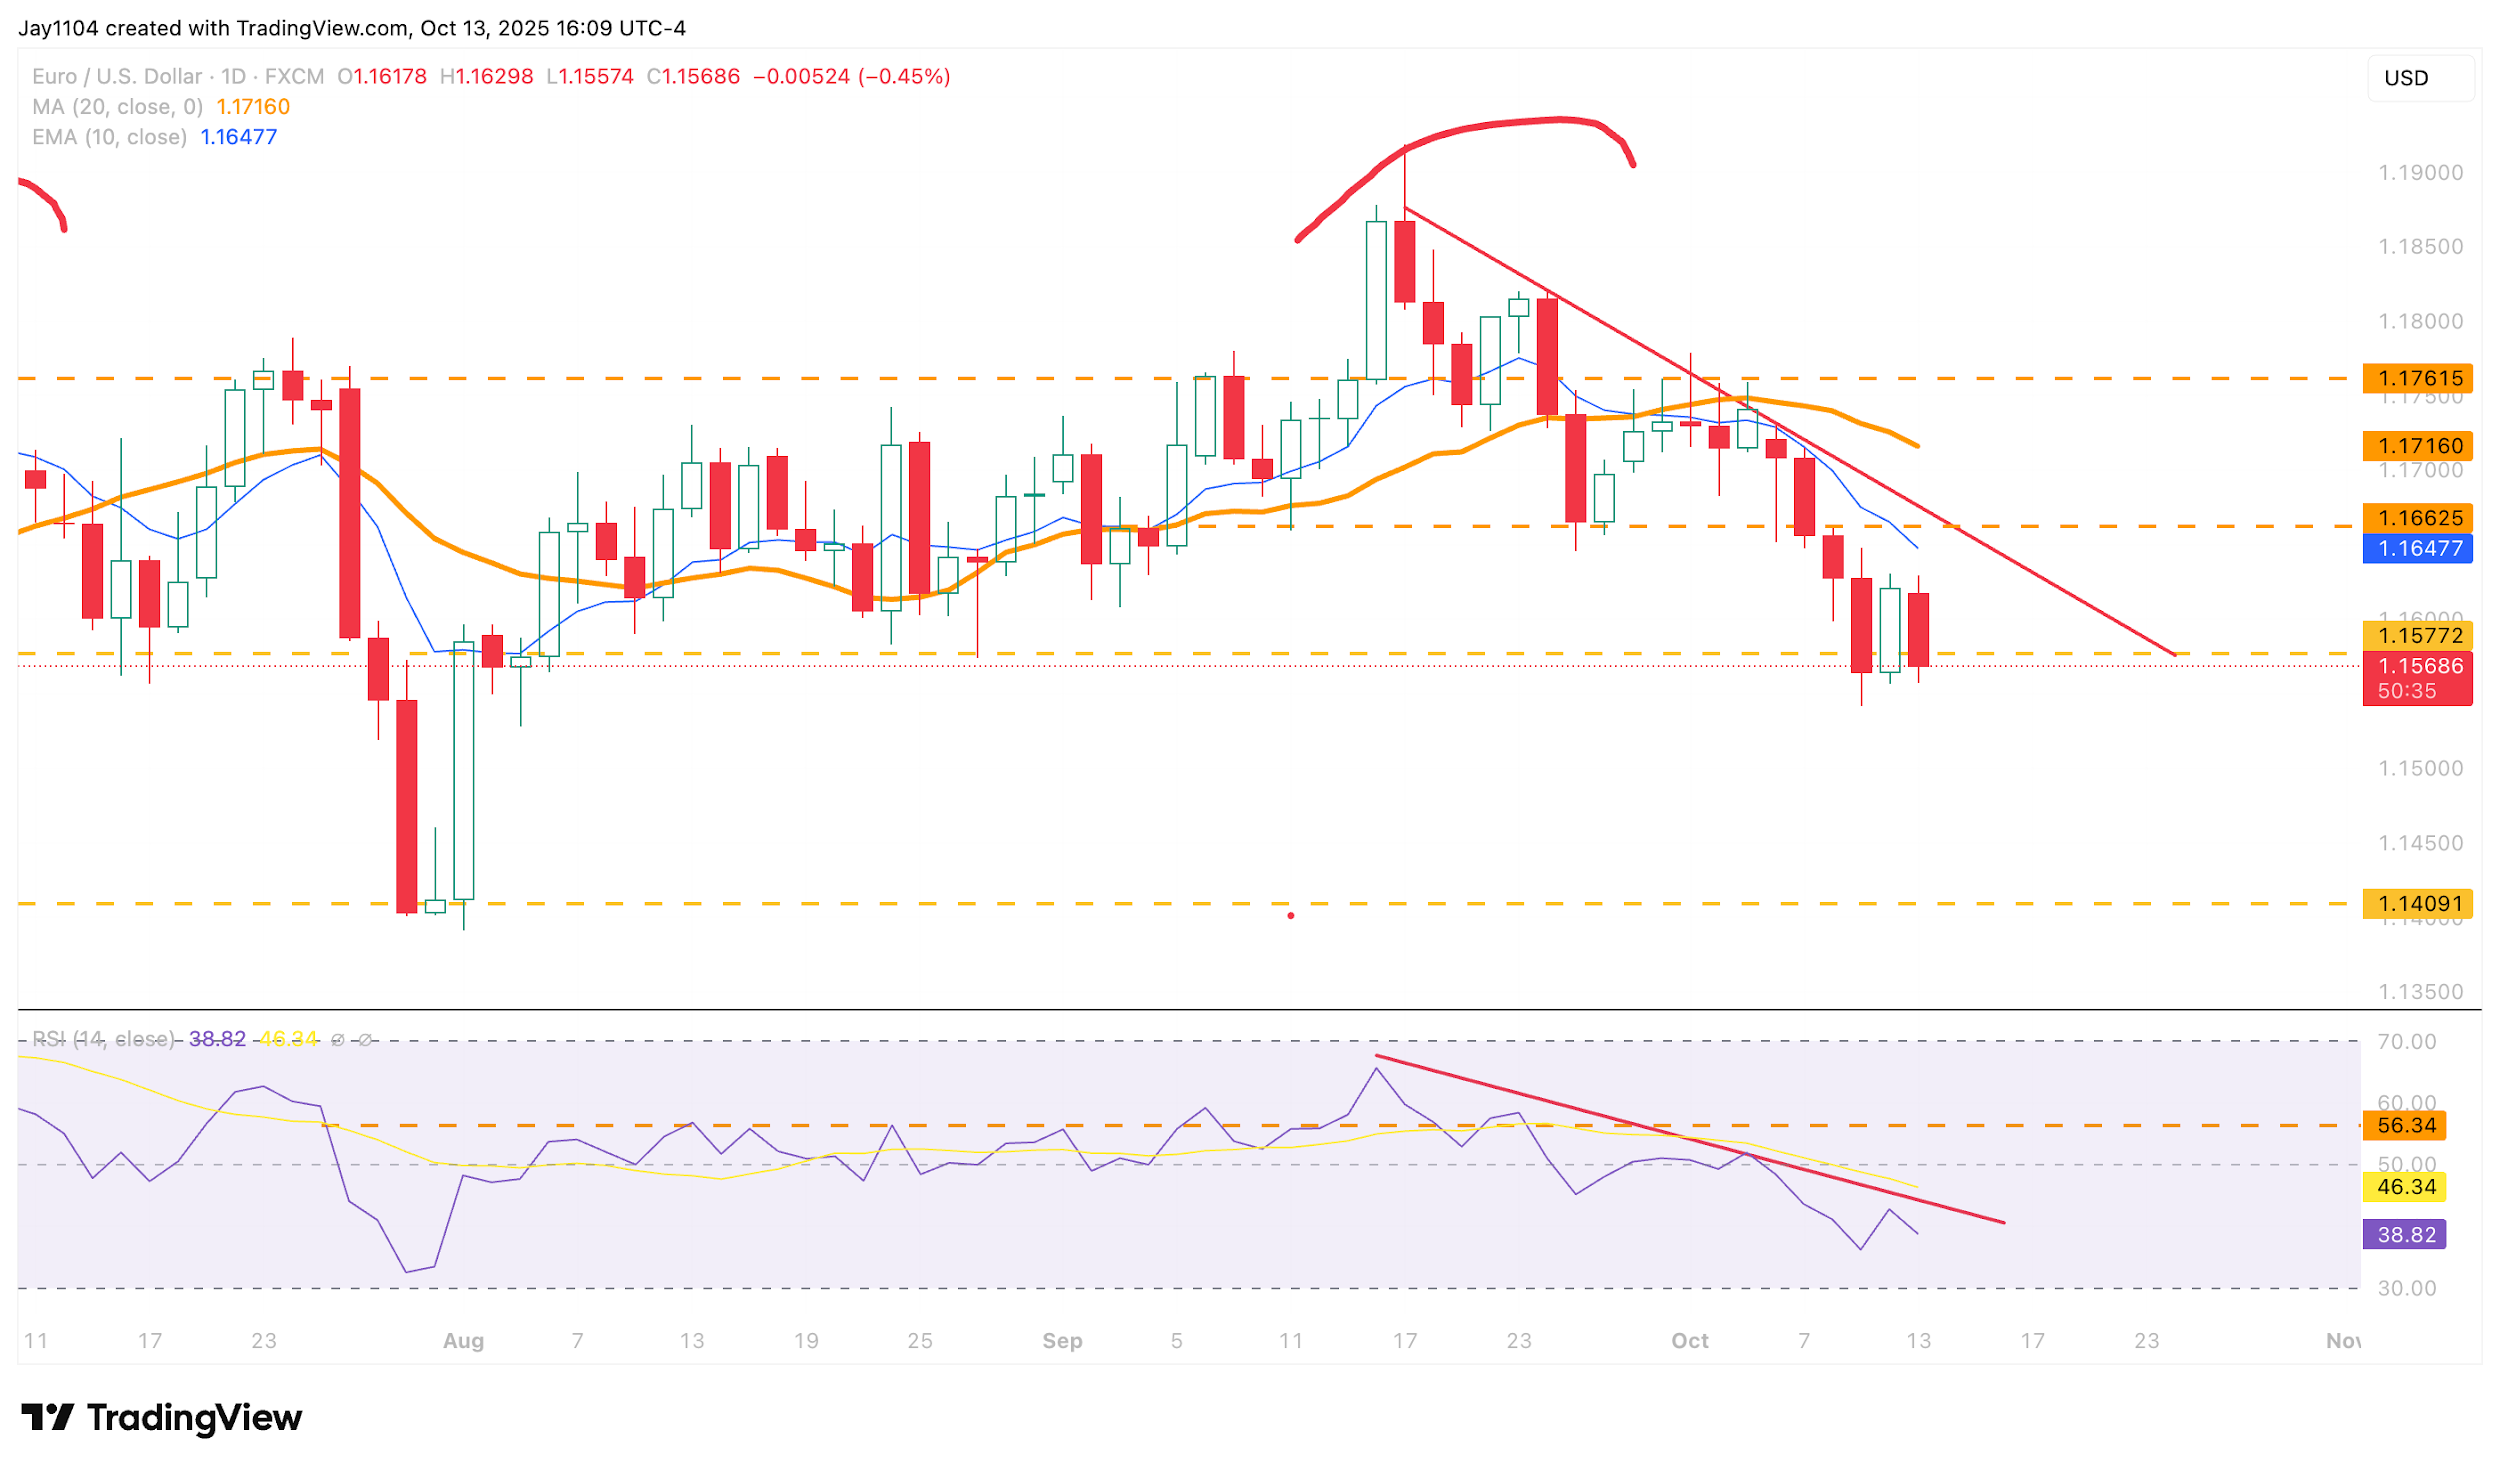
After strengthening on Friday, 9 October, the euro weakened against the dollar today by around 43 basis points, bringing it back to support near 1.1571. This places the euro in a position where it could break below that support level and decline towards 1.14.
A potential descending triangle pattern also appears to be forming, with both the 10-day and 20-day moving averages rolling over and now acting as resistance. Additionally, momentum indicators such as the RSI suggest that the euro has further to fall, reinforcing the view that momentum has shifted and that the euro is now in a bearish downtrend.
(Source: TradingView)
Past performance is not a reliable indicator of future results.
Gold Soars, Again…
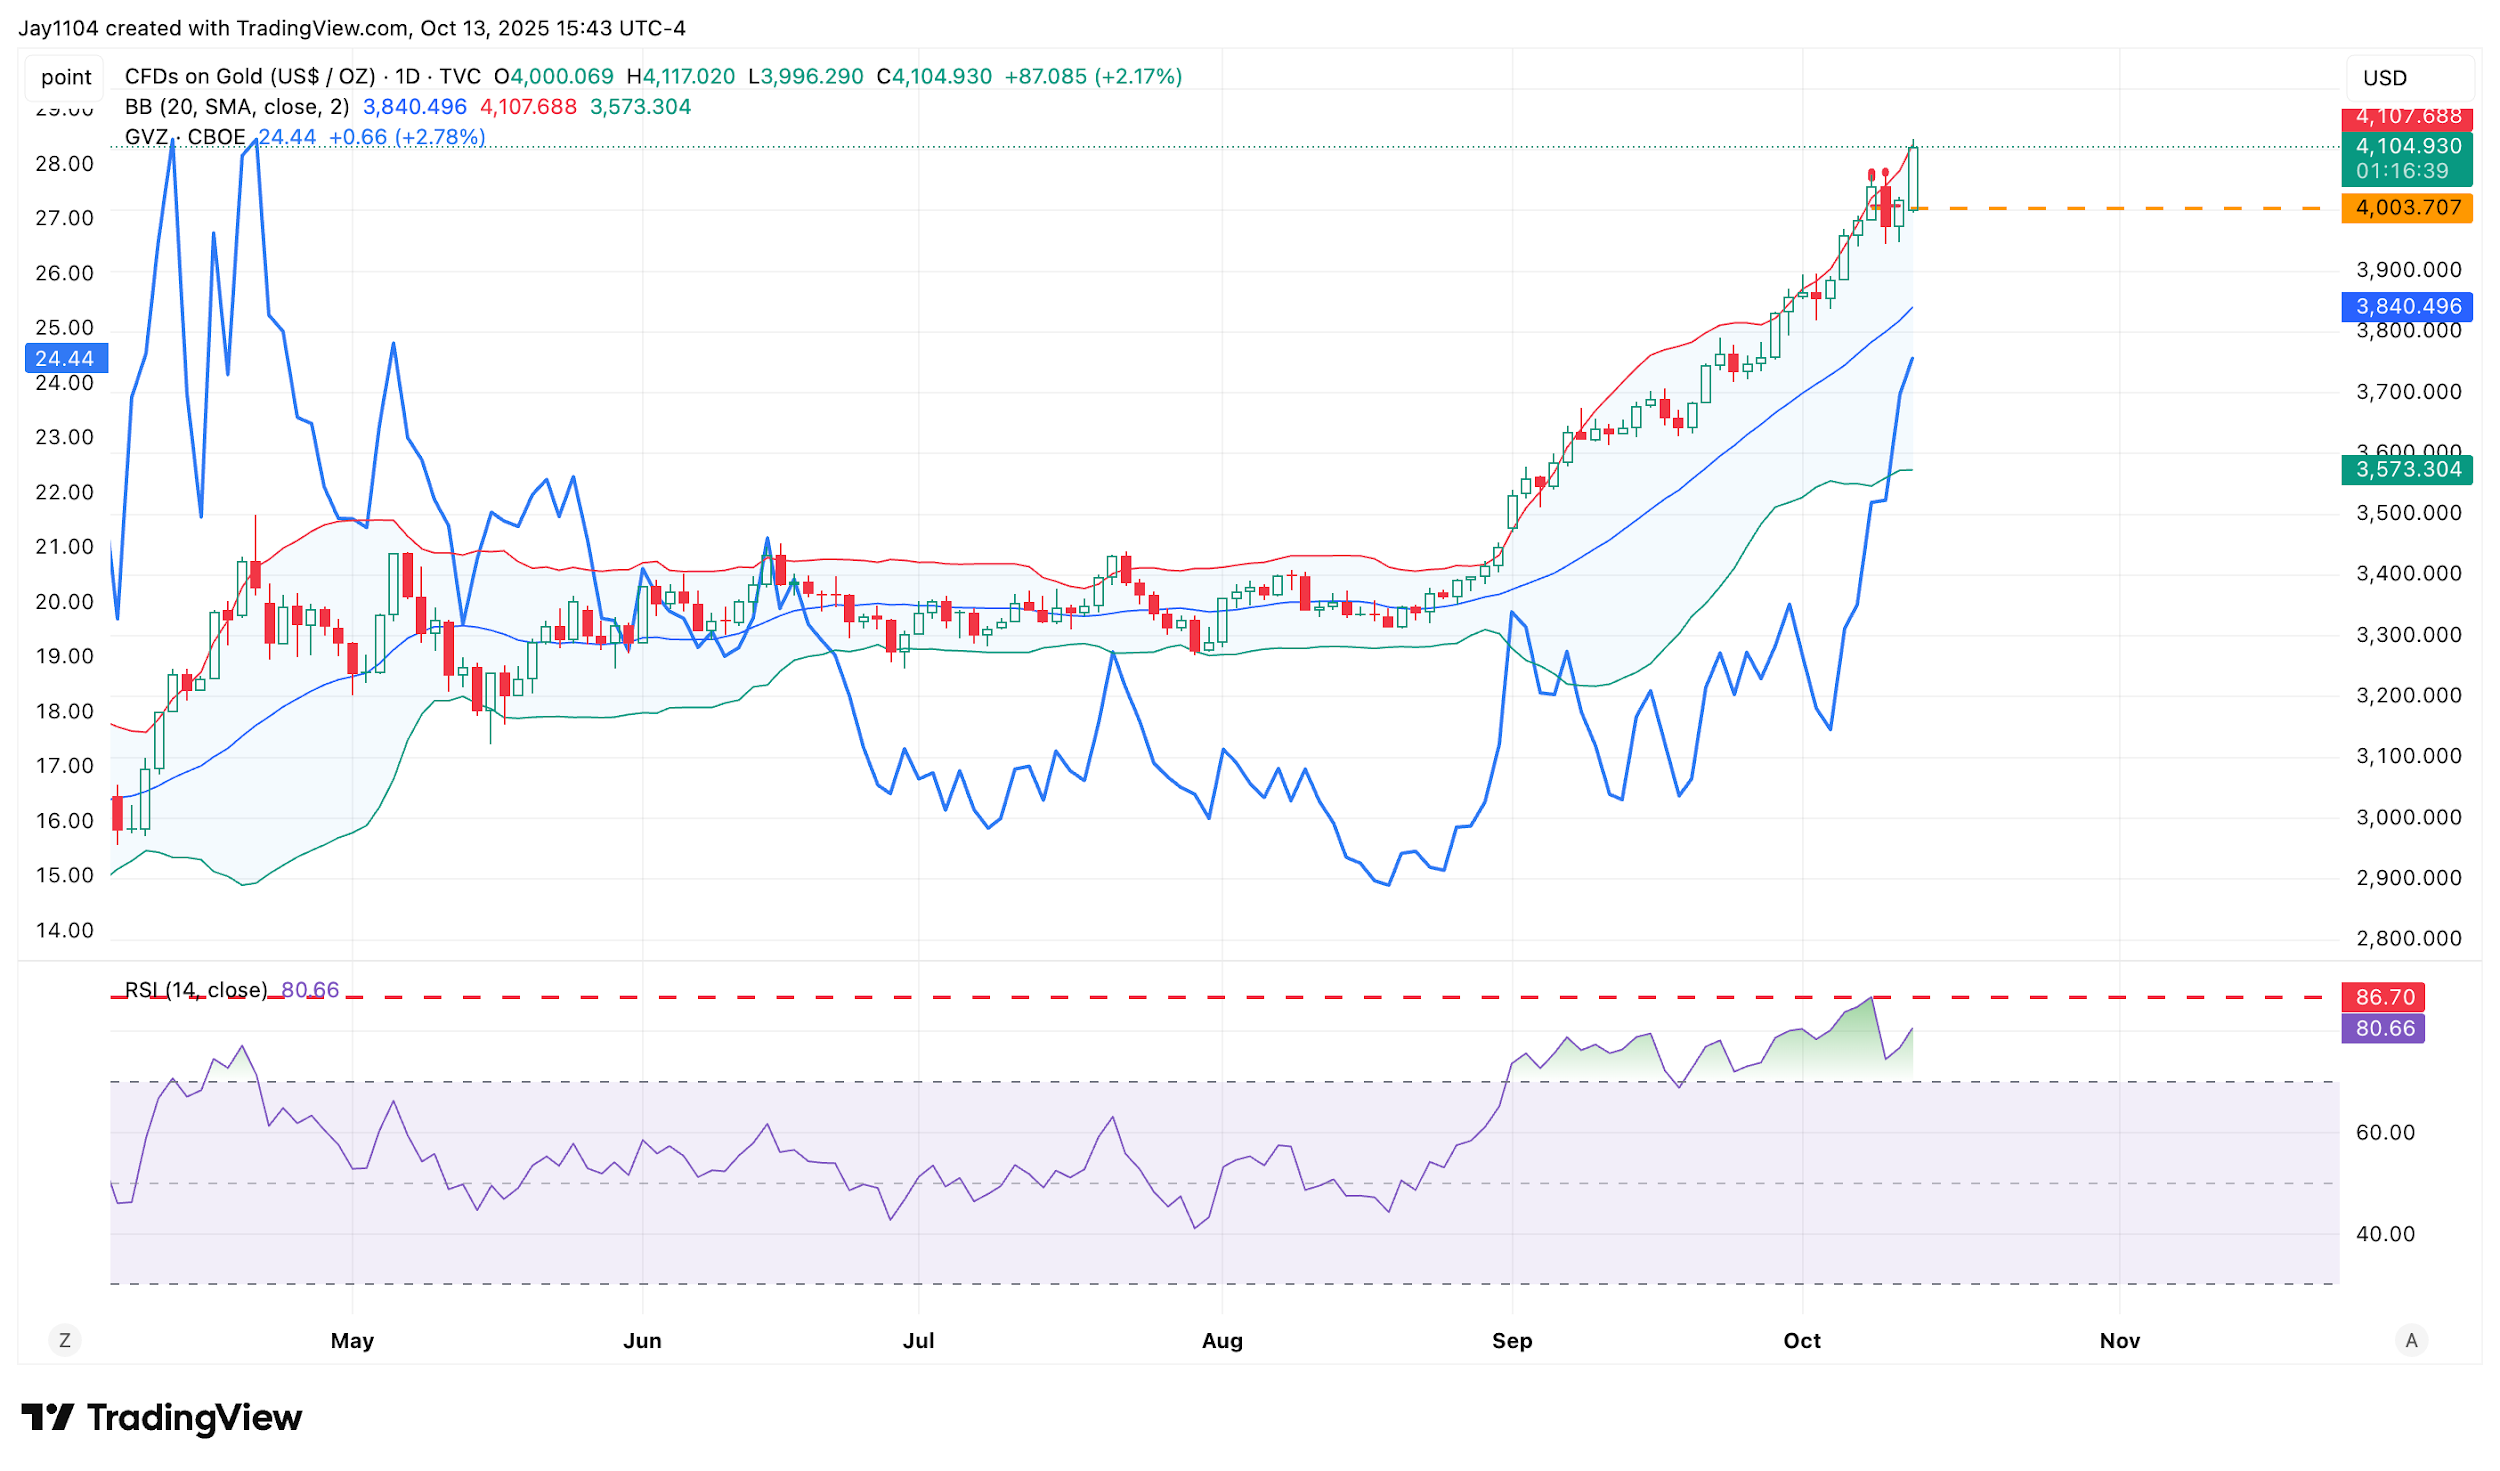
Gold continues to climb higher and is now in an overbought position, with the price trading above the upper Bollinger Band and the RSI once again above 80. Additionally, the GVZ, the gold volatility index, has also risen sharply.
Gold’s simultaneous rise in both price and implied volatility is an interesting dynamic, often characteristic of a speculative type of move. This suggests that while gold has continued to advance, it remains in an overbought and highly speculative phase. Consequently, a period of consolidation or a pullback in the near term would not be unexpected.
(Source: TradingView)
Past performance is not a reliable indicator of future results.