SPX Looking for Direction Inside Recent Friday Range Amid Headline Risks
The SPX continues to face resistance above the 6700 level, with buyers repeatedly attempting to support the market but failing to generate sustained momentum beyond that mark.
The SPX continues to face resistance above the 6700 level, with buyers repeatedly attempting to support the market but failing to generate sustained momentum beyond that mark. The ongoing presence of headline risks—including renewed China tariffs and a prolonged government shutdown—has kept participants cautious. Despite the uncertain macro backdrop, the technical picture remains the primary guide for short-term price action.
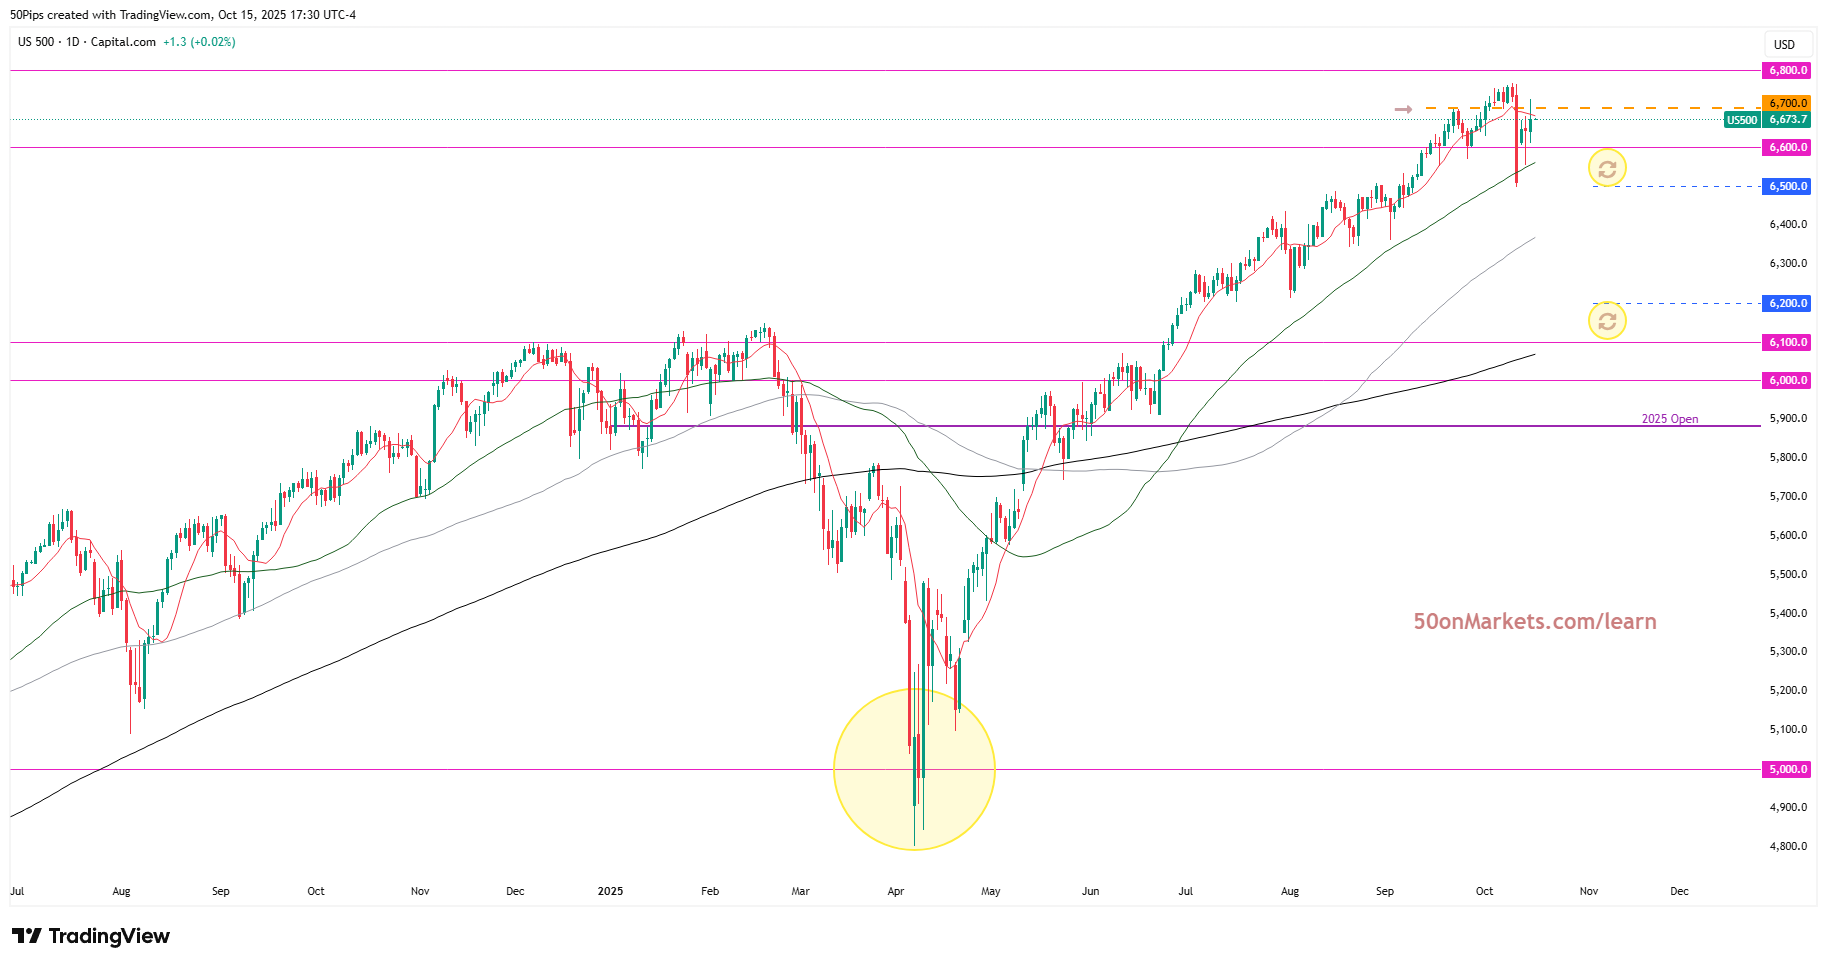
(Source: TradingView)
(Past performance is not a reliable indicator of future results)
Upside rotations have repeatedly stalled near 6700, suggesting a potential topping formation and confirming the market’s struggle to decisively clear the critical 6800 psychological barrier. Liquidity remains thin, and upward progress has been slow, indicating the possibility of heightened volatility. Historically, single‑day drops of 3–5% are not unusual in this type of environment, while the consistent buying of minor dips reflects an unusually high degree of risk appetite.
Retail investors remain heavily leveraged long, with consensus expectations pointing toward a year‑end close above 7000. Yet that kind of one‑sided sentiment often precedes corrective phases, emphasizing the need for tactical discipline.
Technical levels remain well-defined. The 50‑day moving average provides support, while the 6700–6800 zone caps resistance. A sustained close above 6800 could signal further upside toward the next technical zones around 7400–7700, although there is no certainty these levels will be reached.. Conversely, a close below the 50-day moving average may indicate further downside pressure
A retracement to 6100 could represent a typical technical correction of around 10%. Some market participants might see this as a healthy retracement, but outcomes depend on broader market conditions. If prices remain below 6100 for an extended period, this may indicate weaker technical momentum toward the lower support area near 5000.
On the other hand, a move above 6800 could prompt some institutional investors to increase exposure, potentially adding short-term upward momentum.
Key Takeaways
- Monitor price action around the 10‑day moving average; daily closes remain pivotal within the 6800–6500 range.
- A close above 6800 could indicate potential upside momentum and may prompt short-term momentum-driven buying.
- A close below 6500 may suggest a shift toward the 200-day moving average area, although outcomes remain uncertain.
- Stay alert to headline risk and expect elevated volatility as the market continues to seek direction.