Trading the S&P 500 After the US Government Shutdown
It’s breached 6,700 shrugging off the shutdown and keeping the technicals bullish, and in sentiment clients remain majority long.
US equity index futures are up slightly after a session of gains and fresh record highs for the S&P 500 (+0.3% to close above 6,700) and Nasdaq 100 (+0.5% to 24,800) unfazed by the government shutdown and buoyed by increased rate cut likelihoods as data disappointed. ADP’s (Automatic Data Processing) non-farm estimate for September suffered a surprise loss of 32K compared to expectations of 50K growth with its August reading revised to -3K from a previously reported +54K. And with the absence of the encompassing and market-moving Non-Farm Payrolls tomorrow due to the government shutdown, means ADP’s print is what market participants will have to rely on for now.
Other data included ISM’s (Institute for Supply Management) manufacturing PMI (Purchasing Managers’ Index) for the same month improving but still in contracting territory with a 49.1 print. Its pricing component dropped to 61.9, new orders fell from 51.4 to 48.9, and the employment aspect improved to 45.3. There was also housing data with the weekly mortgage applications (MBA) showing a 12.7% drop.
Treasury yields fell back notably for the session, and market pricing (CME’s FedWatch) now sees a 25bp (basis point) rate cut out of the Federal Reserve (Fed) later this month, not far off fully pricing in another reduction in December, and with a significant minority on a third one in January.
Speaking of the Fed, there was FOMC (Federal Open Market Committee) member Goolsbee who spoke on the problematic situation central bankers face due to lack of data from the government shutdown and is getting more concerned about inflation going the wrong way. Elsewhere, the Supreme Court allowed Cook to remain in her role until oral arguments in January with the result seen as a stabilizing factor for now in terms of central bank independence.
Among the S&P 500’s components semiconductors generally had a positive session with shares of Nvidia edging higher, reaching $187 by the close but better percentage gains within the sector for Micron (+8.9%) and Intel (+7.1%) with the latter impacted by a report that it’s in early talks with AMD (1.4%) to manufacture chips. It was the health sector though that clearly outperformed with big gains for drug manufacturers including Eli Lilly (+8.2%), AstraZeneca (+10.2%), and Merck (7.4%) as investors remain optimistic about further deals with the White House following Pfizer’s (6.8%) agreement and a report regarding delaying tariffs on the sector to negotiate drug prices.
As for today, the attention will remain on the government shutdown where VP Vance said he doesn’t think it’ll last that long. The weekly claims will likely be delayed so those looking for labor data have got Challenger’s job cuts, and for information on the important services sector there’s ISM’s services print tomorrow. At least a couple of FOMC members are expected to speak today and tomorrow.
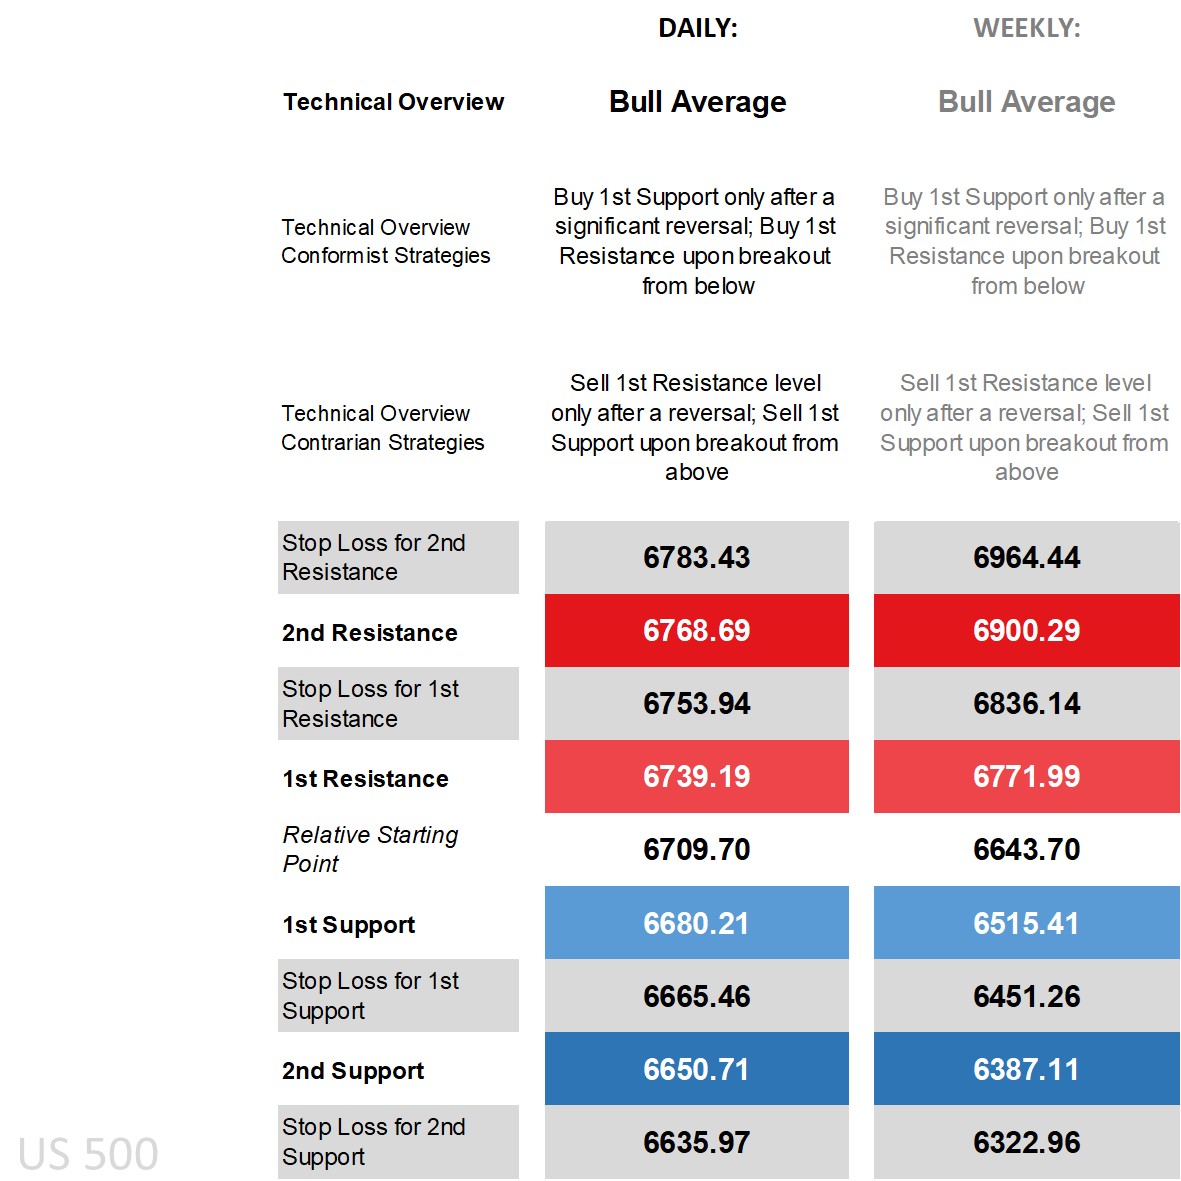
S&P 500’s technical overview, strategies and levels
Looking at the daily time frame and price is above all its main moving averages (MA) and at the upper end of the Bollinger Band, on the DMI (Directional Movement Index) front the +DI over the -DI by a large enough margin by one calculation to label it as positive, an RSI (Relative Strength Index) just shy of overbought territory, and an ADX (Average Directional Movement Index) yet to reach trending territory. That translates into a bullish technical overview, with ‘bull average’ seen below for both daily and weekly time frames.
On the strategic front, those that see the technical overview persisting and investors remaining optimistic regardless of the uncertainty fall into the conformist camp where buy strategies be it via breakout off the 1st Resistance or working off the 1st Support but only after a significant reversal should the market experience a pullback waiting for the market to recover back to the key level first. Those that expect the upper end of the band to hold and/or experience limited upside gains have got contrarian strategies be it selling via reversal off the 1st Resistance or via breakout off the 1st Support.
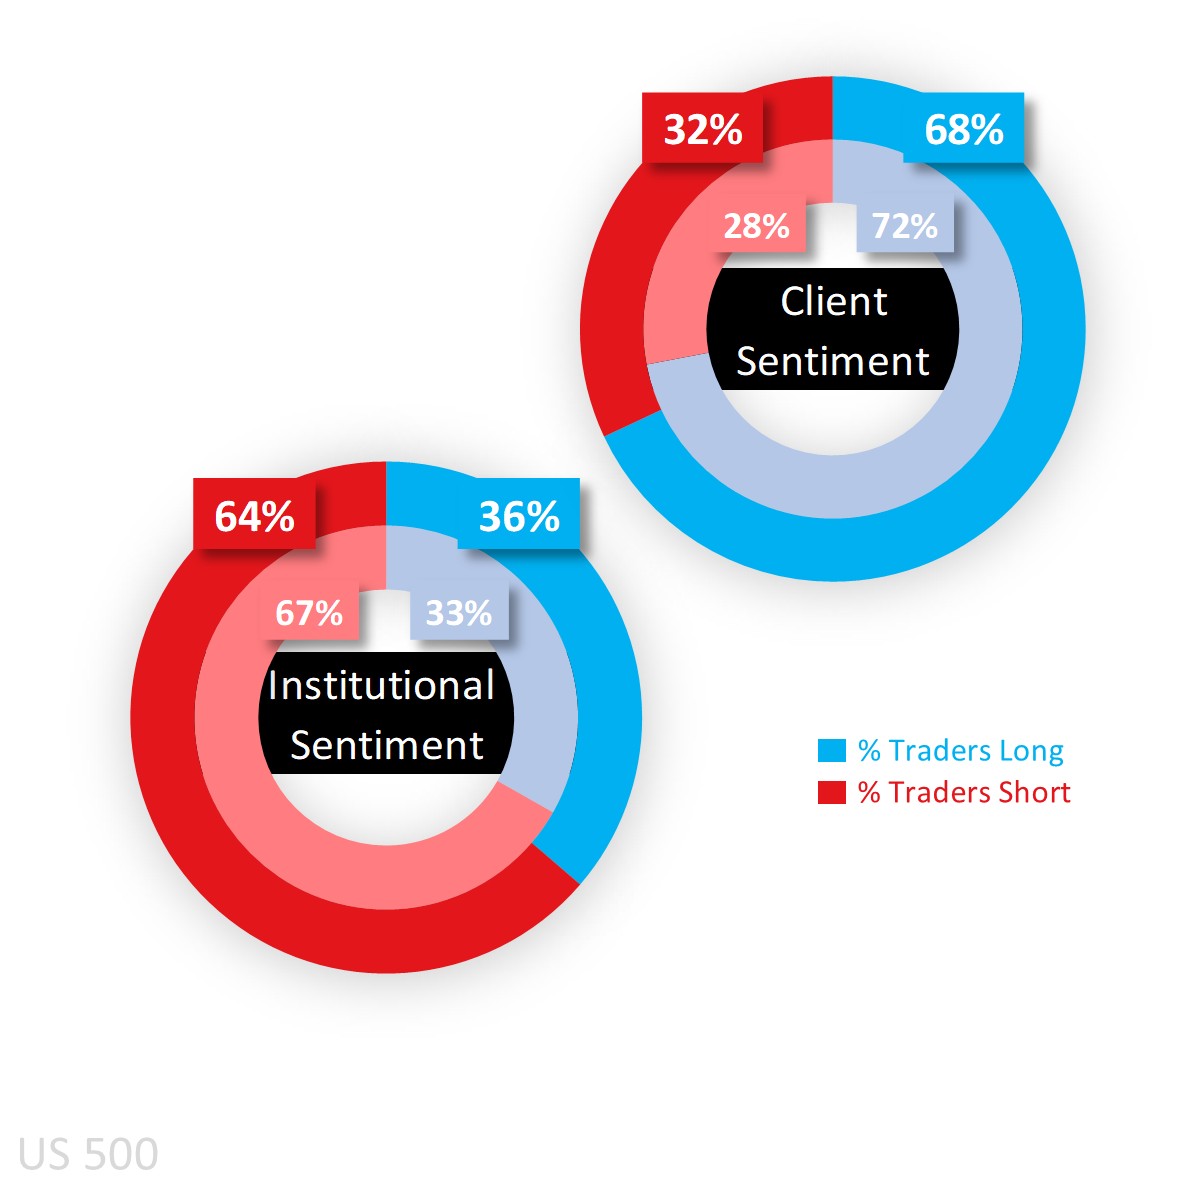
Capital.com’s client sentiment for the S&P 500
Client sentiment remains majority buy and in heavy long territory even after the latest price gains, dropping from 72% yesterday to 68% of traders with buy positions as of this morning. Looking at the bias mapped on the chart below (in the yellow-dotted line), and it has been a consistent story of majority long sentiment for months unlike in the Dow (US Wall Street on Capital.com’s trading platform) and Nasdaq (US Tech 100) where they at times have ventured into majority sell territory.
As for CoT (Commitment of Traders) speculators, they remain net short but are no longer in heavy sell territory dropping from 67% to 64% last week due to an increase in longs (by 8,211) and a simultaneous reduction in shorts (by 41,896). Looking at other key US equity indices and CoT speculators are net short Russell (71%), shifted to the middle in the Dow (from a previous heavy sell 71%), and raised their net long bias in the Nasdaq (to 58%).
Client sentiment mapped on the daily chart
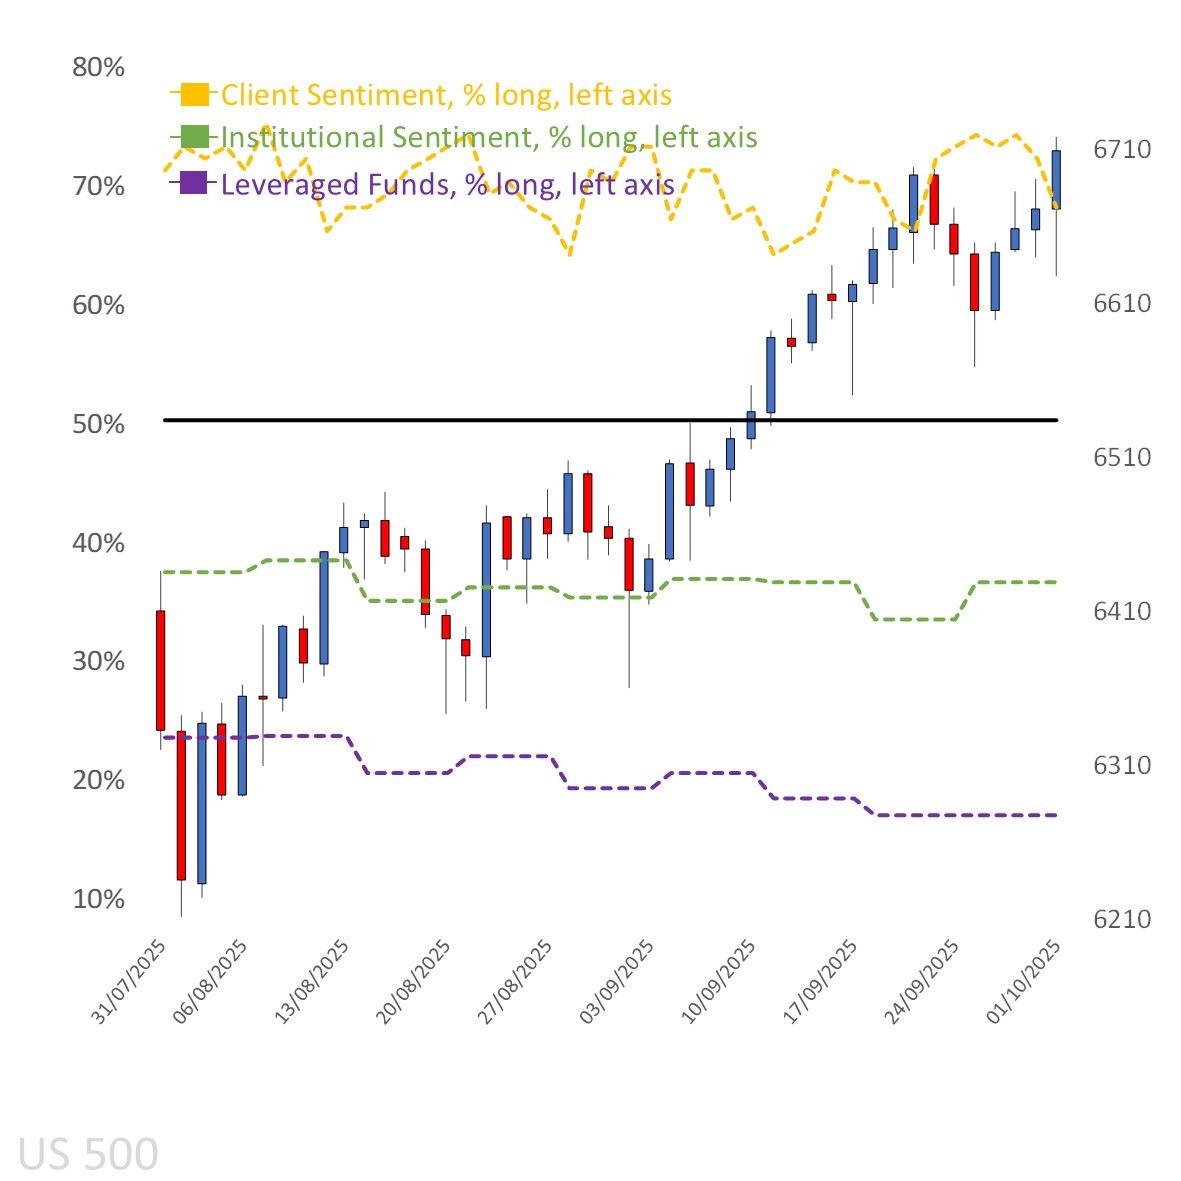
Source: Capital.com
Period: JULY 2025 – OCTOBER 2025
Past performance is not an indicator of future results.
S&P 500’s chart on Capital.com’s platform with key technical indicators
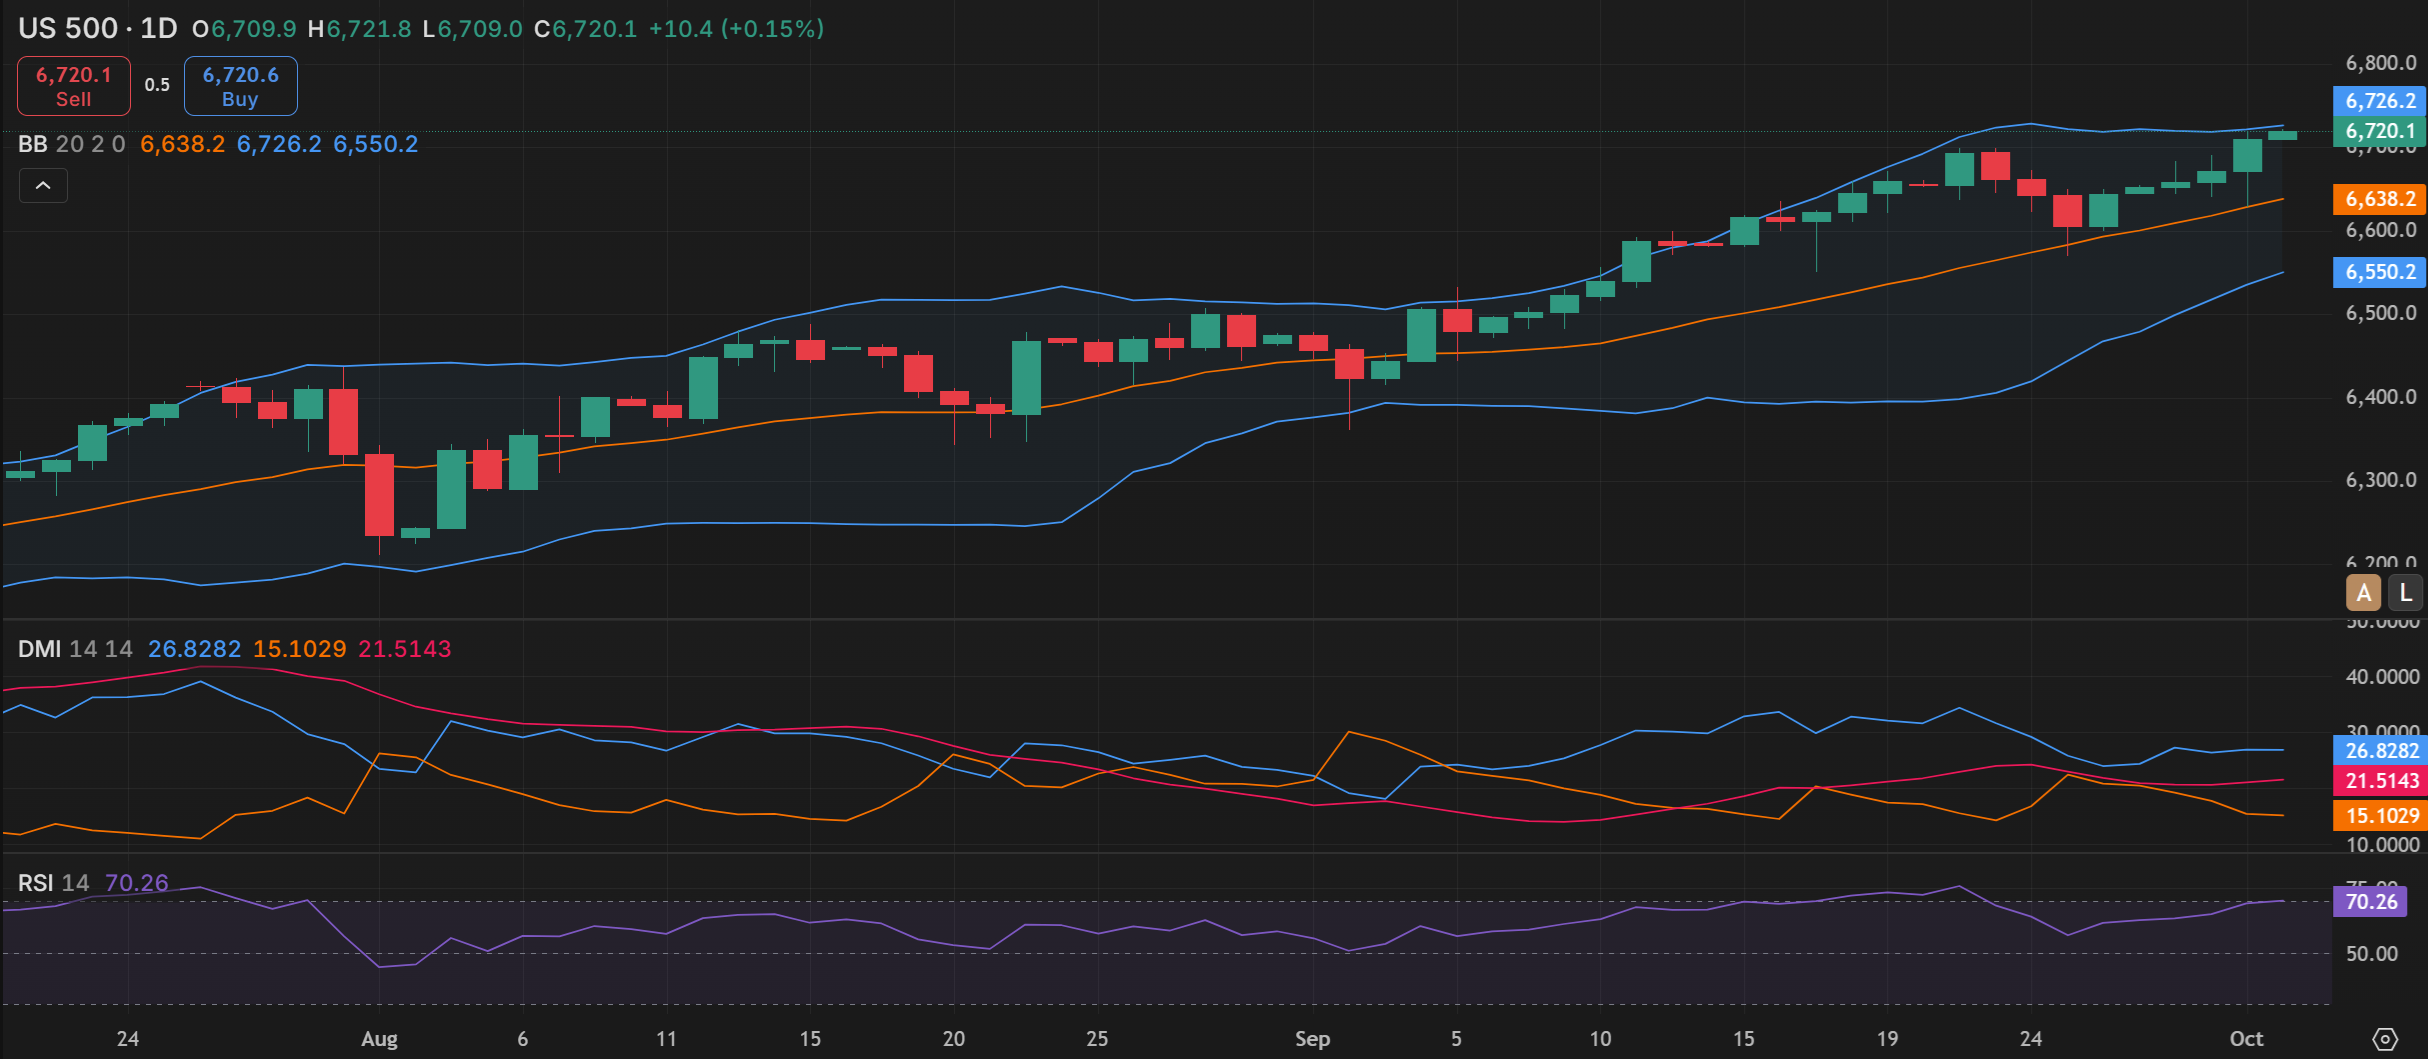
Source: Capital.com
Period: JULY 2025 – OCTOBER 2025
Past performance is not an indicator of future results