Trading the S&P 500 After Earnings from the Financial Heavyweights
Impressive results have helped it overcome trade worries and an ongoing shutdown for now, but the technicals are still conflicted on the shorter-term daily time frame due to last Friday’s plunge.
US equity index futures are steady after a session of gains for both S&P 500 (+0.4% to 6,671) and Nasdaq 100 (+0.7% to 24,745) as stronger earnings has managed to offset what US President Trump is labeling a trade war with China, and where Treasury Secretary Bessent said that they “won’t negotiate because the stock market is going down”. The government shutdown persists but one development was the federal judge blocking the Trump administration from firing federal workers for now.
Treasury yields finished slightly higher but not on the furthest end of the curve with real yields edging higher, and market pricing (CME’s FedWatch) remains very close to fully pricing in consecutive 25bp (basis point) rate cuts out of the Federal Reserve (Fed) for both this month and December while a coin toss on holding vs reducing rates again in January. Speaking of the Fed, they released their ‘Beige Book’ where economic growth has been little changed since their early September report with labor markets “largely stable” even if demand “muted”, and that prices “rose further” but that the extent of higher tariff-induced costs “passing through to final prices varied”. A few FOMC (Federal Open Market Committee) members spoke, with Miran seeing trade tensions requiring them to “think about the introduction of a new tail risk” and thinks “it’s even more important now…than a week ago that we move quickly to a more neutral stance”.
Looking at key stocks within the S&P 500 and shares of heaviest Nvidia were down about 0.1% by the close with the attention on rival AMD once more as it jumped 9.4% building off the previously announced deal with Oracle (+1.5%). Quarterly earnings impressed for the financial heavyweights, the latest being Bank of America (+4.4%) and Morgan Stanley (+4.7%) beating on their respective key metrics and seeing a boost in investing banking revenue.
As for economic data, there hasn’t been much of it thanks to the government shutdown, and elsewhere it was mixed with Empire’s manufacturing index for October improving notably to post a positive print of 10.7 from -8.7 prior, while weekly mortgage applications (MBA) suffered another negative reading.
We’ve got a couple items in terms of economic data with Philly Fed’s manufacturing index and NAHB’s housing market index, and more FOMC members speaking. Those of you interested in earnings we’ll get more of that too though from smaller financial companies including Charles Schwab and BNY Mellon.
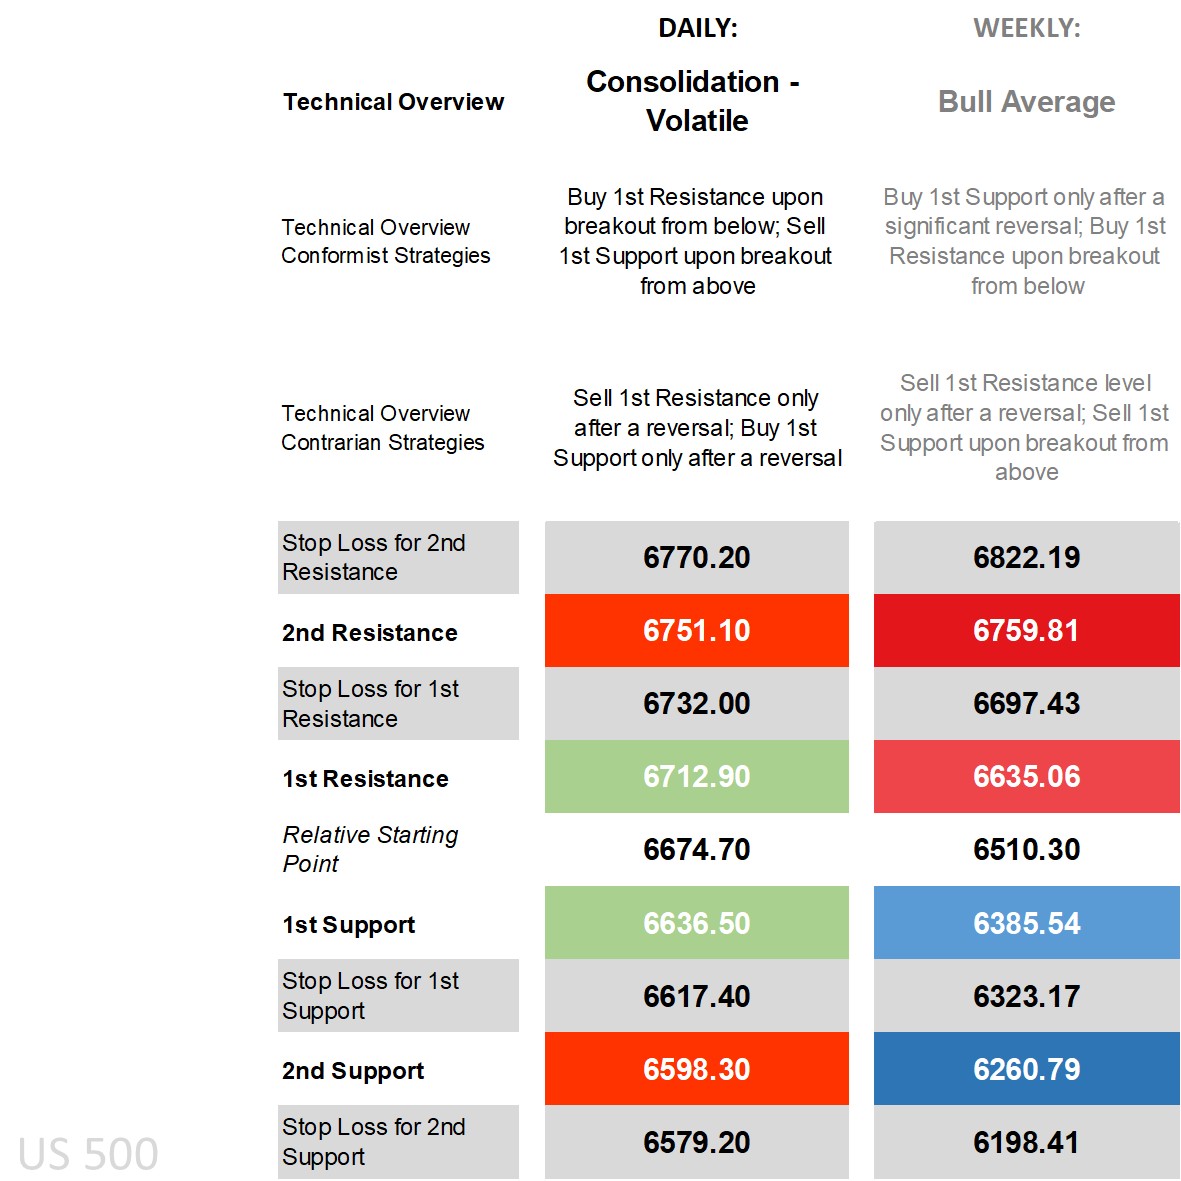
S&P 500’s technical overview, strategies and levels
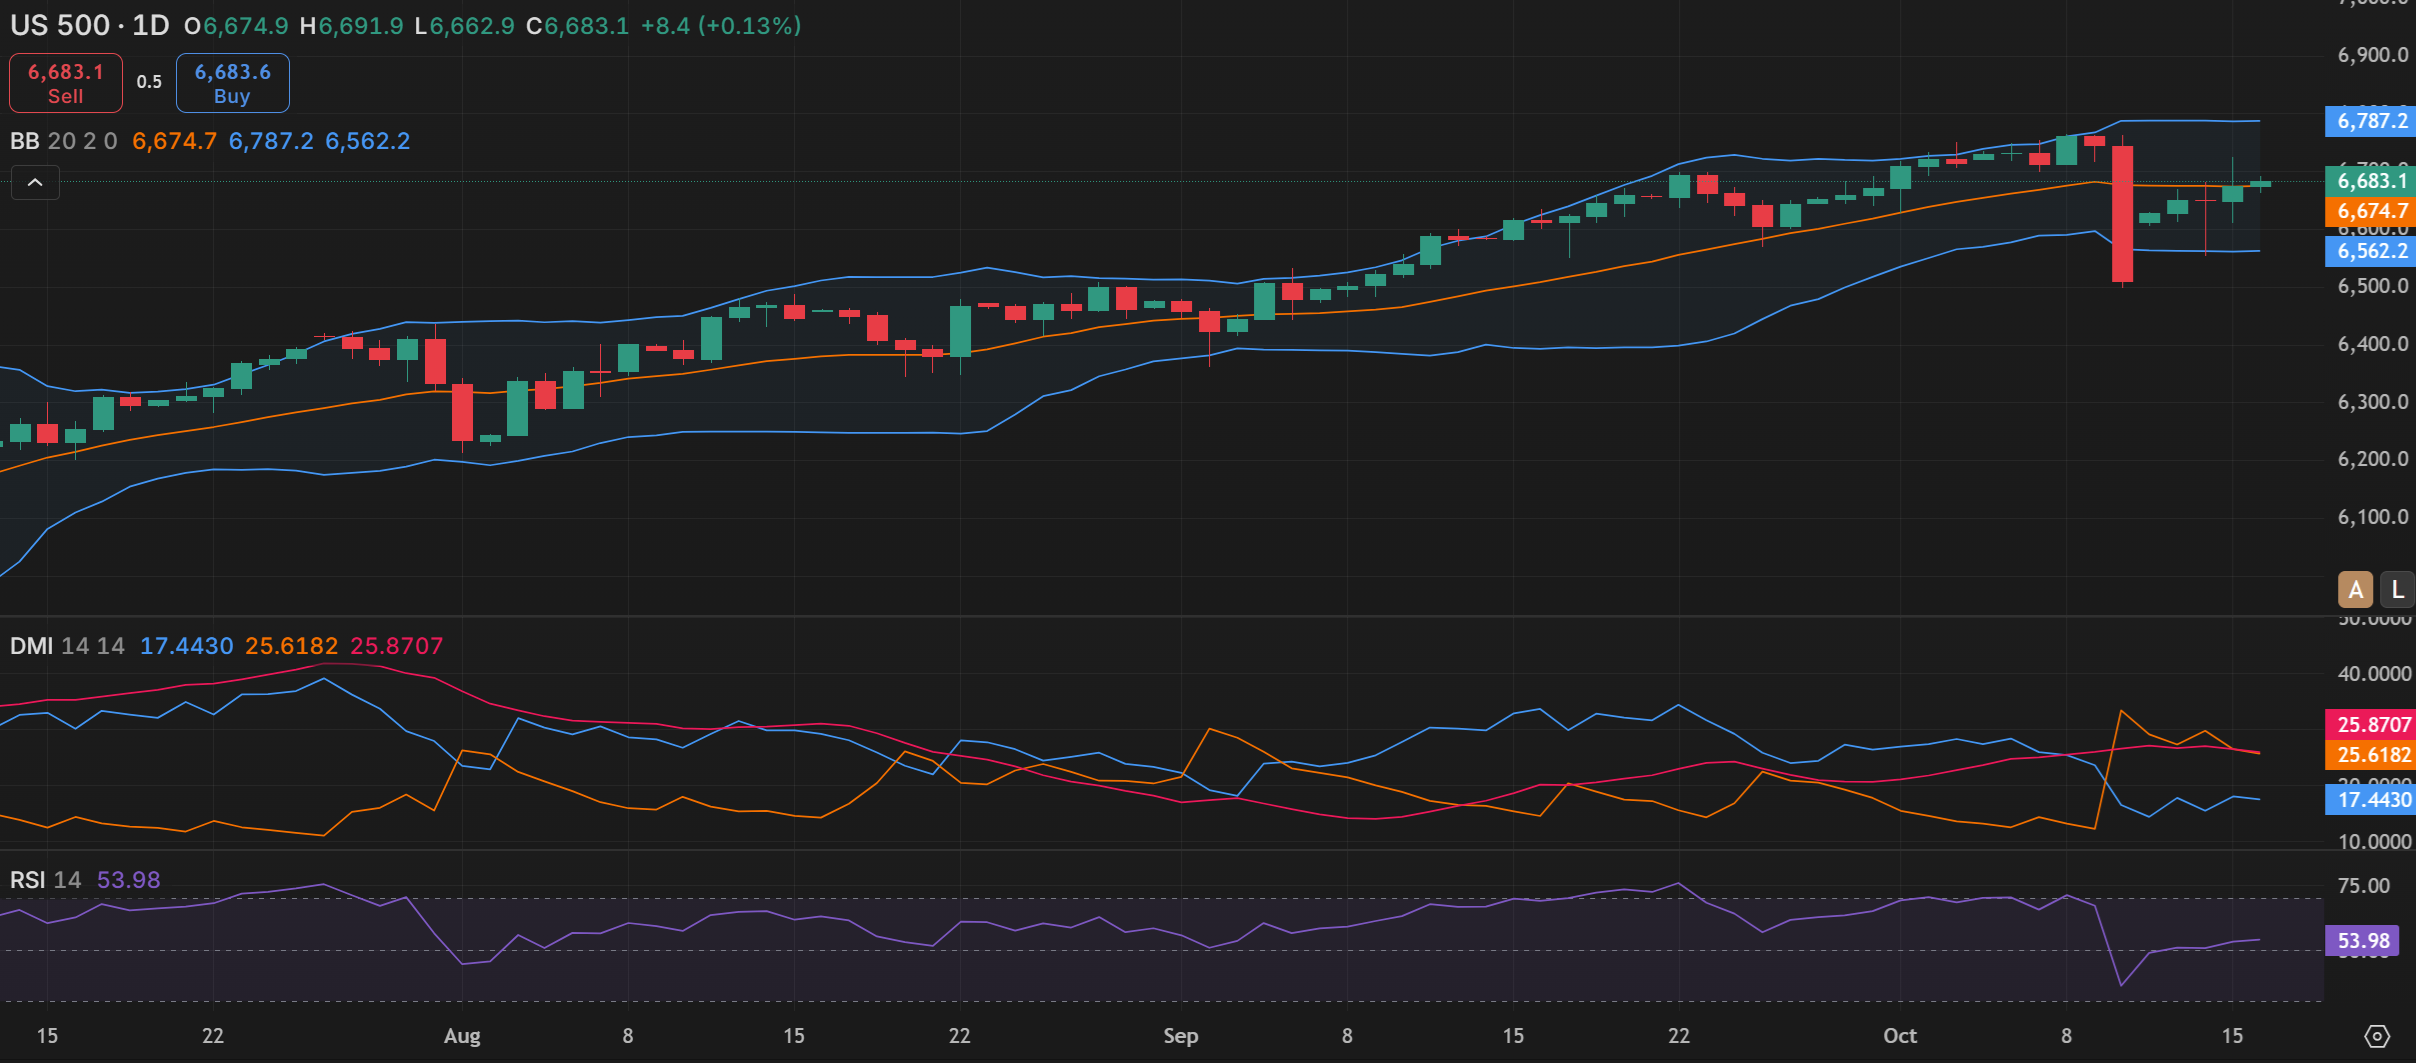
Looking at the daily time frame and price is above all its main long-term moving averages (MA) while no longer below all its main short-term ones, recovering off the lower end of the Bollinger Band to the middle, on the DMI (Directional Movement Index) front still negative with the -DI over the +DI though by a declining margin, an RSI (Relative Strength Index) not far off 50, and an ADX (Average Directional Movement Index) still in trending territory.
Mixed on the technicals then in the shorter term with an overview more ‘consolidation – volatile’ where breakout strategies are in the conformist camp and reversals are for contrarians who expect price to hover in these ranges, with the latter outperforming on the lack of a trend move while the former requiring an intraday uptick in volatility else an interday move to see follow-through beyond its daily 1st levels. Zooming out to the weekly and the overview remains ‘bull average’ built off historic bullish bias, with price already above this week’s weekly 1st Resistance level giving conformist buy-breakouts the edge with only an initial victory for contrarian sell-after-reversals last Tuesday on the brief dip.
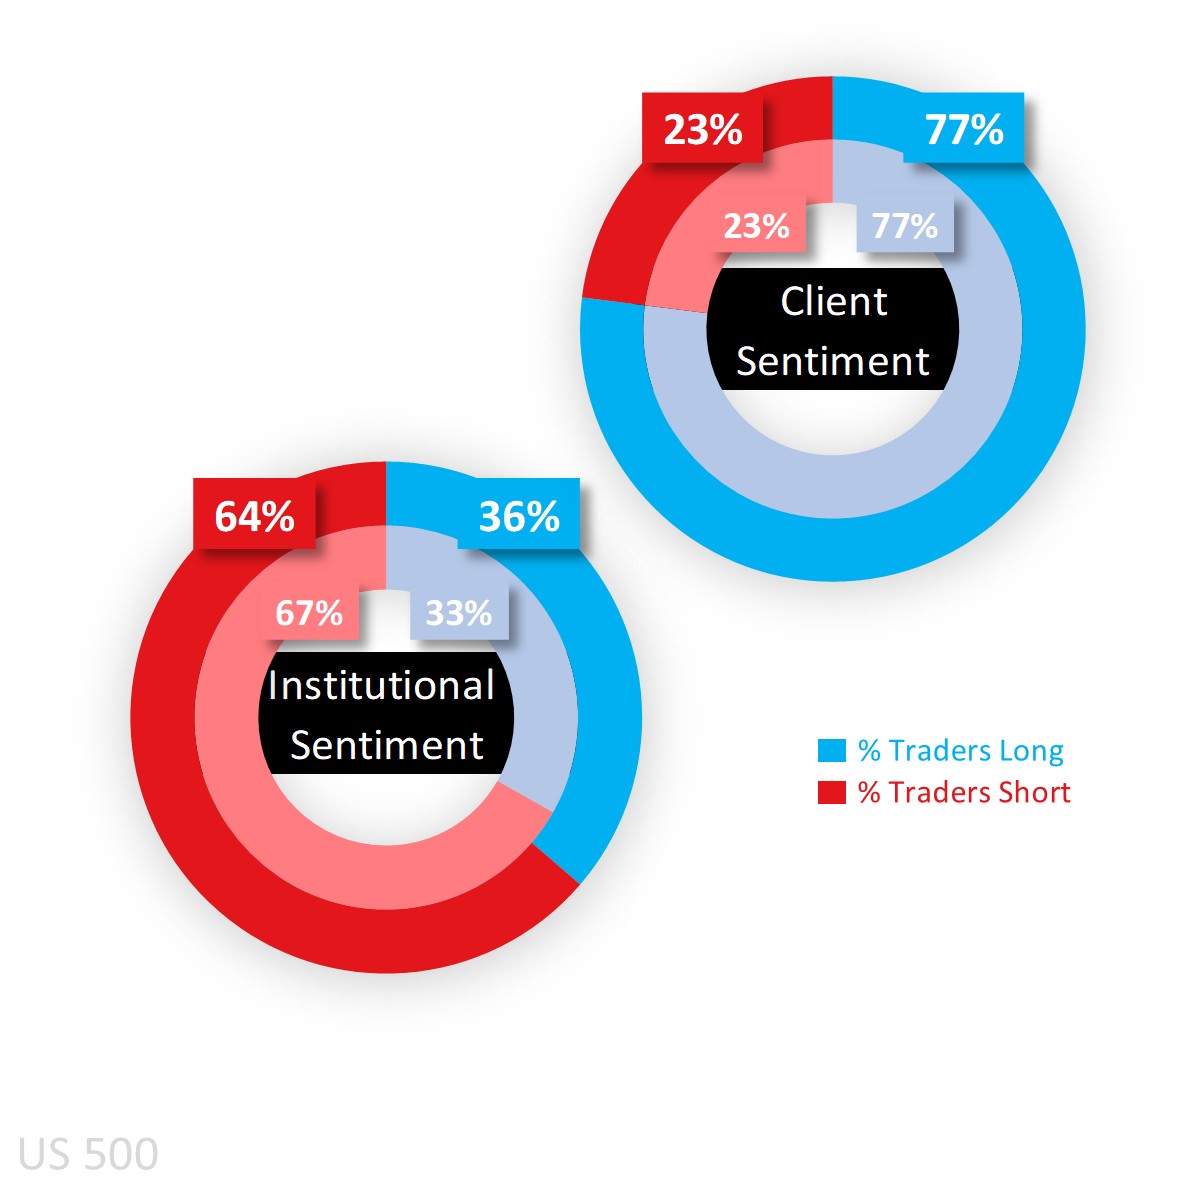
Capital.com’s client sentiment for S&P 500
It remains a story of heavy to extreme buy bias among Capital.com’s clients buying into the pullback last Friday and generally holding ever since anticipating further price gains. They are also majority long in the Dow (73%), Nasdaq (64%) and Russell (66%) though by smaller percentages compared to the S&P where it’s highest. The ongoing government shutdown means the CoT (Commitment of Traders) report out of the CFTC isn’t available, but based on the older reports they were net sell.
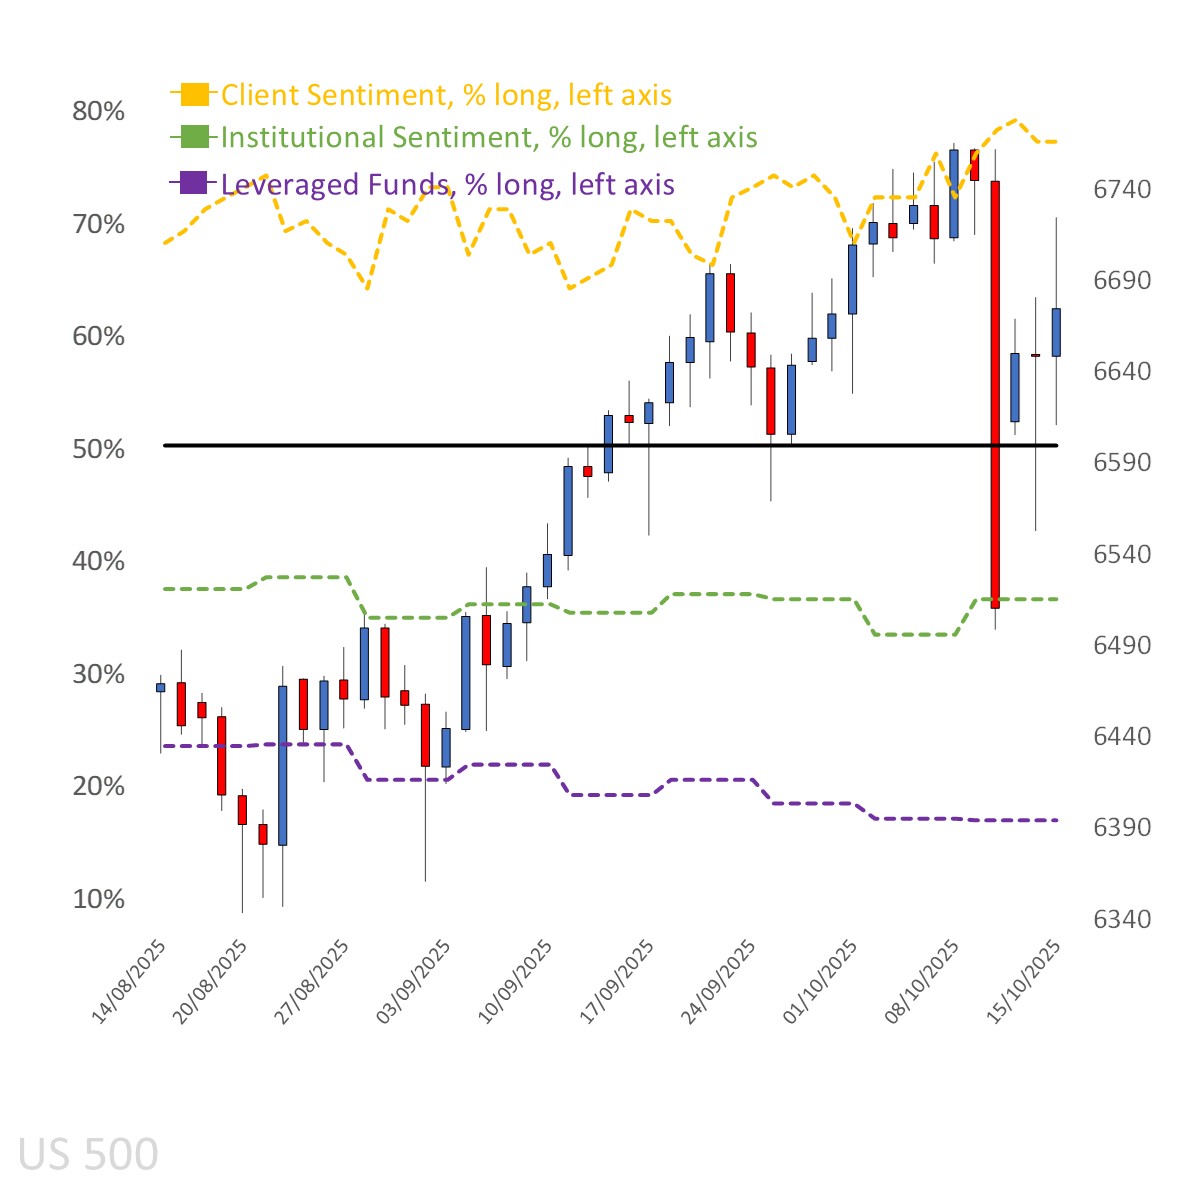
Client sentiment mapped on the daily chart
 Source: Capital.com
Period: AUGUST 2025 – OCTOBER 2025
Past performance is not an indicator of future results.
S&P 500’s chart on Capital.com’s platform with key technical indicators
Source: Capital.com
Period: JULY 2025 – OCTOBER 2025
Past performance is not an indicator of future results