S&P 500 & NASDAQ Face Re-Rating Risk Amid Liquidity and AI Concerns
Since mid-October, the S&P has fallen around 4%, while the Nasdaq has declined about 5%. There are many reasons for this, and various paths that have led us here over the past month.

Perhaps the most important aspect is that the market is beginning to reconsider the AI narrative and whether the Magnificent Seven should continue to command the high multiples and valuations assigned to them, as CAPEX spending has surged, leading to a deterioration in free-cash-flow, and the credit market to get into the mix.
(Source: MottCapitalManagement)
Past performance is not a reliable indicator of future results.
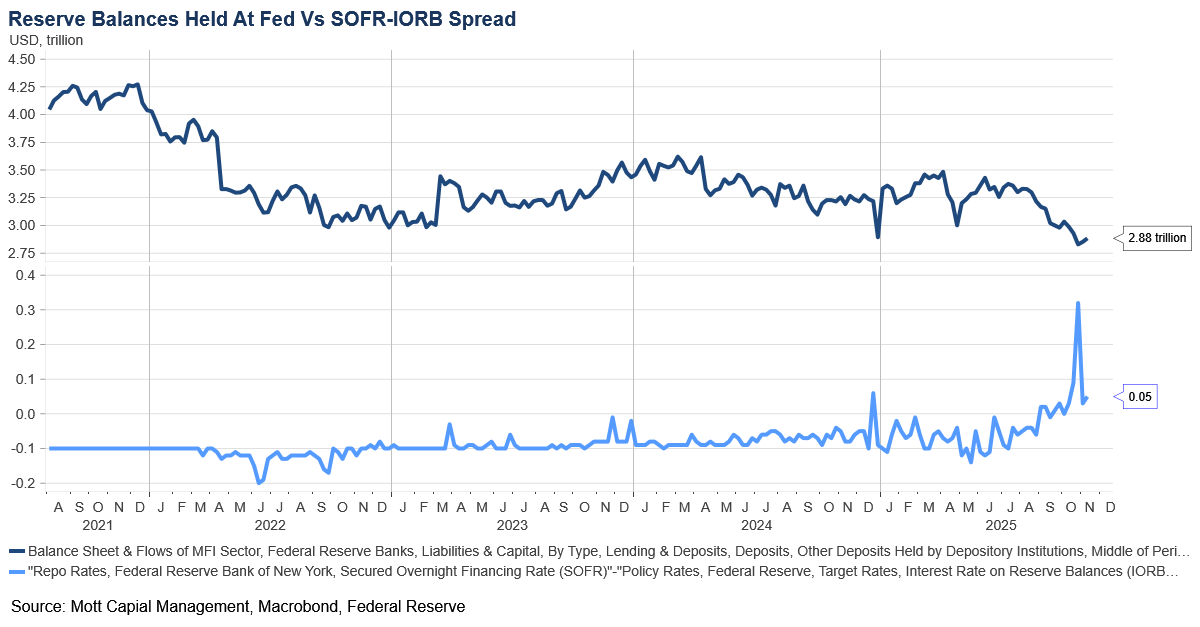
However, it goes deeper than liquidity and AI spending; interest rates in Japan have been rising sharply as markets become increasingly concerned about proposed stimulus plans, while hopes for Federal Reserve rate cuts have eased, with markets now pricing in only about a 50% chance of a December cut. Collectively, these developments suggest why equities may struggle to rise further.
(Source: MottCapitalManagement)
Past performance is not a reliable indicator of future results.
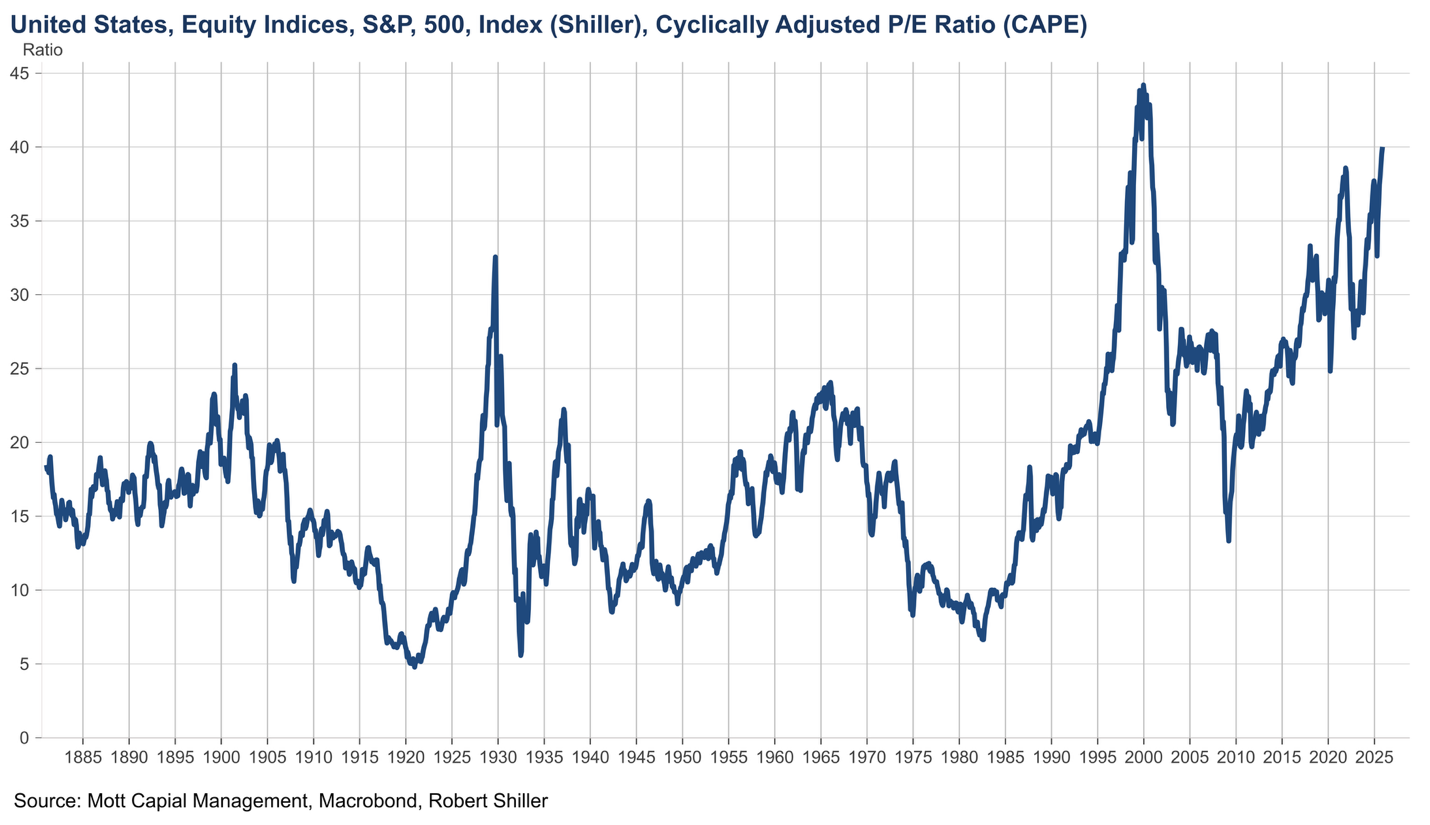
Adding to this is the reality that the S&P 500 is trading at one of its most overvalued levels in many years, comparable only to the dot-com era of the late 1990s, suggesting that markets may be due for a more significant pullback.
Questions Emerge Over AI Spending
(Source: LSEG)
Past performance is not a reliable indicator of future results.
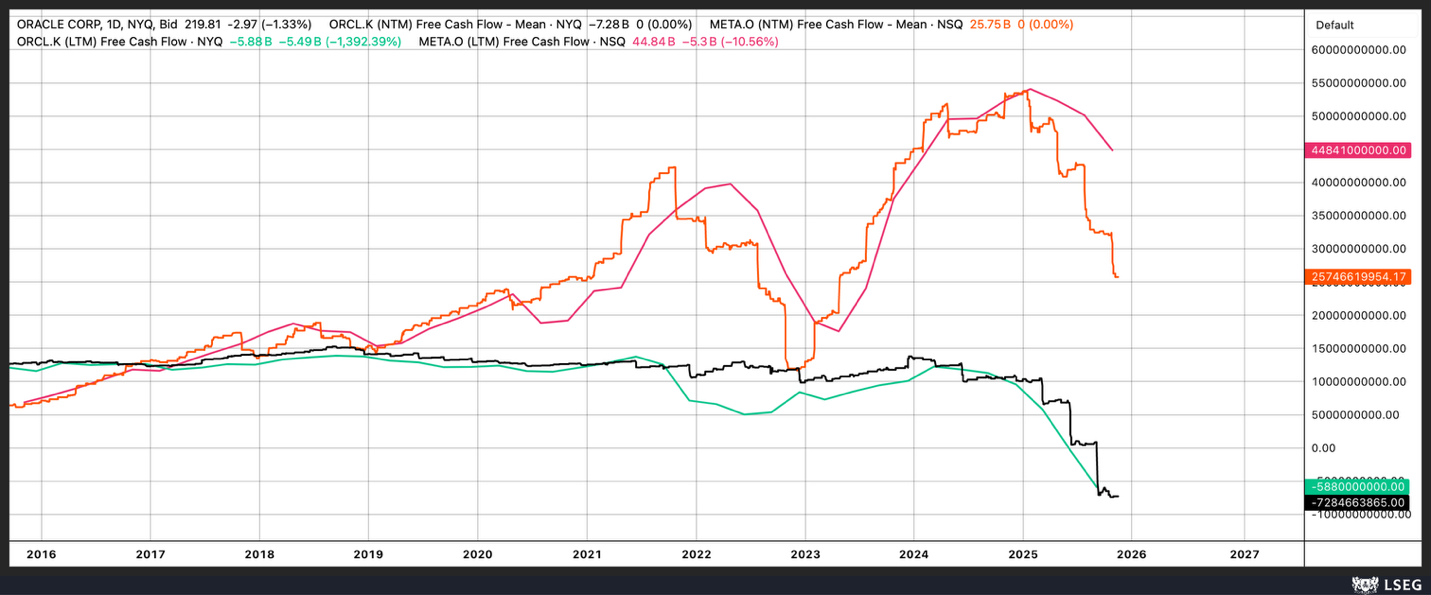
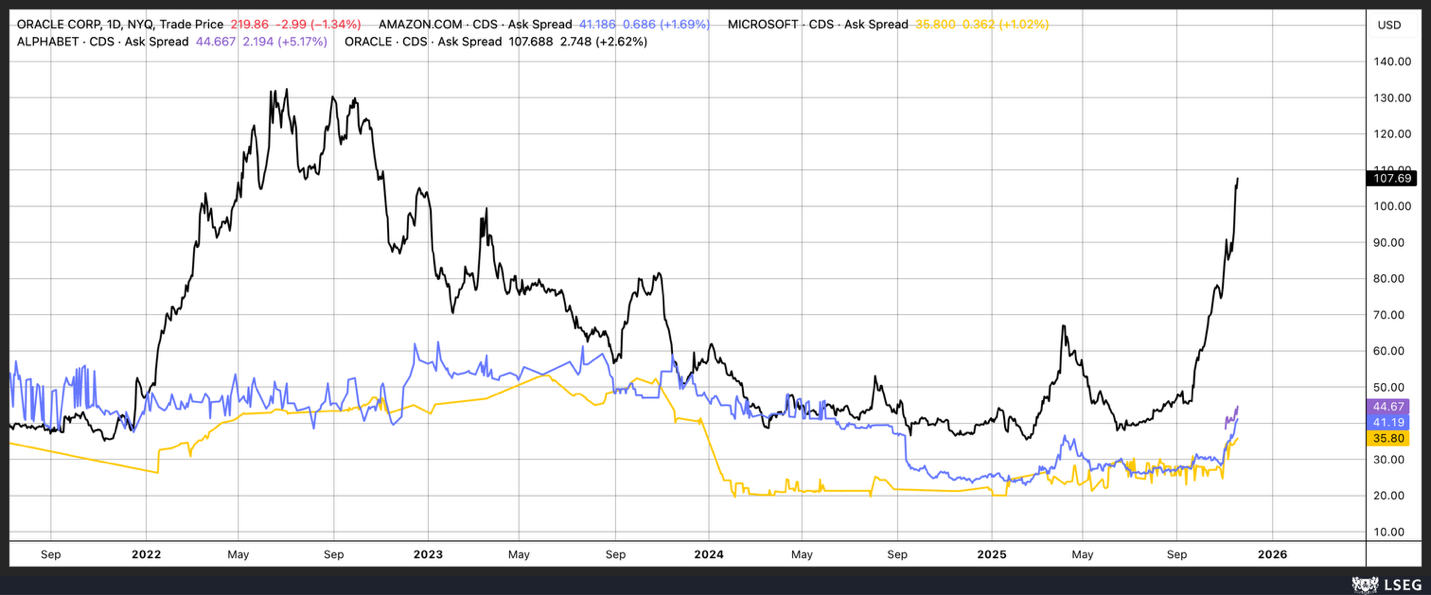
For the first time in two or three years—since AI became a dominant theme—there are clear signs of changes beneath the surface of these companies. Free cash flow has been declining, expectations for future free cash flow are deteriorating for companies like Oracle and Meta, and credit default swap spreads are widening as the cost of insuring against default rises. This could become a significant issue, as it may prompt a broader shift in how the market values these companies. What we may be witnessing is the early stage of a valuation re-rating, arriving at a moment when liquidity is being drained from the system due to the large deficits run by the US government, while the full impact of the Fed’s tightening cycle hits the market hard. Could this combination potentially mark the beginning of something more substantial than a typical pullback?
(Source: LSEG)
Past performance is not a reliable indicator of future results.
S&P 500 May Be Breaking Down
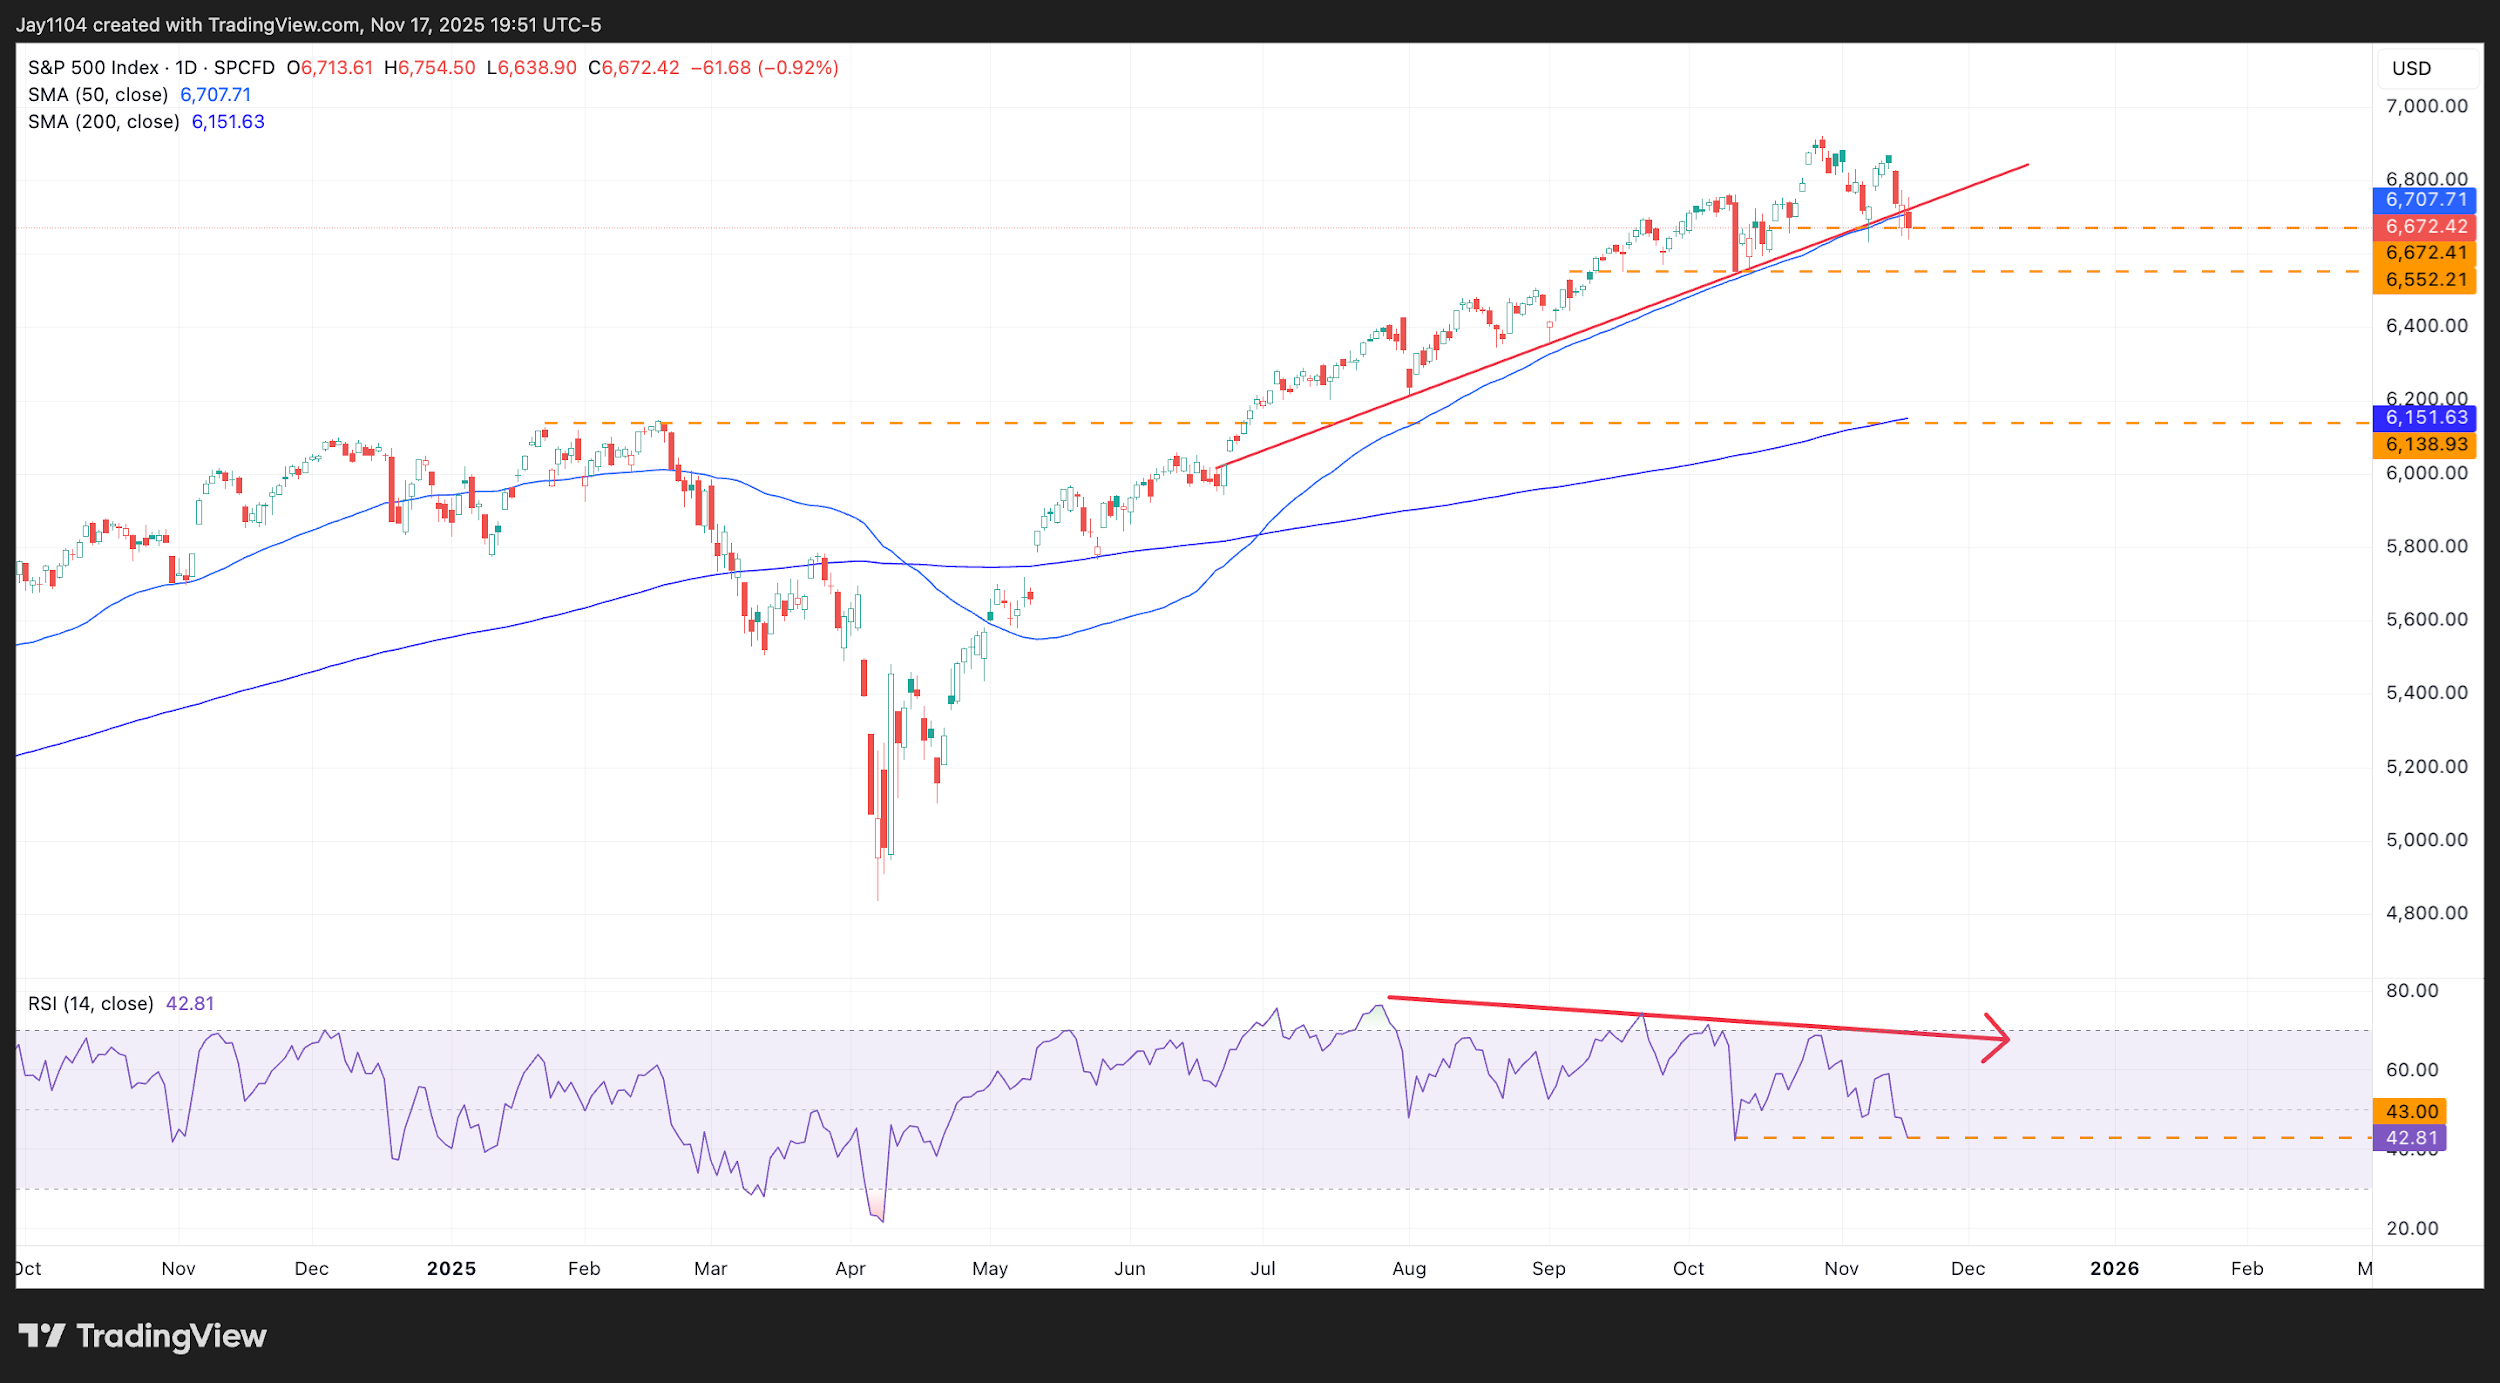
When examining the S&P 500, technical indicators suggest that substantial technical damage has occurred in recent days. The index has fallen below an uptrend that seemed to start in mid-June and is now below its 50-day moving average. Currently, the only significant support appears to be around 6,650. Should that level fall, the next major support zone is near the October lows, approximately 6,550. Beyond that, there is little to support the index until about 6,150, which aligns with the highs last seen in January and February at the beginning of the year.
(Source: TradingView)
Past performance is not a reliable indicator of future results.
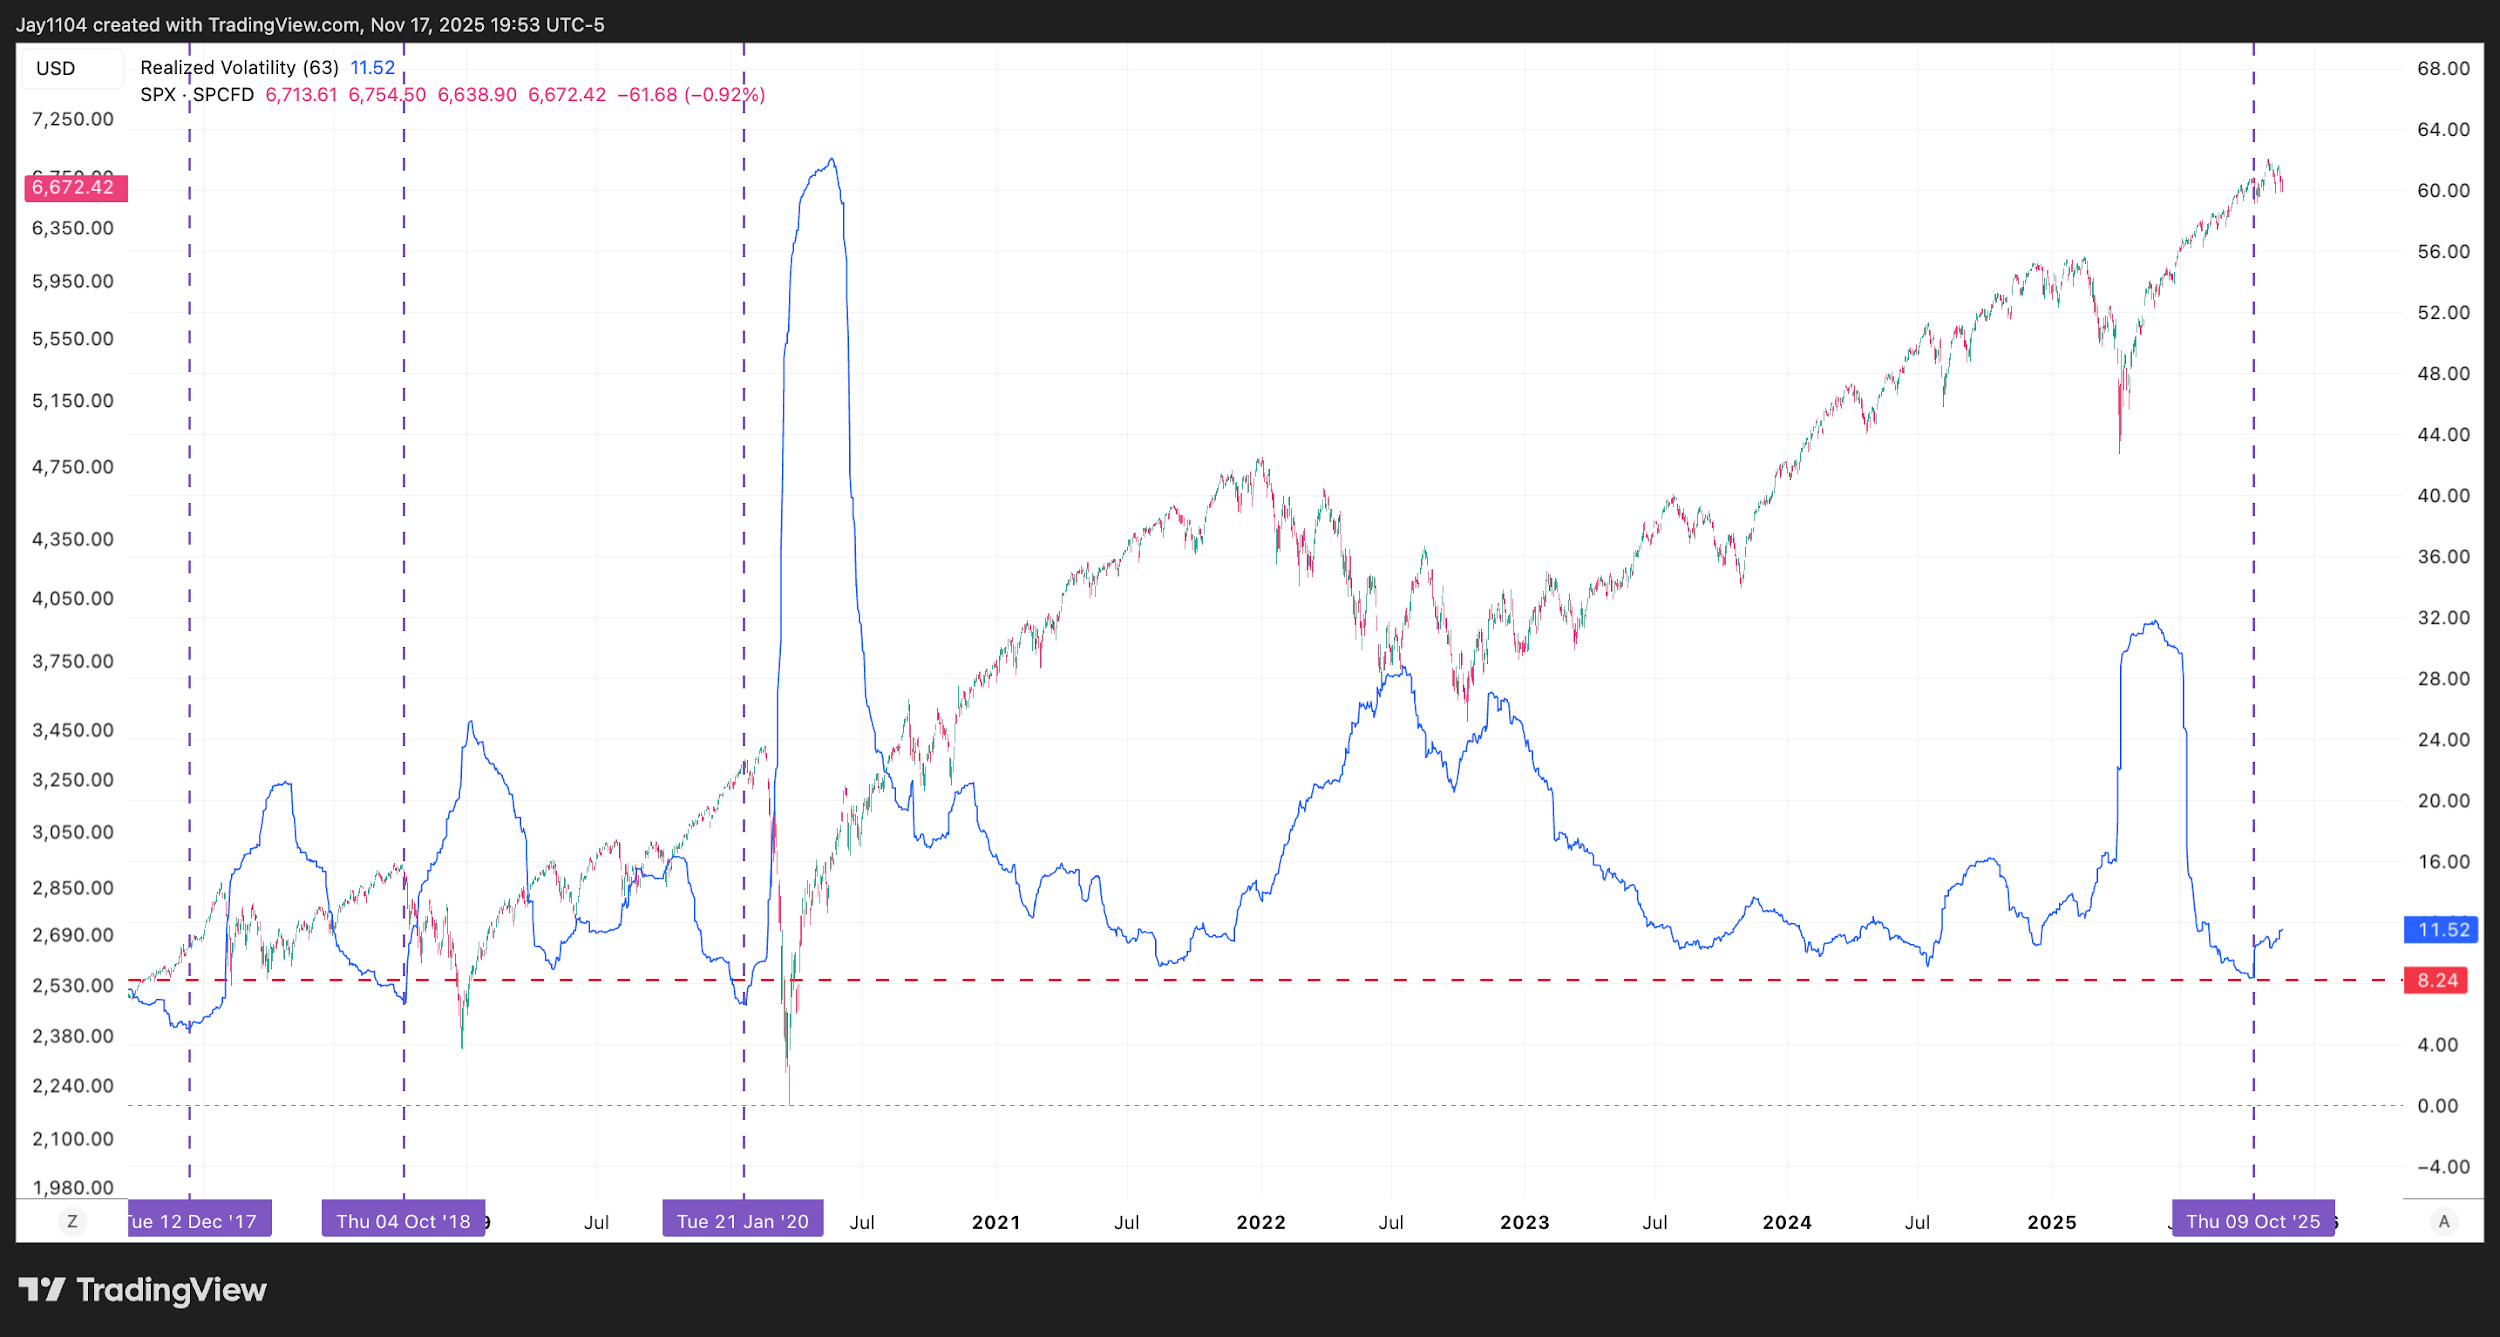
Additionally, a clear bearish divergence on the RSI, which has been trending lower since peaking at overbought conditions in mid-July, is forming a series of lower highs even as the S&P 500 continues to make higher highs. This indicates that the market has been rising on weakening momentum for several months, often hinting at a potential larger trend reversal. It is also worth noting that three-month realised volatility dropped to extremely low levels, around 8%, at the start of October. These conditions are typically linked with blow-off tops, such as those seen in January 2020, October 2018, and December 2017 into January 2018—periods that all preceded substantial declines in the S&P 500, much greater than a routine pullback. Historically, episodes of such subdued volatility tend to be followed by extended periods of much higher volatility, however it remains to be seen if this will be the case this time around.
(Source: TradingView)
Past performance is not a reliable indicator of future results.
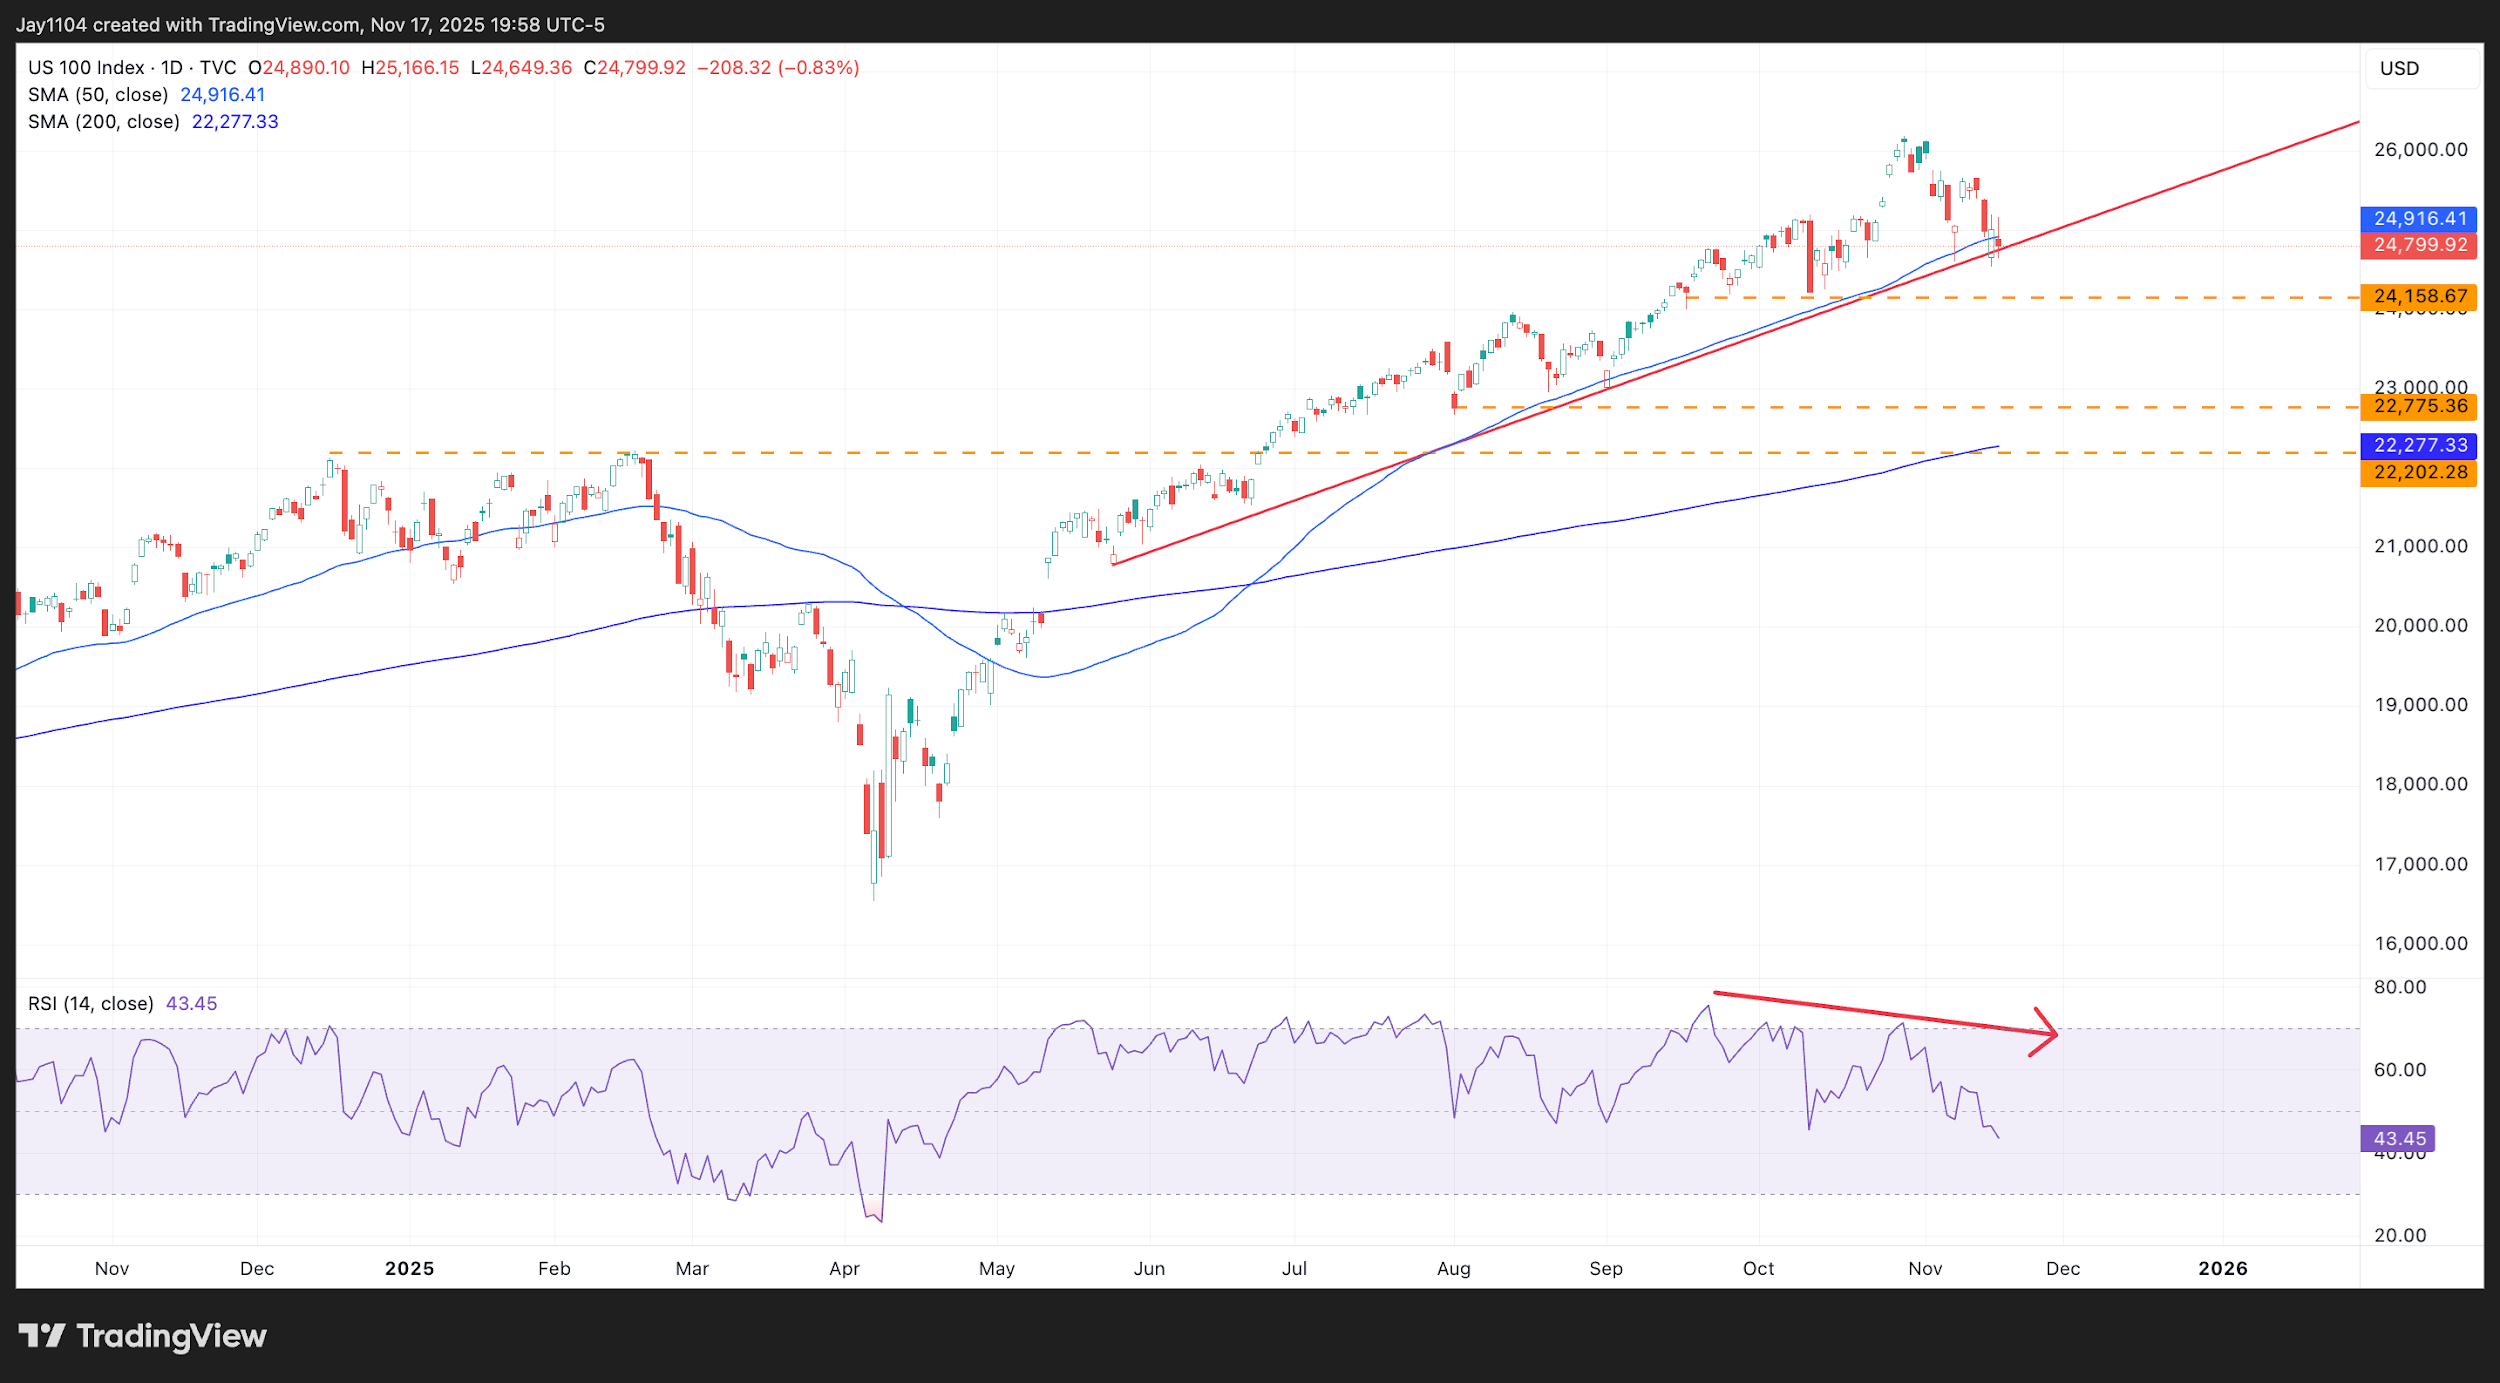
NASDAQ 100 Exhibits Similar Weakness
For the Nasdaq, the technical outlook appears largely unchanged. The index closed below its 50-day moving average on 17 November and is now resting on a significant uptrend that dates to early May. Like the S&P 500, a bearish divergence has developed, with the RSI forming lower highs and lower lows while the index has continued to climb. There also seems to be support around 24,150. If that level is broken, it could lead to a sharper decline towards approximately 22,775. Beyond that, we are once again looking towards the January and February highs, which would indicate an additional fall of about 10%.
(Source: TradingView)
Past performance is not a reliable indicator of future results.
The S&P 500 and the Nasdaq are both in positions that could lead to significantly lower prices in the near term. How deep the pullback ultimately becomes will depend on how quickly the issues currently facing the market develop. If the Magnificent Seven continue to increase AI-related spending at the expense of free cash flow, that could remain a problem for the broader market, likely causing wider credit spreads. If Japan goes ahead with expanded fiscal spending, that is likely to keep pushing long-term JGB yields higher. And if the Federal Reserve is slow to react to the emerging liquidity shortage and opts not to cut rates in December, it will also act as a constraint on equity markets. Whether this turns out to be a quick pullback or the start of something more substantial is still uncertain, but the ingredients for a larger, sharper decline are certainly in place.