Trading the Nikkei 225 After its 50K Breach
The technicals remain bullish on both daily and weekly time frames, while in sentiment it’s a story of majority buy bias.
It’s not uncommon to see Japan’s Nikkei 225 track Wall Street higher, as last Friday was a boon for risk appetite thanks to US CPI (Consumer Price Index) prints that were lighter than anticipated firming up Federal Reserve (Fed) rate cut likelihoods for both this Wednesday and December. We got a record close for the week when it came to the S&P 500 (w/w +1.5% to 6,791), and so too both Nasdaq 100 (w/w +1.5% to 25,358) and Dow 30 (w/w +1.9% enjoying a close above 47K).
And then came the optimistic weekend news regarding US-China trade talks as Treasury Secretary Bessent said the additional 100% tariffs on China are “effectively off the table” with a “very successful framework” for President Trump and his Chinese counterpart “to discuss on Thursday”. That has sent futures gapping higher and in turn a plus for Japan as well, with both President Trump and Japanese Prime Minister Takaichi expected to meet this week. Asia is up in general at the start of the week thanks to good news and stronger Chinese economic data thanks to a big boost for industrial profits in September.
Week ahead
In terms of the week ahead, there are multiple items on multiple fronts. Both the FOMC (Federal Open Market Committee) and Bank of Canada are expected to cut rates by 25bp (basis points) on Wednesday, while both European Central Bank and Bank of Japan (BoJ) are likely to hold on Thursday. For this key Japanese equity index, both FOMC and BoJ decisions are important, in that the former needs to continue cutting rates helping Wall Street higher, while the latter needs to avoid rate hikes as pro-stimulus Takaichi attempts to boost domestic demand. On the earnings front, five (Microsoft, Meta, Alphabet, Apple and Amazon) of Big Tech out in the US will be releasing their figures, and given their sizable weightings in key US equity indices and their impact on the tech sector will naturally travel across the Pacific and make its impact felt on the Nikkei 225. Trade updates will also be noted and especially the Trump-Xi meeting on Thursday, with any further clarity on US-Japan trade from the Trump-Takaichi meeting an added plus.
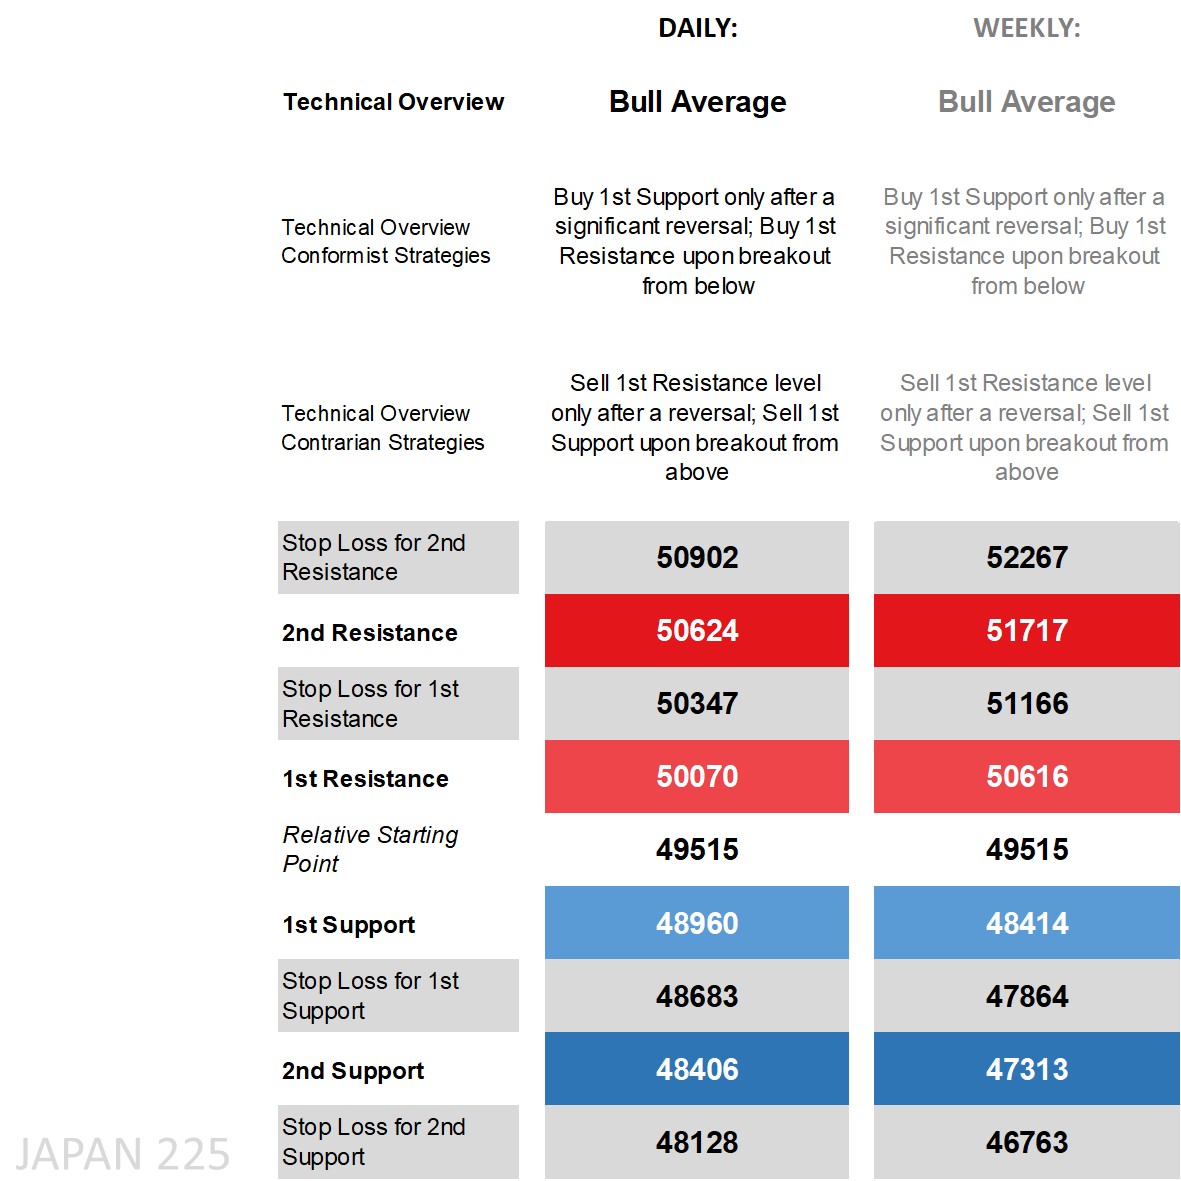
Nikkei 225’s technical overview, strategies and levels
Looking at the daily time frame and a record high means price is obviously above all its main moving averages (MA), on the DMI (Directional Movement Index) front a sizable margin for the +DI over the -DI easily labelling it as ‘positive’, an RSI (Relative Strength Index) not far off overbought territory, and an ADX (Average Directional Movement Index) in trending territory. Much of the price action has been within a bull channel, the width of which is still wide, and means a ‘bull average’ technical overview instead of ‘bull trend’ noting if price moves to the lower end of the channel which would strain any buy strategies. Hence the added caution buying off any pullbacks doing so only after a significant reversal when working with the key support levels for those in the conformist camp that see prices eventually moving higher. Price is already above today’s daily 1st Resistance level thanks to the gap higher and fundamental news and was at one point close to this week’s weekly 1st Resistance level.
The weekly time frame’s technical overview is also ‘bull average’ enjoying far more bullish technical indicators with price walking the upper end of the channel, a massive gap for the +DI over the -DI, an ADX well in trending territory and an RSI in overbought territory. The channel doesn’t seem as large when viewed from the weekly candlestick chart, and especially when considering the wider distance between the Relative Starting Point and the weekly 1st levels.
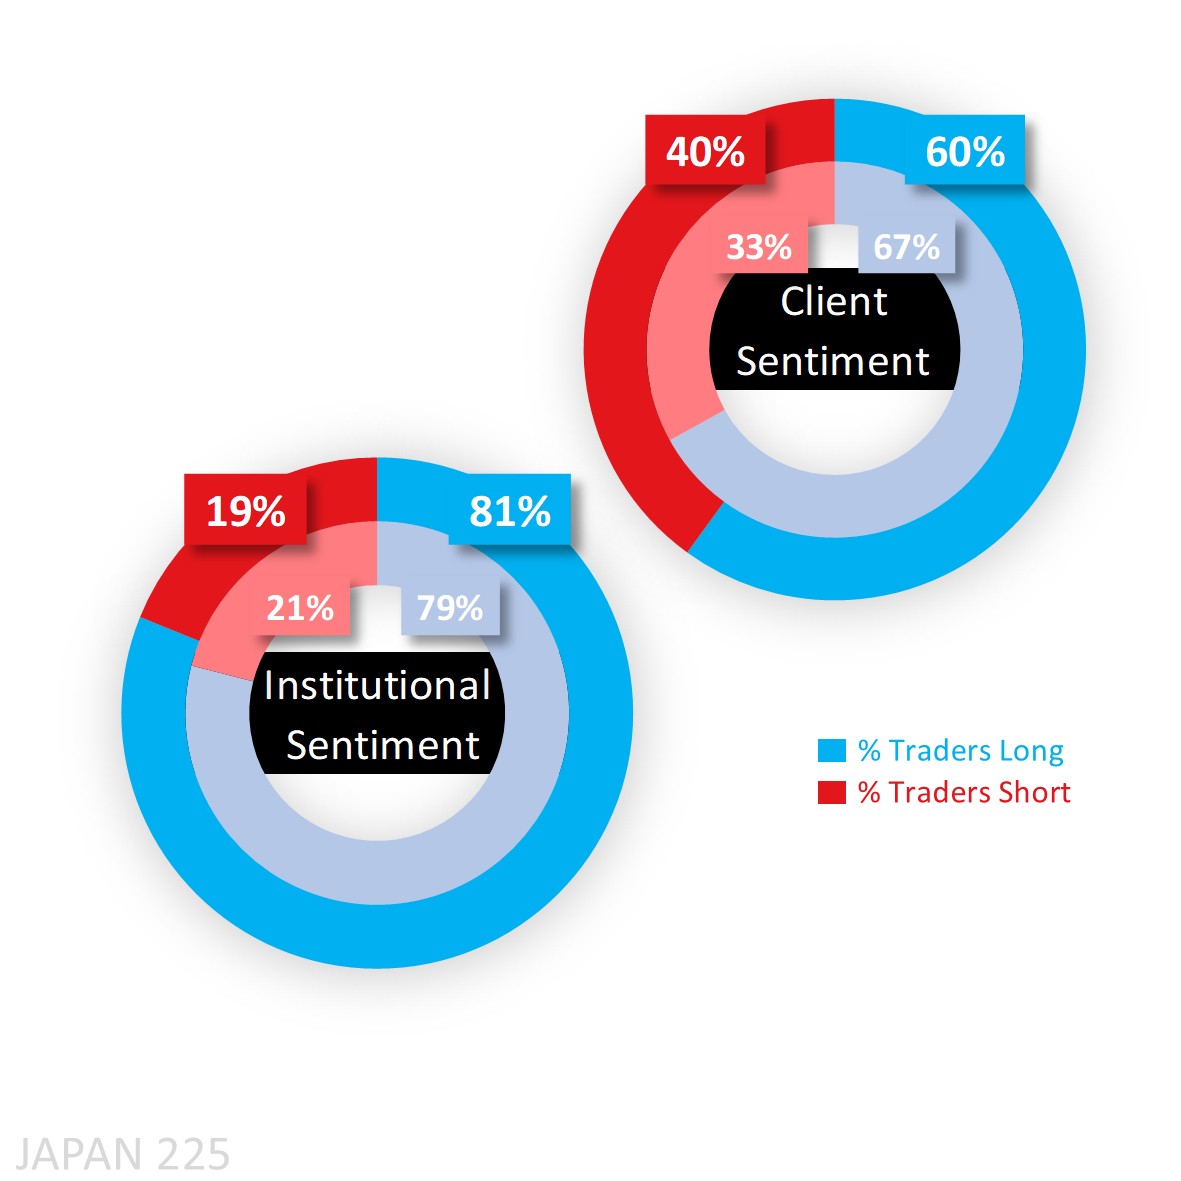
Capital.com’s client sentiment for Nikkei 225
The bias among traders remains majority long and has generally been so when it comes to Capital.com’s clients as seen in the chart below (yellow-dotted line, as % long, using the left axis), with four brief instances of shifting to majority short when prices climbed only to shift back to majority buy opting to find opportunities to go long while shorts prefer not to hold for long opposite the bull trend. But that long sentiment has dropped from a heavy buy 67% last Friday to 60% at the start of the week (and reaching 56% as of writing) meaning fresh longs are still looking at areas to close out before initiating again.
CoT (Commitment of Traders) speculators were net long a very high 81% when the last report was released, but the government shutdown has meant we haven’t been able to get figures for the past month or so.
Client sentiment mapped on the daily chart
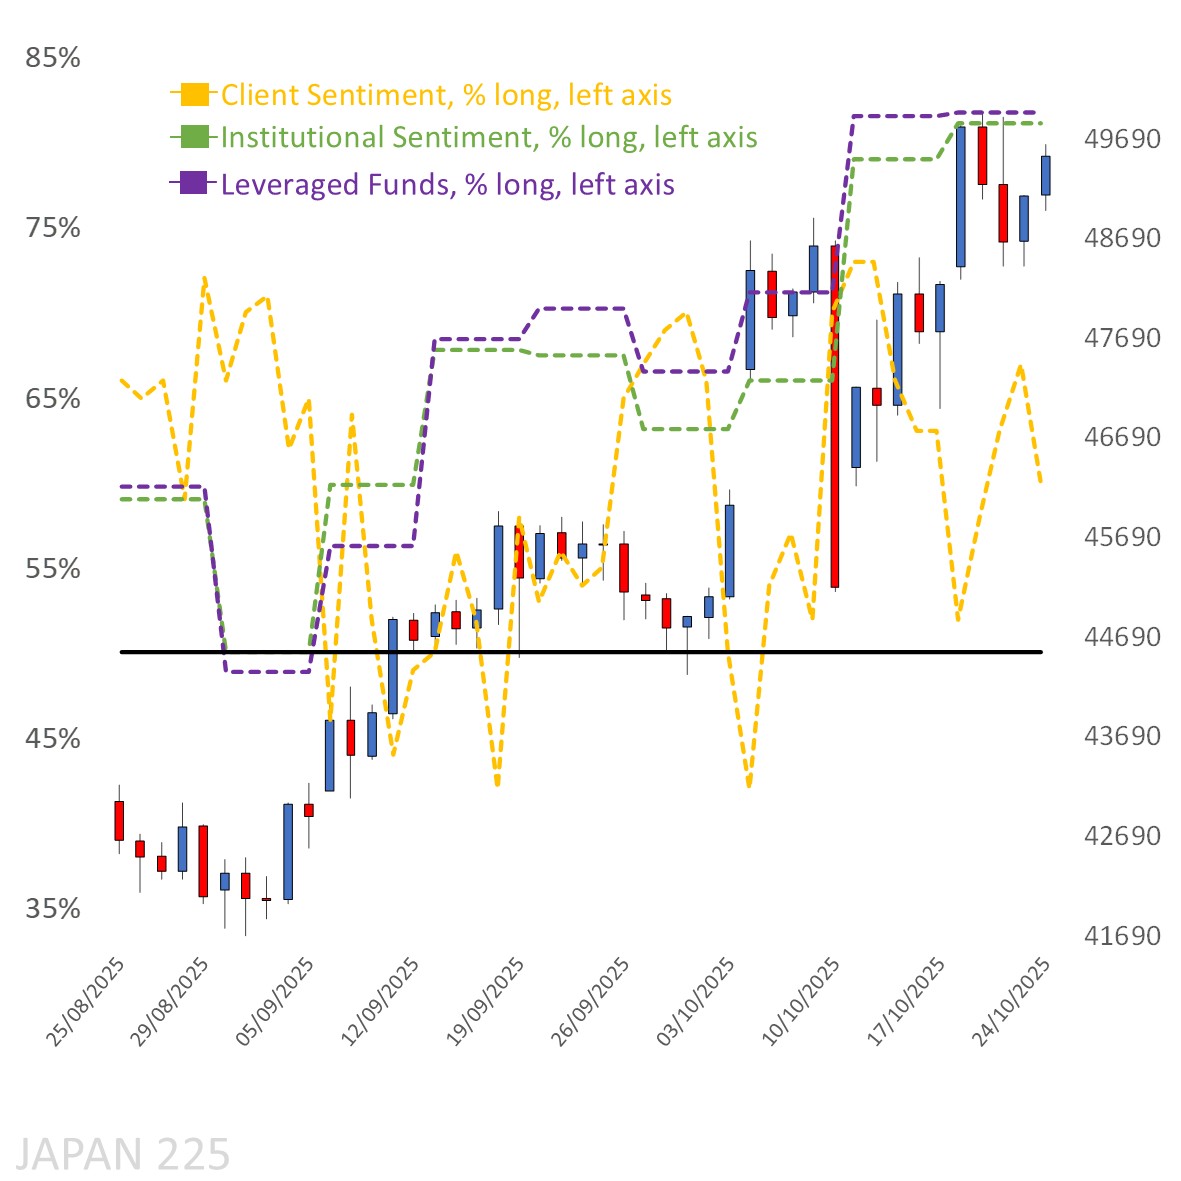
Source: Capital.com
Period: AUGUST 2025 – OCTOBER 2025
Past performance is not an indicator of future results.
Nikkei 225’s chart on Capital.com’s platform with key technical indicators
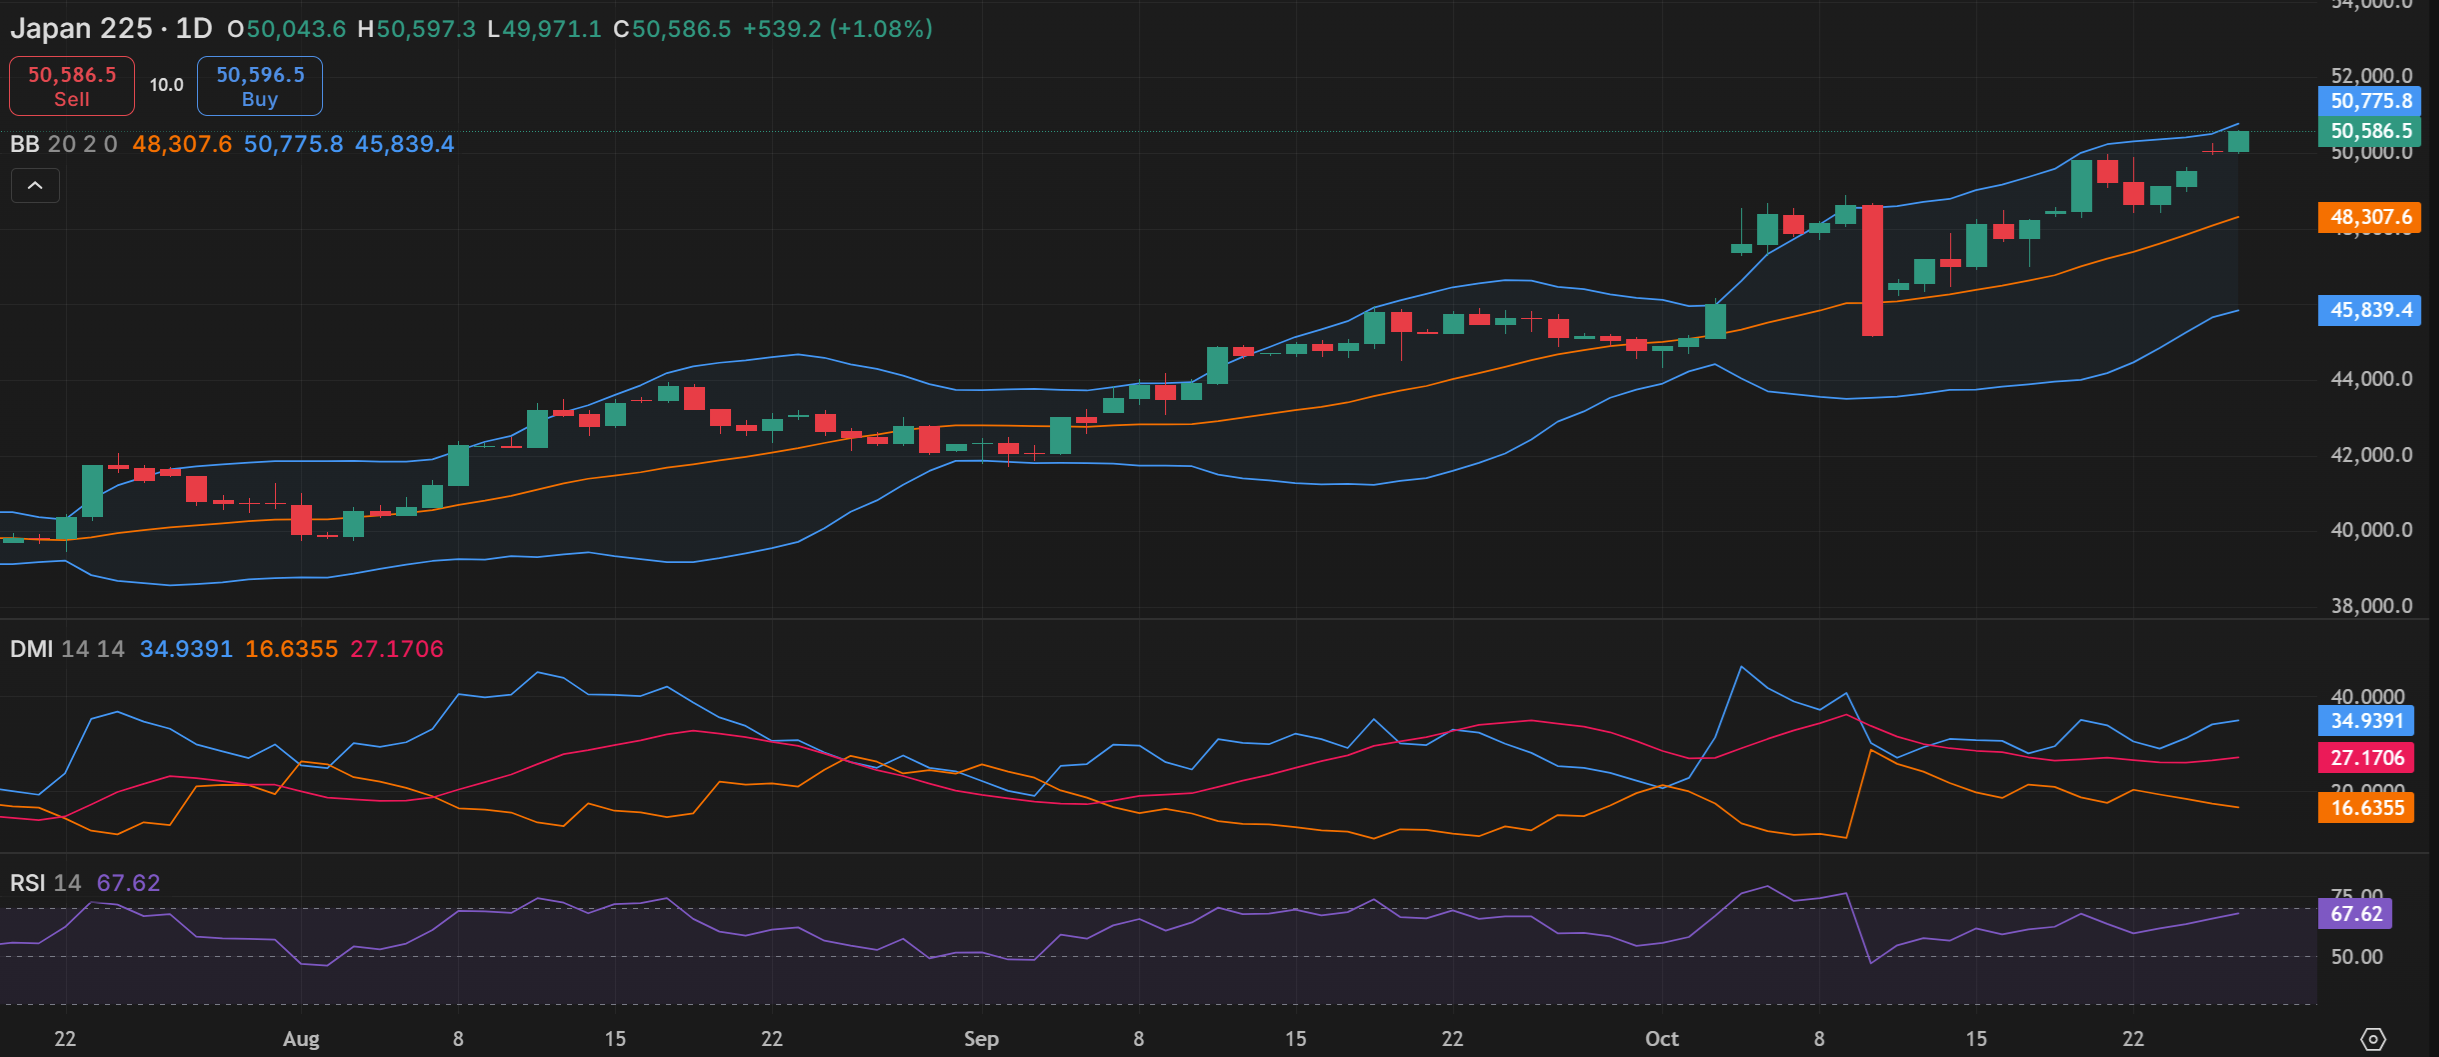
Source: Capital.com
Period: JULY 2025 – OCTOBER 2025
Past performance is not an indicator of future results.