Trading the Nasdaq 100 Amidst AI Investment ‘Circular’ Doubts
It has yet to undo its current bullish technical overview, but in sentiment there’s been an increase in sell bias among CoT speculators.
US equity index futures are in for a small rise only partially undoing yesterday’s session of limited losses for the S&P 500 (-0.3% to 6,637), the tech-heavy Nasdaq 100 (-0.3% to 24,503) and Dow 30 (-0.4% to 46,121) as most sectors finished lower including tech falling back for a second day. That had a bit to do with the ‘circular’ AI investment theme from tech companies raising doubts among market participants. Nvidia (-0.8%) unveiled its $100bn investment plan into OpenAI on Monday that initially gave its shares a boost, but there are fears its investment into companies will then fuel demand for its products needed to power their AI needs resulting in a circular nature.
Other stories on the tech front included Oracle (-1.7%) launching a sizable bond sale, Intel (6.4%) jumping on a Bloomberg report its pursuing an investment from Apple (-0.8%), Marvell (+7.3%) announcing an additional $5bn in share buybacks and $1bn accelerated repurchase, and Tesla closing 4% higher enjoying price target hikes and upbeat forecasts for Q3 deliveries from Wall Street analysts. Beating them all in percentage terms was Alibaba (+9%) as it showcased new AI products and is “vigorously advancing a three-year, 380bn AI infrastructure initiative”.
Over in the bond market, it didn’t help growth stocks that Treasury yields finished higher across the board and so too in real terms (and follows another disappointing auction), with market pricing (CME’s FedWatch) remaining not far off fully pricing in a Federal Reserve (Fed) rate cut in October and via heavy majority anticipating another 25bp (basis point) reduction in December. Speaking of the Fed, it was a cautious tone from Daly who doesn’t expect a recession nor sees the economy heading towards stagflation with further “policy adjustments…likely be required to balance both of our goals” but hard to say when, and so too Goolsbee warning against a series of rate cuts.
What little on offer out of the US in terms of data showed new home sales for the month of August jump over 20% m/m (month-on-month) to 0.8m and at levels unseen since early 2022 allaying growth weakening fears, with the weekly mortgage applications (out of MBA) up again even if by a much smaller amount. Expect more data today with the weekly claims for further insight into the labor market, Q2 GDP (Gross Domestic Product) with an expected strong 3.3% print, durables likely contracting 0.1% in August, and several FOMC (Federal Open Market Committee) members speaking.
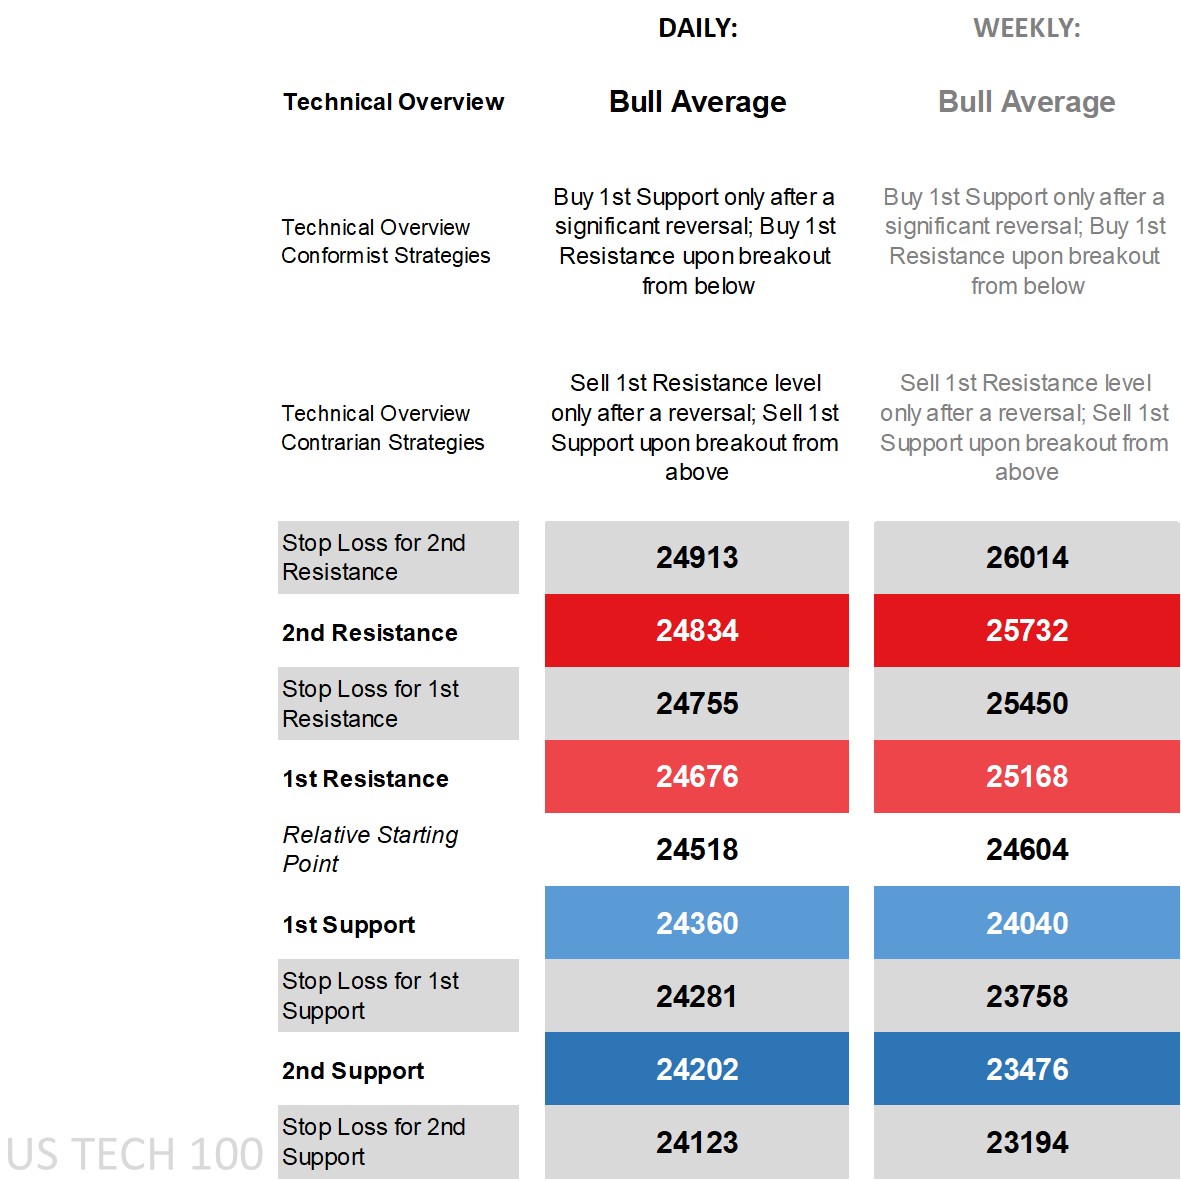
Nasdaq 100’s technical overview, strategies and levels
Looking at the daily time frame and price is no longer above its main short-term moving averages while still above its main long-term ones, on the DMI (Directional Movement Index) front the +DI still over the -DI but by one calculation not enough to label it as positive, an RSI (Relative Strength Index) falling out of overbought territory at the start of this week, and an ADX (Average Directional Movement Index) reading still in a zone seen as ‘trending’ territory. We’re roughly 1% off Monday’s record close, and in all its technical overview remains ‘bull average’ meaning added caution on any purchase for conformist buy strategies off the 1st Support level only doing so after a significant reversal avoiding getting stopped out on any initial move lower, and especially if we’re in for a move to the middle or lower end of the Bollinger Band. Those who see a clearer pullback fall into the contrarian camp have sell strategies to work with, whether selling off the 1st Resistance via reversal or with a breakout off the 1st Support.
Zooming out to the weekly time frame and the technical overview was and remains an identical ‘bull average’, with the indicators carrying more historic bullish bias, the RSI just shy of overbought territory and price still near the upper end of the weekly Bollinger Band. There hasn’t been much of a big move so far this week to get prices close to either of the wider weekly 1st levels, but conformist and contrarian strategies are identical to the daily time frame given matching technical overviews.
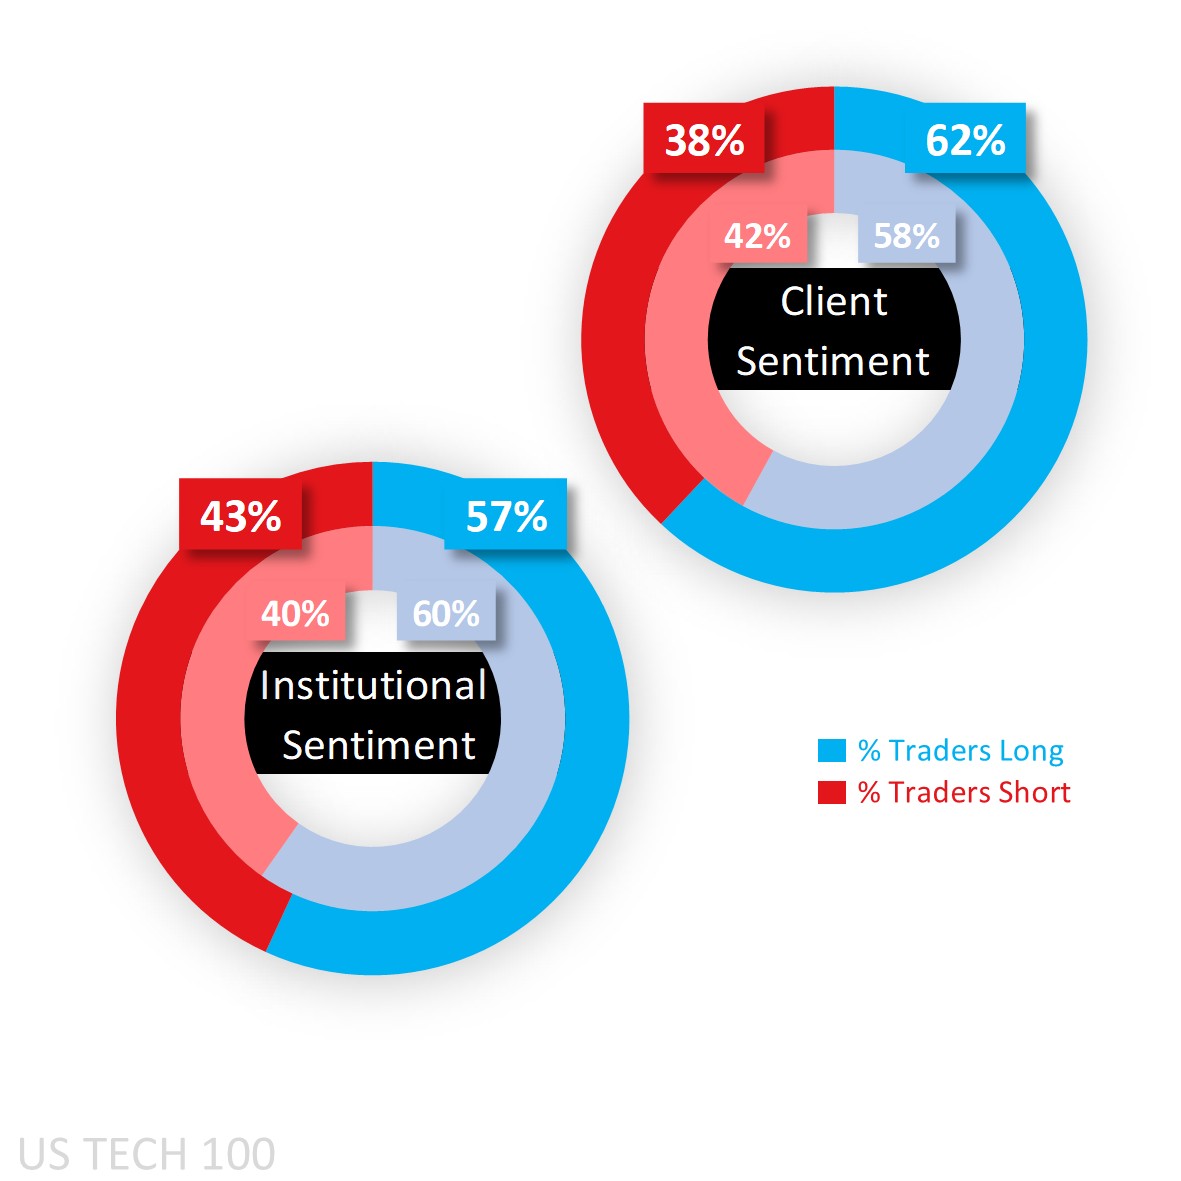
Capital.com’s client sentiment for Nasdaq 100
Client sentiment remains majority long in the tech-heavy Nasdaq 100, but they shifted recently from what was a majority short bias as the pullback in price off the record high set at the start of this week gave a chance for fresh shorts to close out and some longs to initiate at the short-term support level. The consecutive pullback yesterday took the majority buy sentiment from 58% to 62%.
As for CoT speculators (according to the CFTC’s Commitment of Traders report), they remain net long but in the latest report reduced that bias from 60% to 57% on an increase in shorts (+8,800 lots) outdoing the smaller increase in longs (by 1,876). Looking at the other main US equity indices and CoT speculators there are an opposite net short and rising in the S&P 500 (sell 67%), Dow 30 (even heavier sell at 71%), and Russell 2000 (heaviest at 73%).
Client sentiment mapped on the daily chart
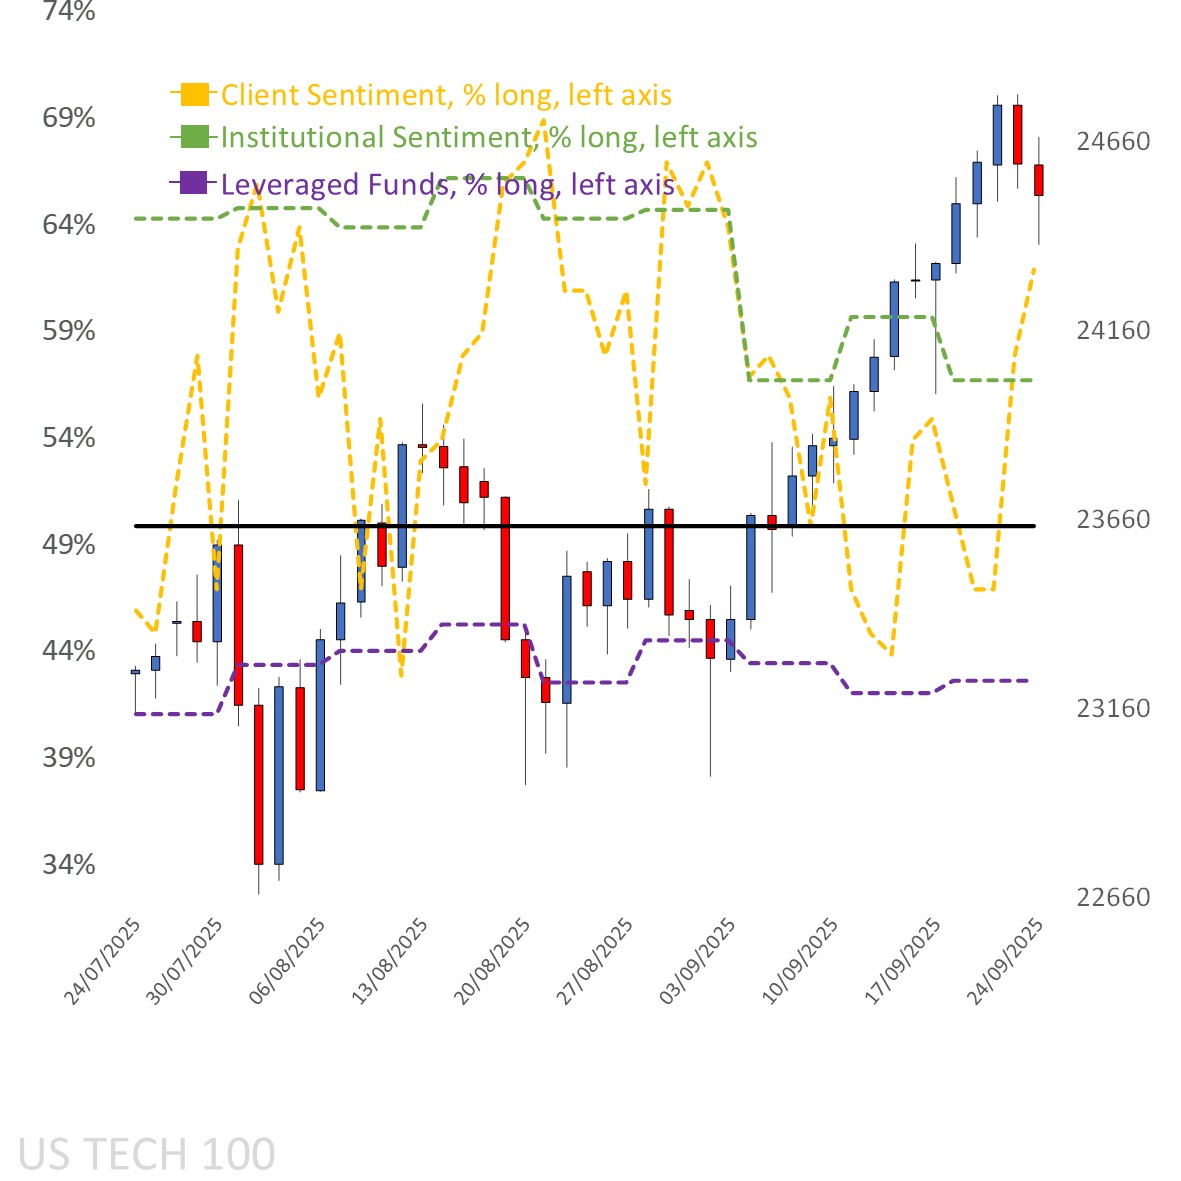
Source: Capital.com
Period: JULY 2025 – SEPTEMBER 2025
Past performance is not an indicator of future results.
Nasdaq 100’s chart on Capital.com platform with key technical indicators
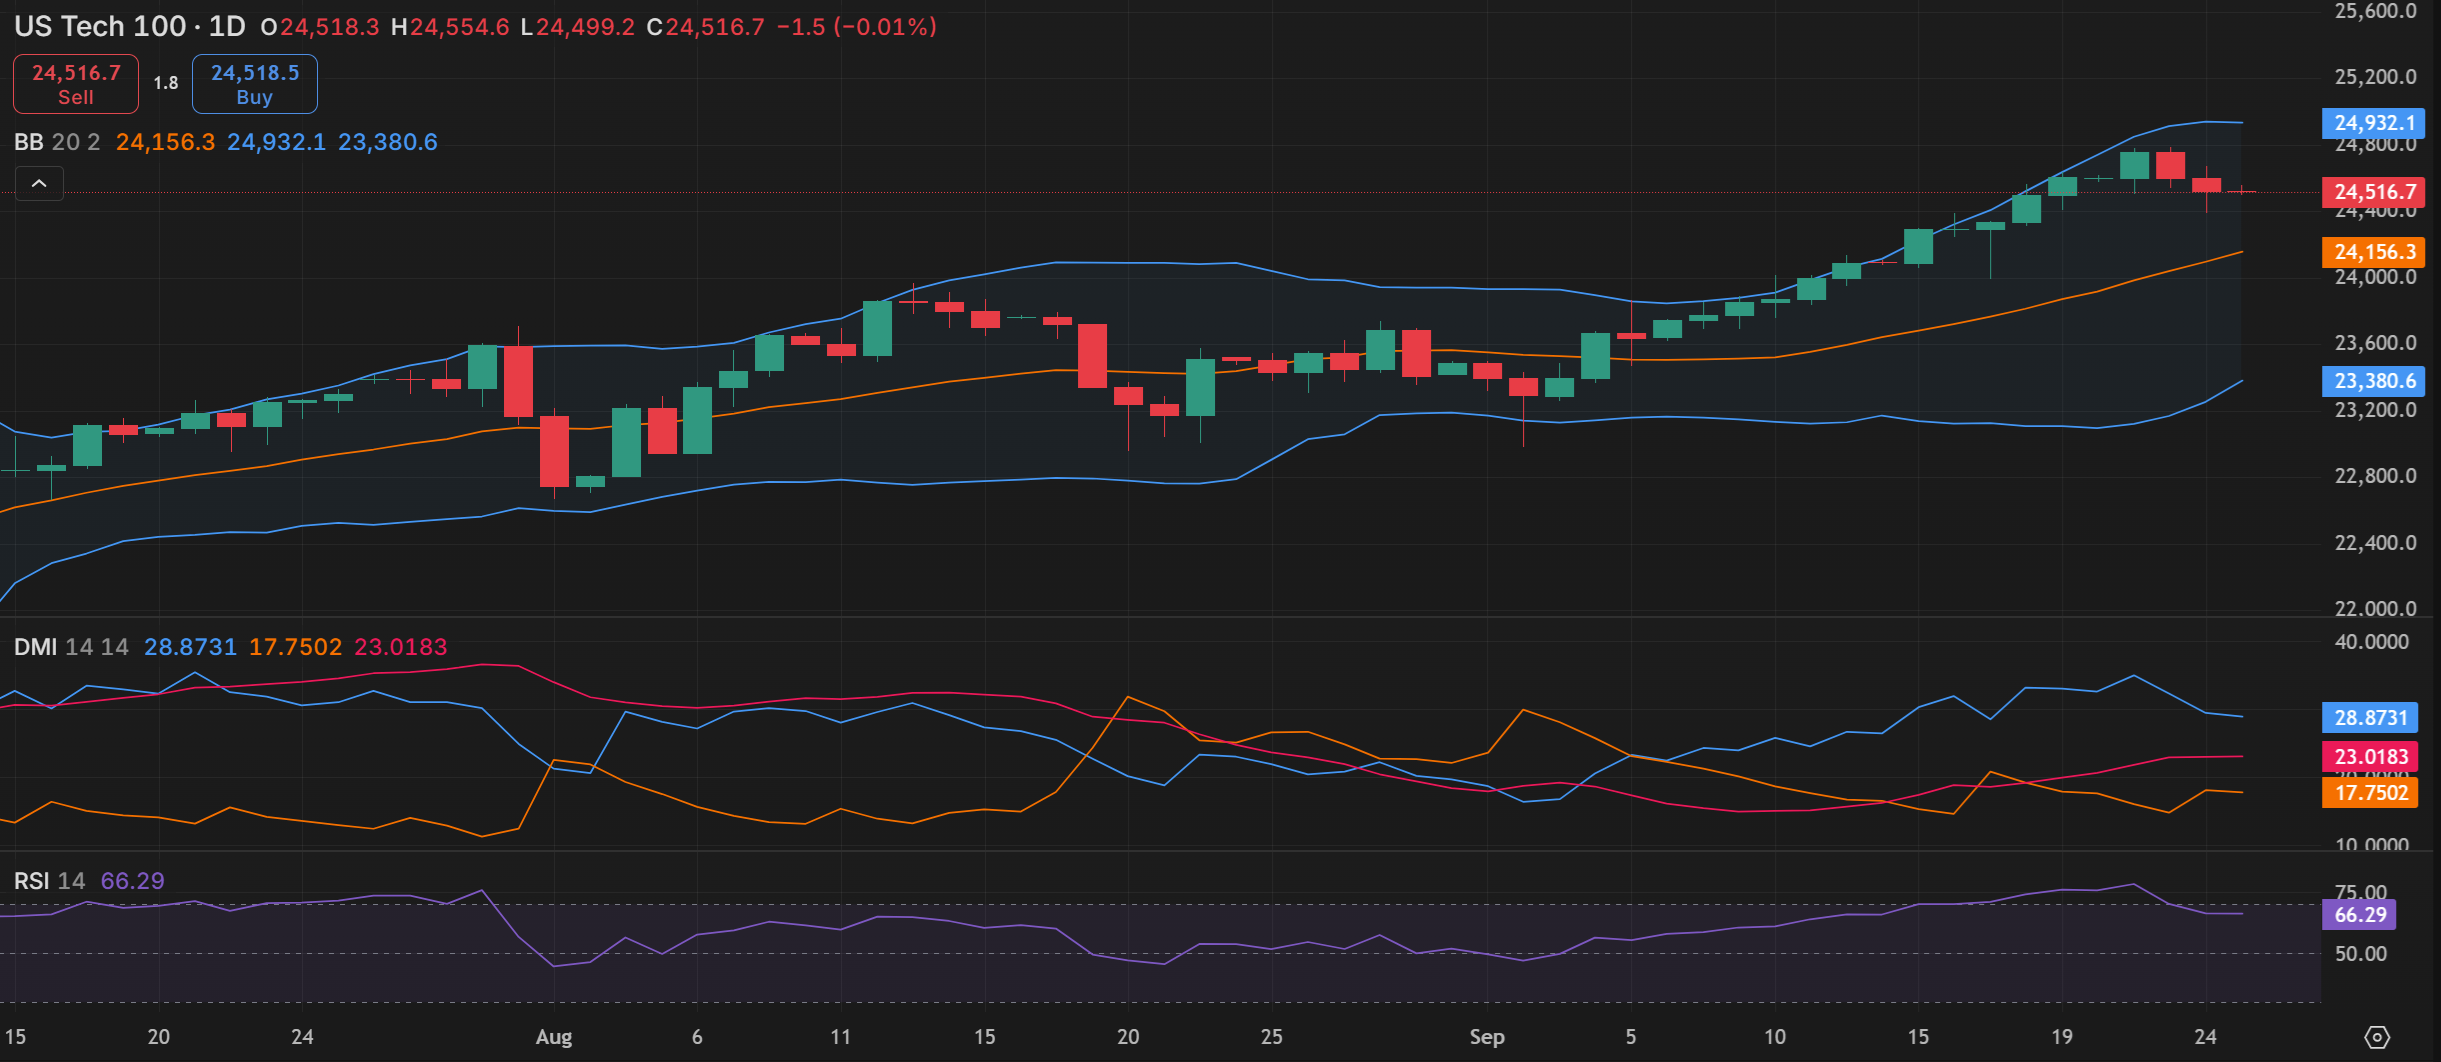
Source: Capital.com
Period: JULY 2025 – SEPTEMBER 2025
Past performance is not an indicator of future results.