Trading the Nasdaq 100 on Reopening Progress
Optimistic start for markets following the fundamental updates, though the technical overview remains unchanged in both time frames while trader sentiment is majority long.
U.S. equity index futures are in for a climb supported by advances in the Senate of the government funding bill as they attempt to end the longest shutdown in the country’s history, as well as China suspending some critical mineral export curbs to the U.S. an added positive on the trade front between the two economic behemoths. It follows a week of losses for the Dow 30 (w/w -1.5% to 46,987), S&P 500 (w/w -2.2% to 6,728) and more so the tech-heavy Nasdaq 100 (w/w -4% to 25,059) as the AI trade took a hit. On Friday, shares of heaviest Nvidia finished not far off where they started in what was a calmer day for most semiconductors though rival AMD (-1.8) fell a bit, and a notable beneficiary Intel (+2.4%) following news regarding a potential Tesla (-3.7%) partnership.
In terms of economic data, the standpoint was UoM’s (University of Michigan) preliminary consumer sentiment worsening to 50.3 and at disturbing lows, while inflation expectations among them were mixed with the one-year rising a notch to 4.7% from 4.6% while the five-year fell from 3.9% to 3.6%. The New York Fed’s survey of consumer inflation expectations showed a drop for its one-year print to 3.2% from 3.4% well below UoM’s figures, while held for both three-year (at 3%) and five-year (at 3%).
Treasury yields ended the week lower but are expected to open higher following the latest updates, and market pricing (CME’s FedWatch) via majority still in favor of another 25bp (basis point) rate cut out of the Federal Reserve (Fed) in December to 3.5-3.75% but a minority on any further reduction in January from that range. Speaking of the Fed, we heard from FOMC (Federal Open Market Committee) member Williams that they may need to expand their balance sheet, Jefferson that they still have a lot of data on the economy despite a lack of official reports to make policy and that their decisions will be done meeting by meeting, and Miran that stablecoin demand could help the central bank in lowering interest rates.
Week ahead
As for the week ahead, any end to the government shutdown will mean we can get CPI (Consumer Price Index) readings for the month of October on Thursday and more pricing data on Friday, as well as retail sales. Otherwise, more FOMC members speaking, bond/note/bill auctions, and the weekly energy figures out of API, EIA, and Baker Hughes though add to it the monthly oil market reports out of OPEC, IEA, and EIA. In earnings, notable ones include Disney, Merck, Cisco and Softbank all releasing their quarterly figures this week.
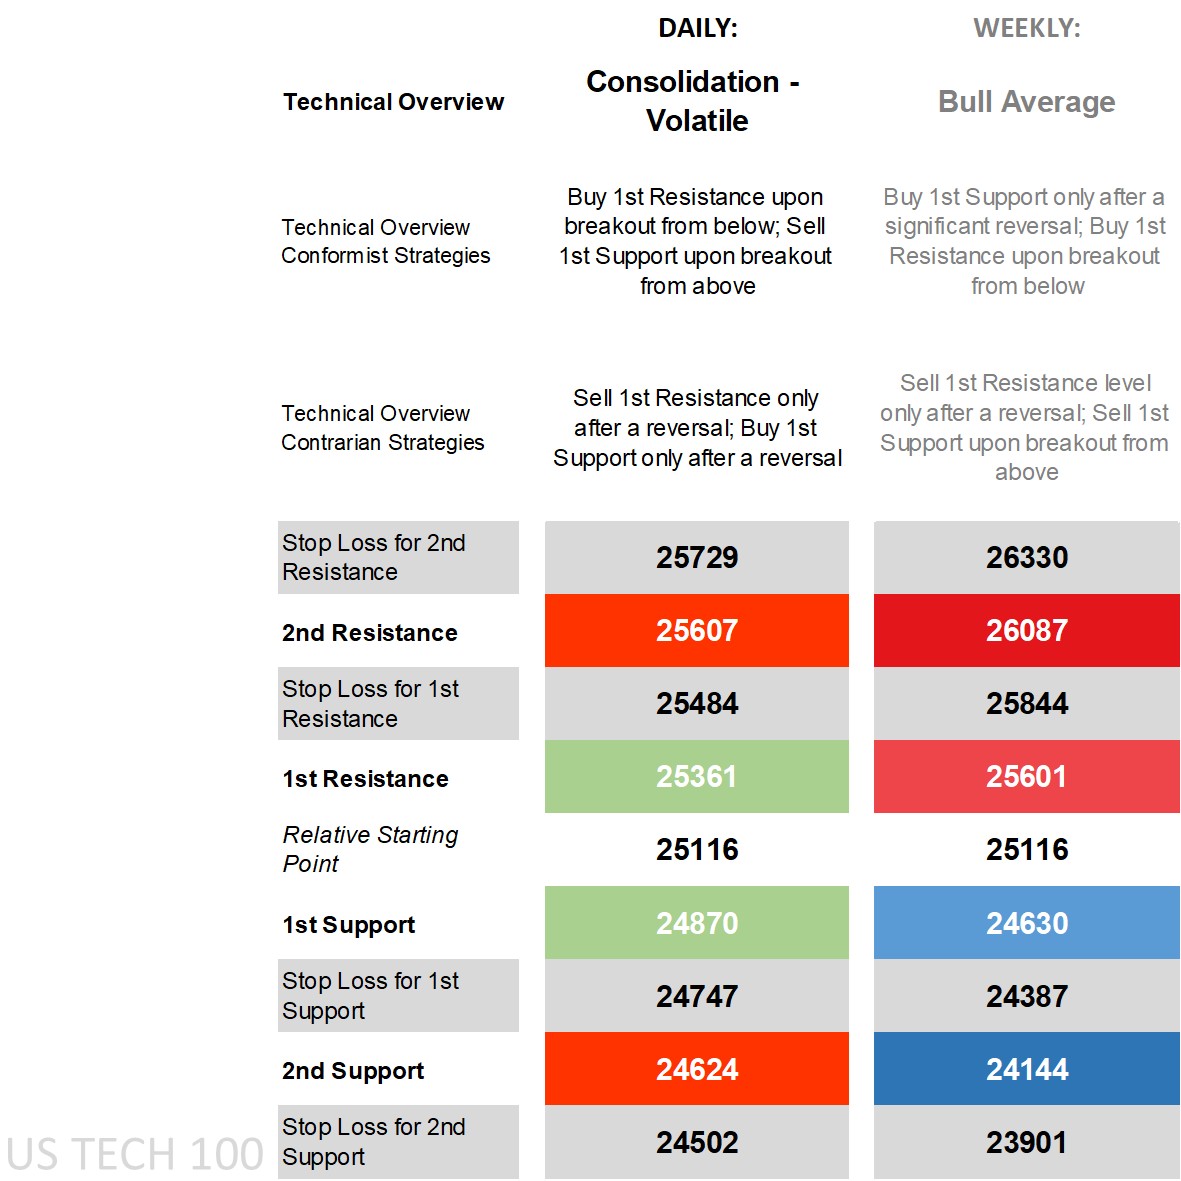
Nasdaq 100’s technical overview, strategies and levels
Looking at the daily time frame and price by last week’s close was below its main short-term moving averages (MA) while still above its main long-term ones, on the DMI (Directional Movement Index) front the -DI over the +DI enough to classify it as negative, an RSI (Relative Strength Index) near the middle, and an ADX (Average Directional Movement Index) still below trending territory. Classifying the overview is tricky at this stage given the mixed indicators and what is still a bullish overview on the weekly time frame owing to more historic bullish bias.
Any further attention on the AI trade and any significant shifts in key valuations usually hits this tech-heavy index more than say the S&P 500 or Dow, and a wide channel making the technical overview more ‘consolidation – volatile’ where daily 1st levels may struggle to hold at least in the shorter term giving conformist breakout strategies the initial edge even if eventually it may revert back meaning contrarian reversal strategies can’t be ruled out provided they aren’t stopped out on any initial move beyond the 1st levels. Price has already made a move beyond today’s 1st Resistance level thanks to the fundamental updates.
Zooming out to the weekly time frame and a ‘bull average’ technical overview puts buy strategies in the conformist camp for those who see an eventual resumption in its climb, though buying off any pullbacks ideally done only after a significant reversal to avoid getting stopped out when there’s an uptick in volatility, with last week’s Weekly 1st Support level only eventual holding with an initial move to its 2nd Support holding before the recovery off the intraweek lows. Those who expect a larger pullback in the AI and tech trade fall into the contrarian camp, meaning selling off the weekly 1st Resistance via reversal or off the weekly 1st Support via breakout.
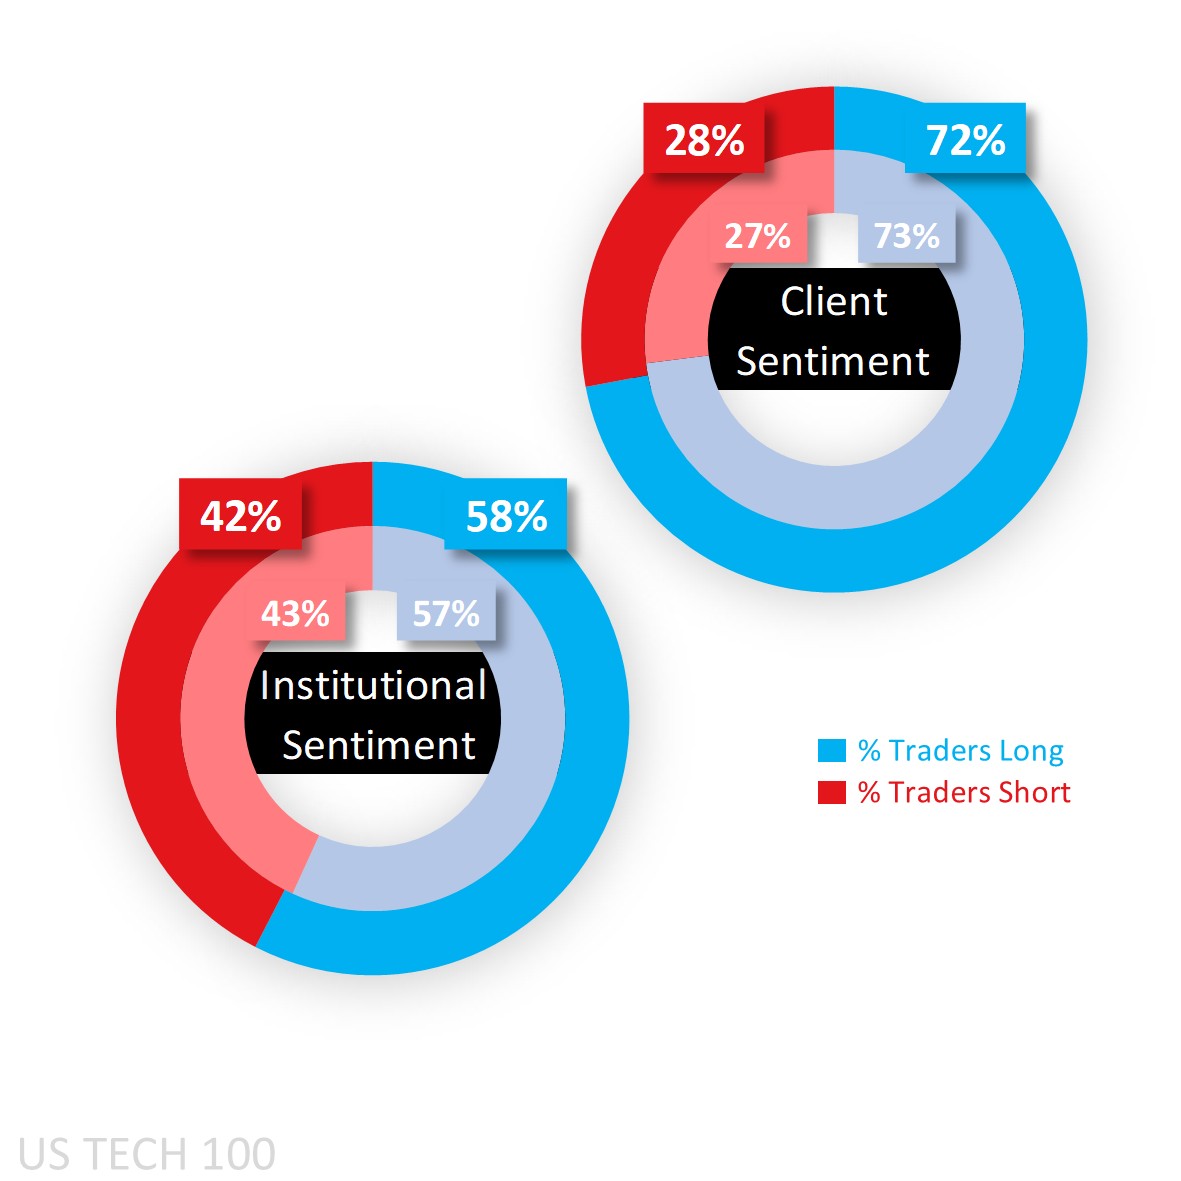
Capital.com’s client sentiment for Nasdaq 100
When it comes to client sentiment in key U.S. equity indices, they’ve reached extreme buy in the S&P 500 (81%) and Russell 2000 (79%) as the pullback in price by last week’s close saw fresh shorts close out and longs initiate, with a similar story playing out in the Dow and Nasdaq (both a heavy 72% at the start of this week). The government shutdown has meant an absence of figures from the CFTC and so we’ve been stuck with the September figures that show CoT (Commitment of Traders) speculators net long 58%, but a reopening means those figures will be updated as they process the backlog of information and will be reflected in future articles.
Client sentiment mapped on the daily chart
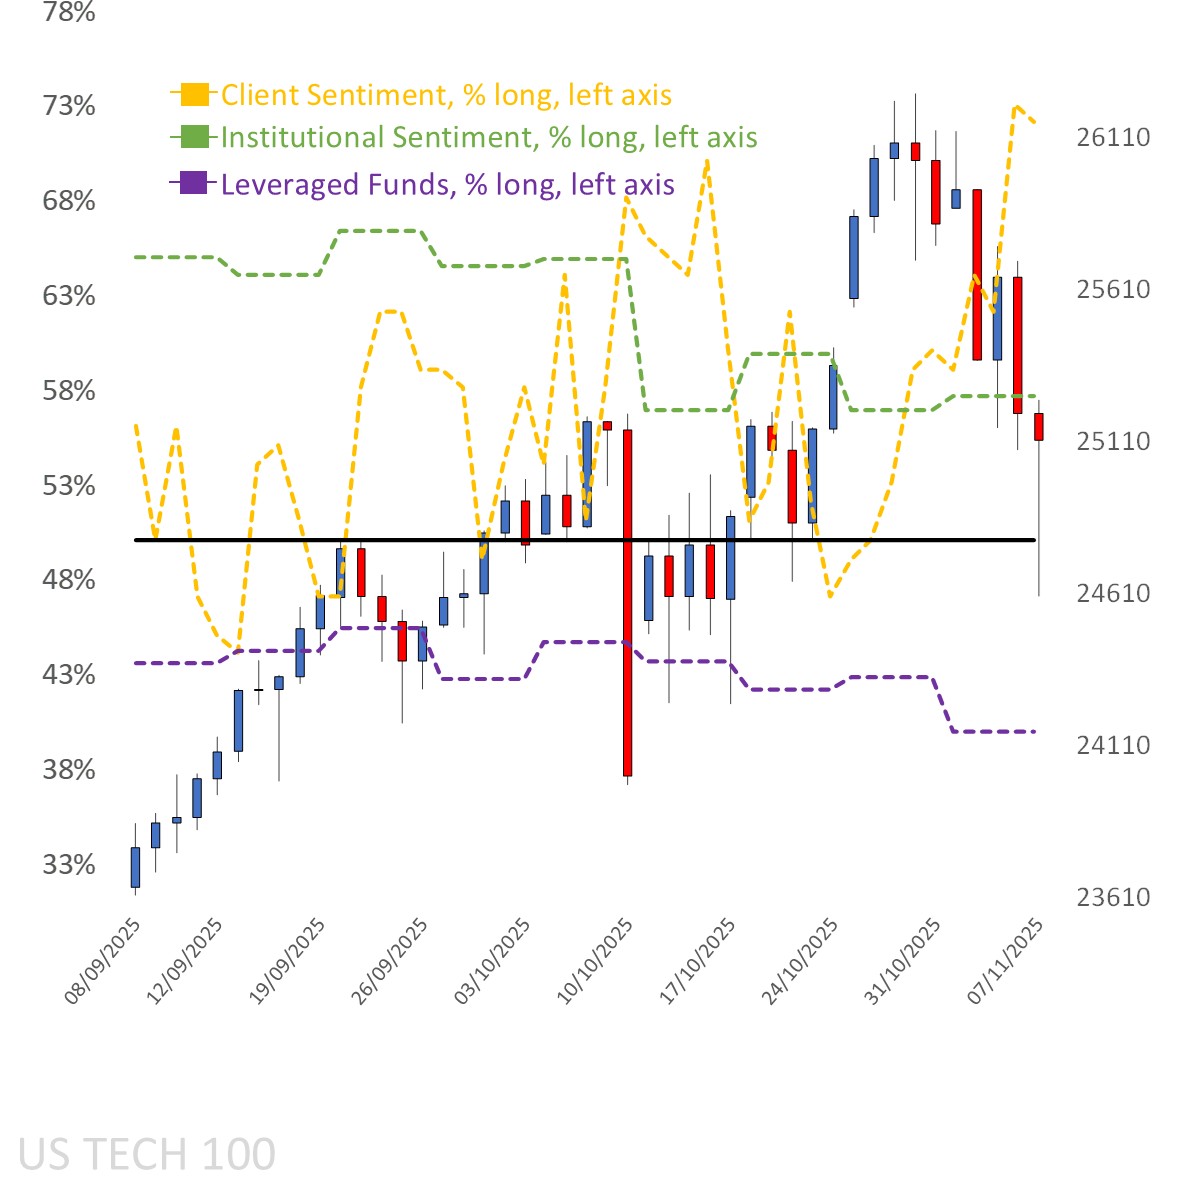 Source: Capital.com
Period: SEPTEMBER 2025 – NOVEMBER 2025
Past performance is not an indicator of future results.
Nasdaq 100’s chart on Capital.com’s platform with key technical indicators
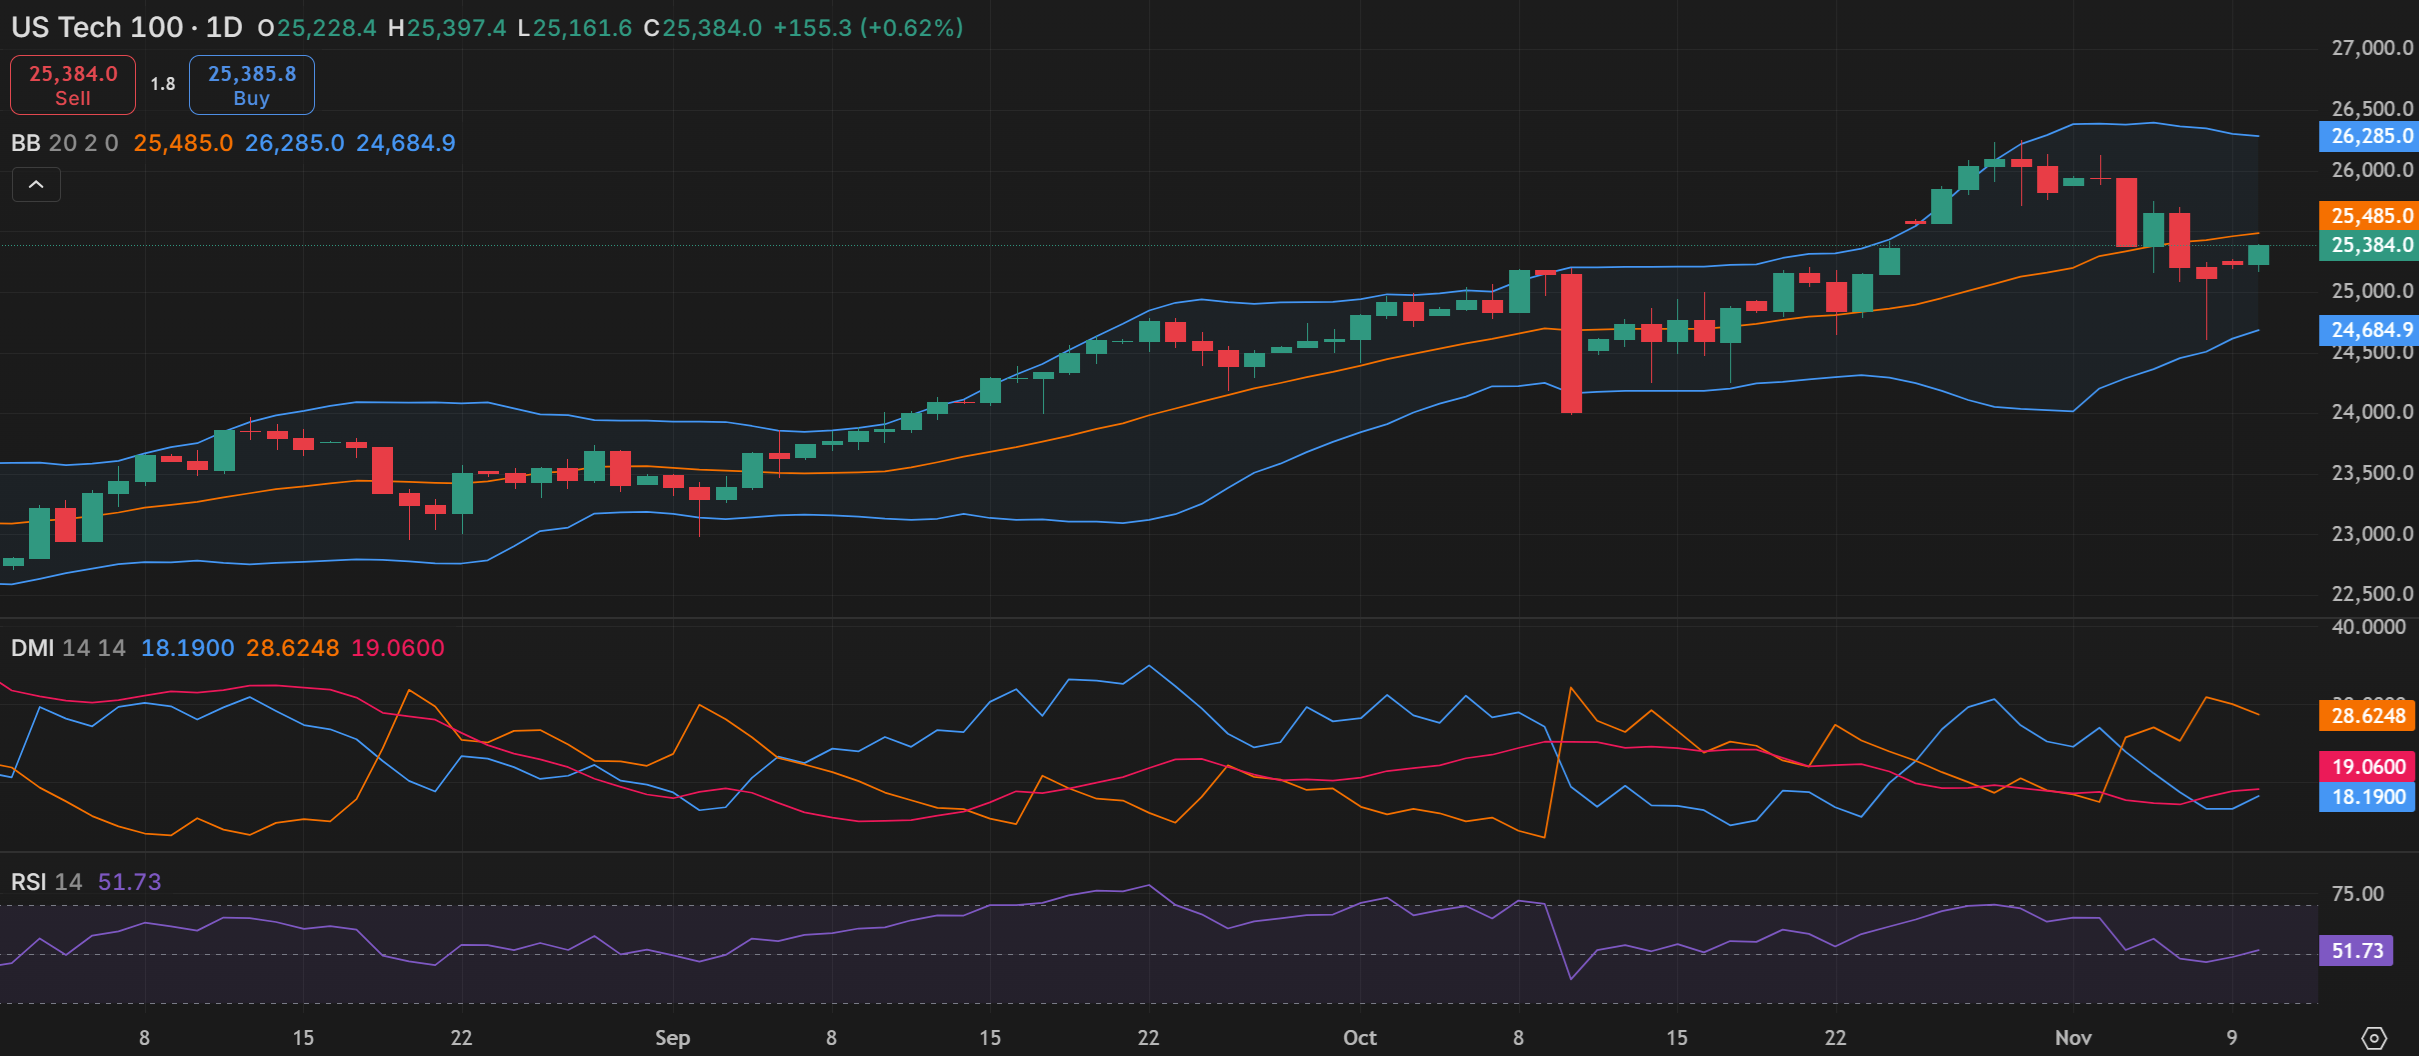
Source: Capital.com
Period: AUGUST 2025 – NOVEMBER 2025
Past performance is not an indicator of future results.