Trading the Nasdaq 100 Over 24,000
Another milestone for the tech-heavy index helps keep the technical overview bullish, but in sentiment it’s a story of opposing bias when it comes to CoT speculators and Capital.com’s clients.
US equity index futures are generally steady this morning after a week that saw record highs for the S&P 500 (w/w +1.3% to 6,584 and intraweek nearly touched 6,600), Nasdaq 100 (w/w +1.4% to 24,092) and Dow 30 (w/w +0.9% to 45,834 breaching 46K intraweek). Market participants had to contend with pricing data that remained hot though still relatively contained with worsening labor data as the weekly initial claims jumped to uncomfortable levels, raising hopes that weakness in the labor market would force the Federal Reserve (Fed) into cutting rates even in the face of above-target inflation moving away from their goal.
The bond market seemed to back that narrative, with Treasury yields ending the week lower on the further end of the curve with the 10-year briefly breaking beneath 4% and strong demand from its consecutive auctions. Market pricing (CME’s FedWatch) sees three 25bp (basis point) consecutive cuts but not fully priced in for October and December.
There wasn’t as much data to digest out of the US last Friday but UoM’s preliminary figures showed consumer sentiment drop to 55.4 worse than anticipated (vs 58 forecast) and so too expectations (51.8 vs 54.9), with inflation expectations still at unbefitting levels (1Y holding at 4.8% while the 5Y rose from 3.5% to 3.9%).
For tech stocks, the big rally that took the attention last week was that of Oracle despite its earnings miss as investors looked to its cloud growth and stellar guidance, while among the magnificent seven it was Tesla enjoying double-digit percentage gains.
Week ahead
As for the week ahead, it starts off somewhat light today with the focus on ongoing US-China talks and Miran’s potential confirmation as Fed governor before picking up quickly with retail sales on Tuesday expected to show ongoing m/m (month-on-month) growth. The attention will then shift to the much-anticipated FOMC (Federal Open Market Committee) decision where they are expected to cut by 25bp and a tiny minority (CME’s FedWatch) gunning for a larger 50bp reduction. The weekly claims will be on Thursday after its recent miss.
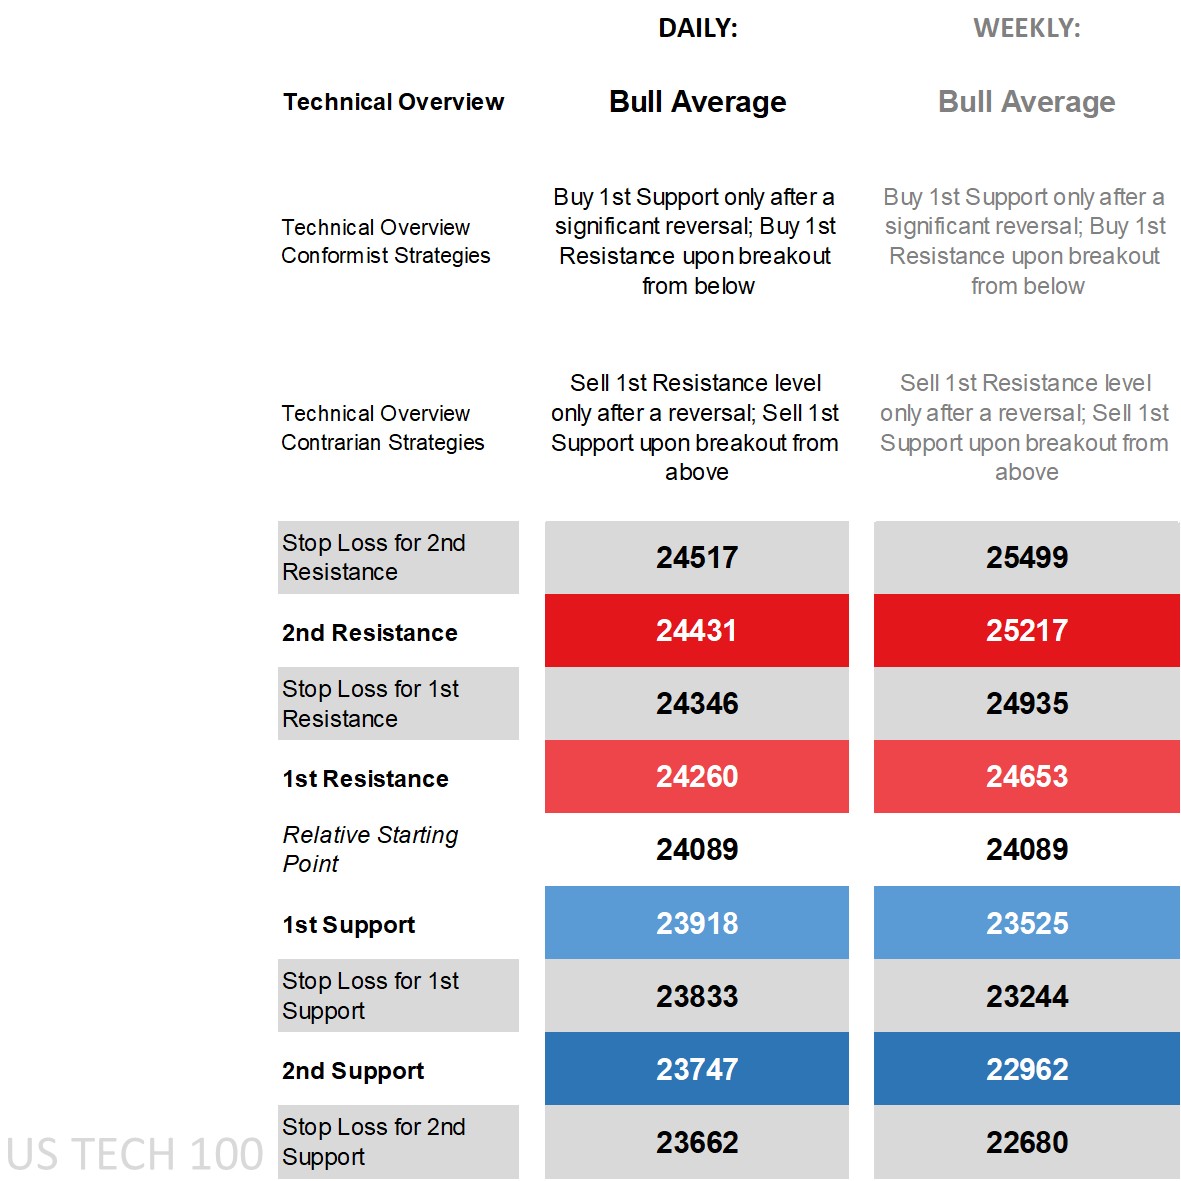
Nasdaq 100’s technical overview, strategies and levels
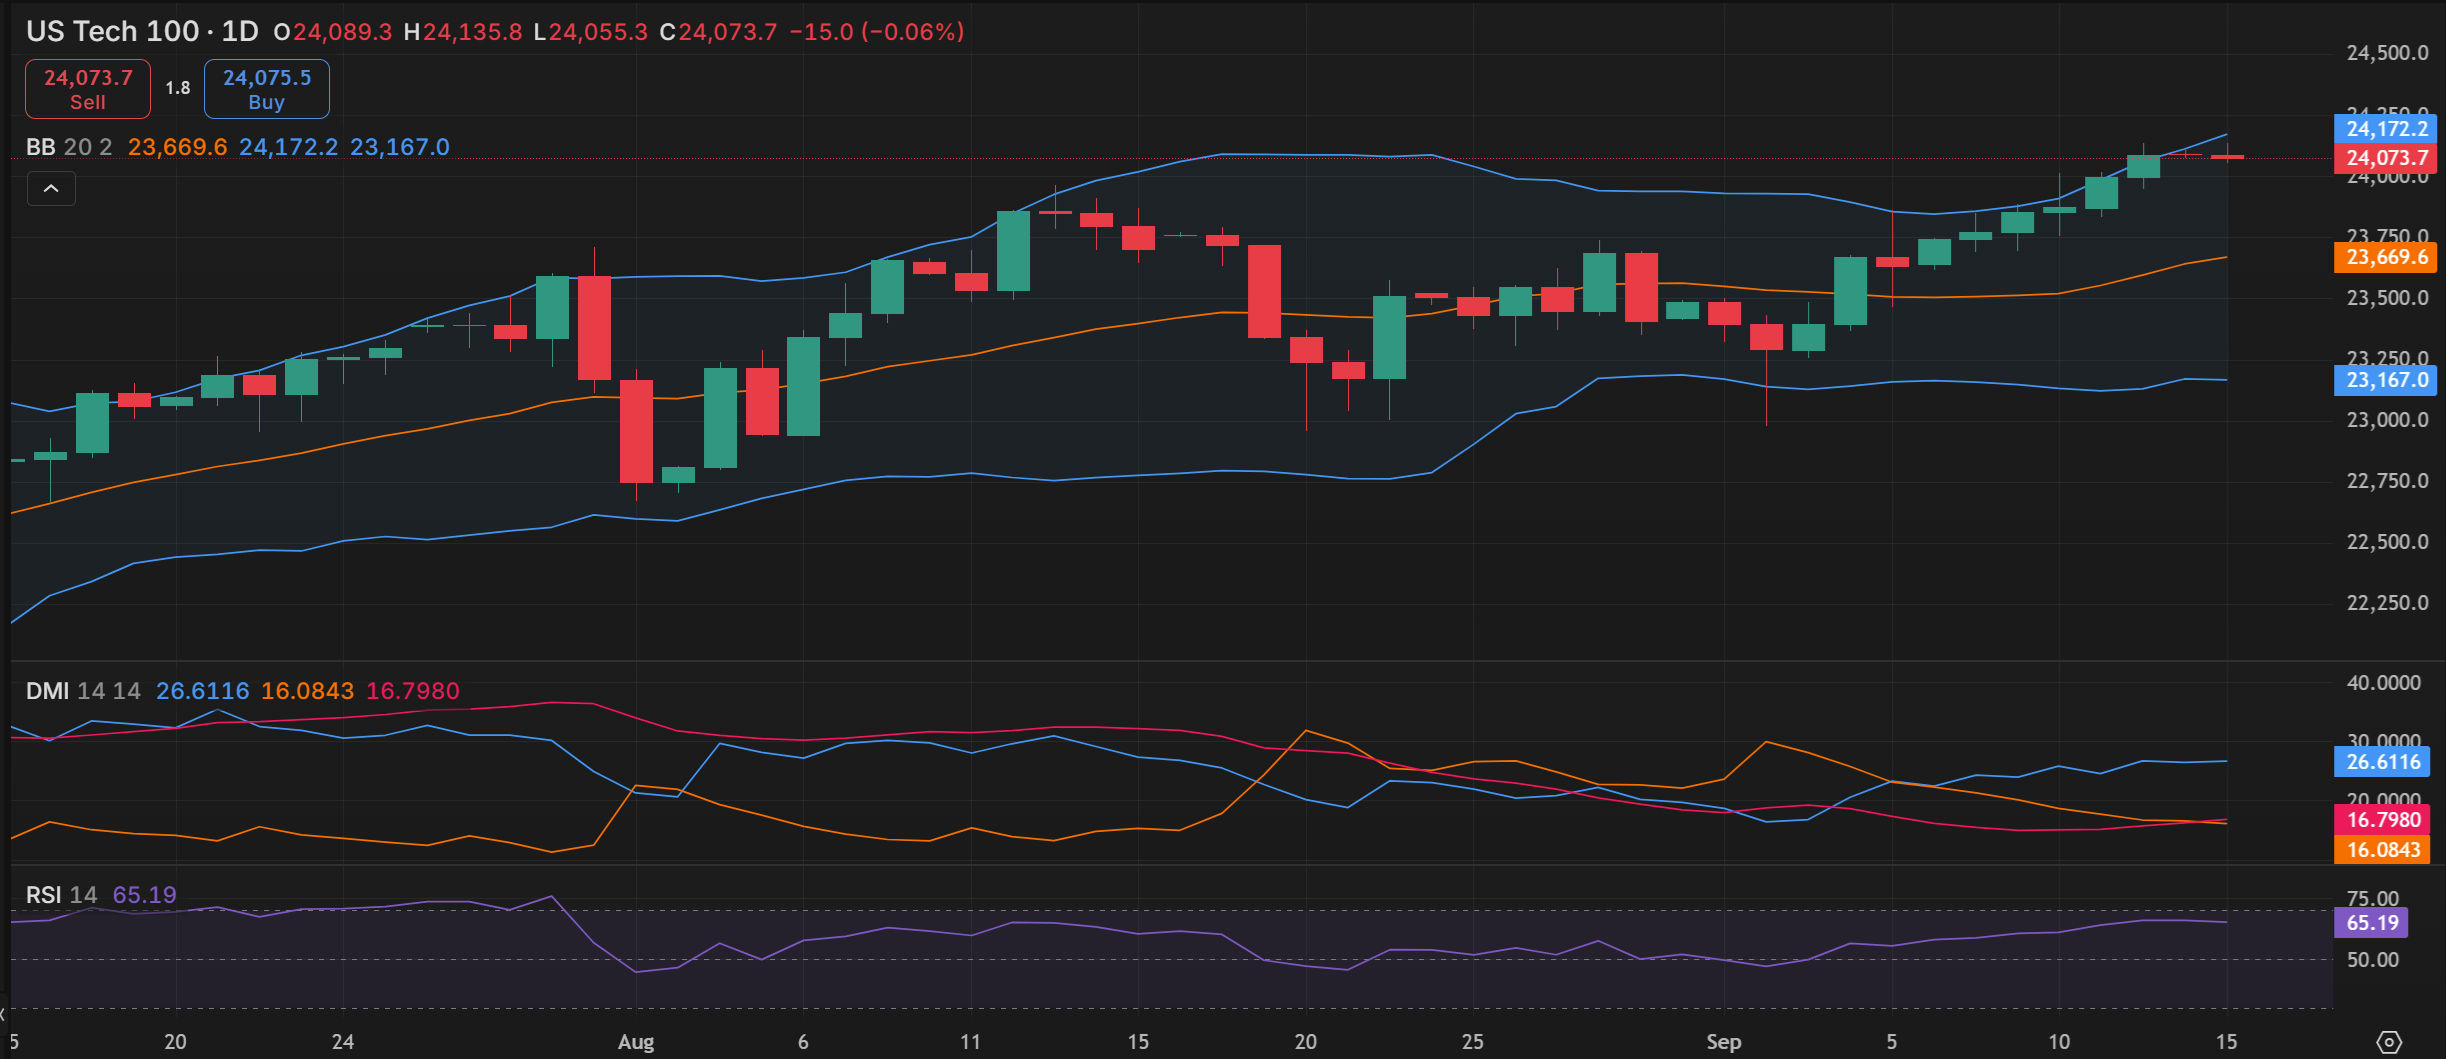
Looking at the daily time frame and price is above all its main moving averages (MA) briefly walking the upper end of the Bollinger Band, on the DMI (Directional Movement Index) front the +DI over the -DI nearly enough to label it as positive, an RSI (Relative Strength Index) edging closer to overbought territory, and an ADX (Average Directional Movement Index) avoiding trending territory.
That, combined with the recent record high has been enough to keep its technical overview as ‘bull average’ where buy strategies are in the conformist camp but with added caution buying off the 1st Support level doing so only after a significant reversal and avoiding any fading strategies that will be prone to being stopped out and more so if there is a move to the lower end of its wide bull channel and/or should the upper band hold.
To those who see the latest moves as exhaustive fall into the contrarian camp and in turn have sell-strategies to contend with either after a reversal off the 1st Resistance or with a breakout off the 1st Support.
The weekly time frame also matches the daily when it comes to the technical overview and incorporates more historic bullish bias, in all translating into identical strategies on the conformist/contrarian fronts but working with wider levels due to the longer-term time frame.
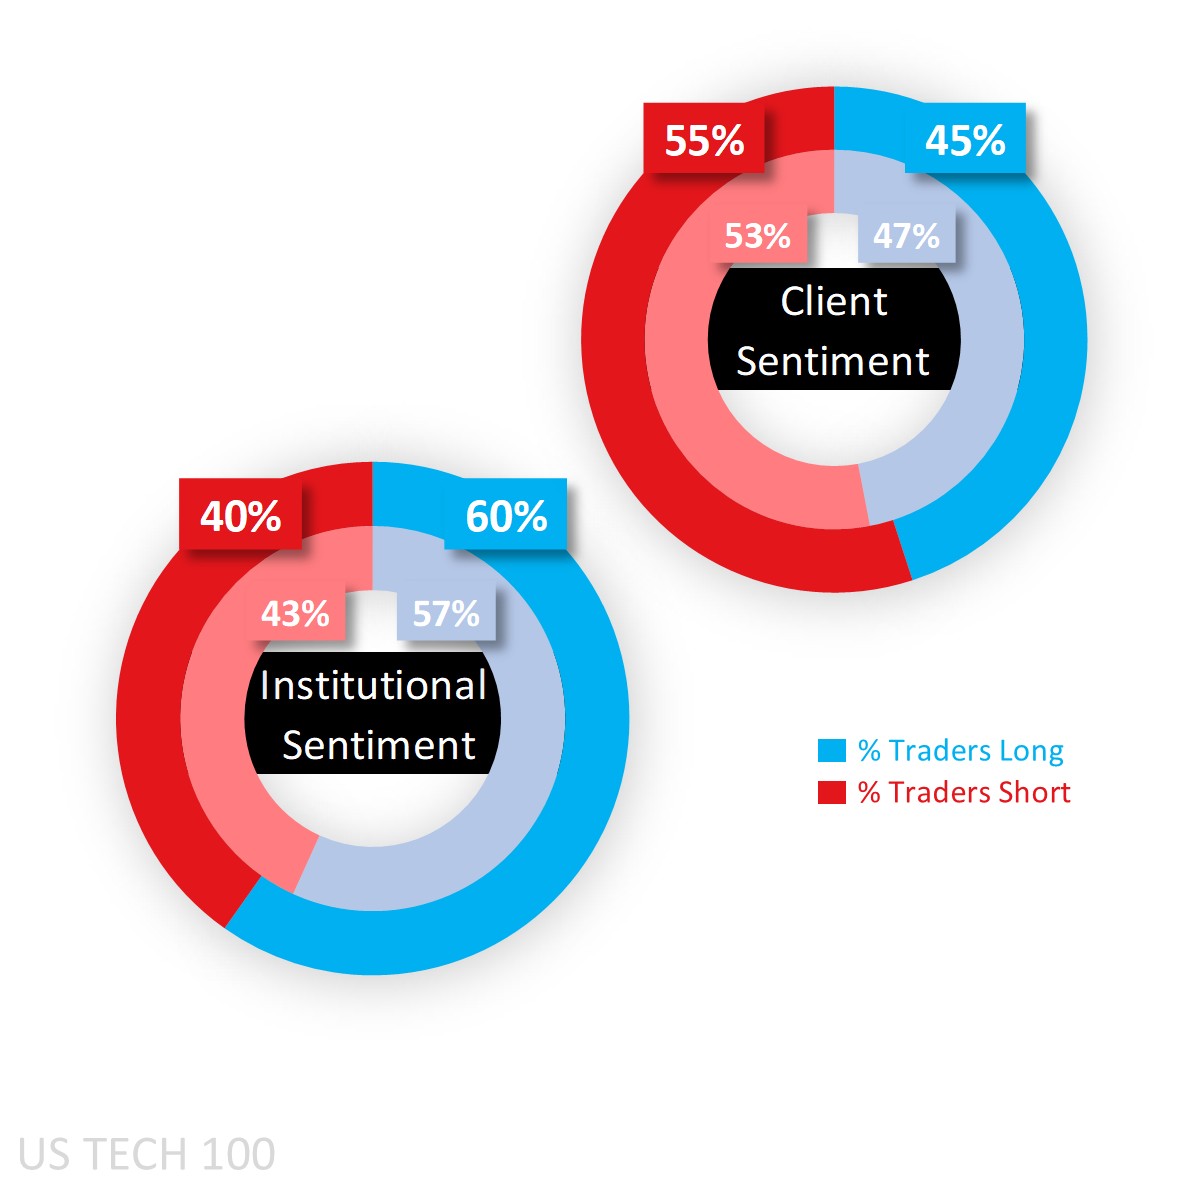
Capital.com’s client sentiment for Nasdaq 100
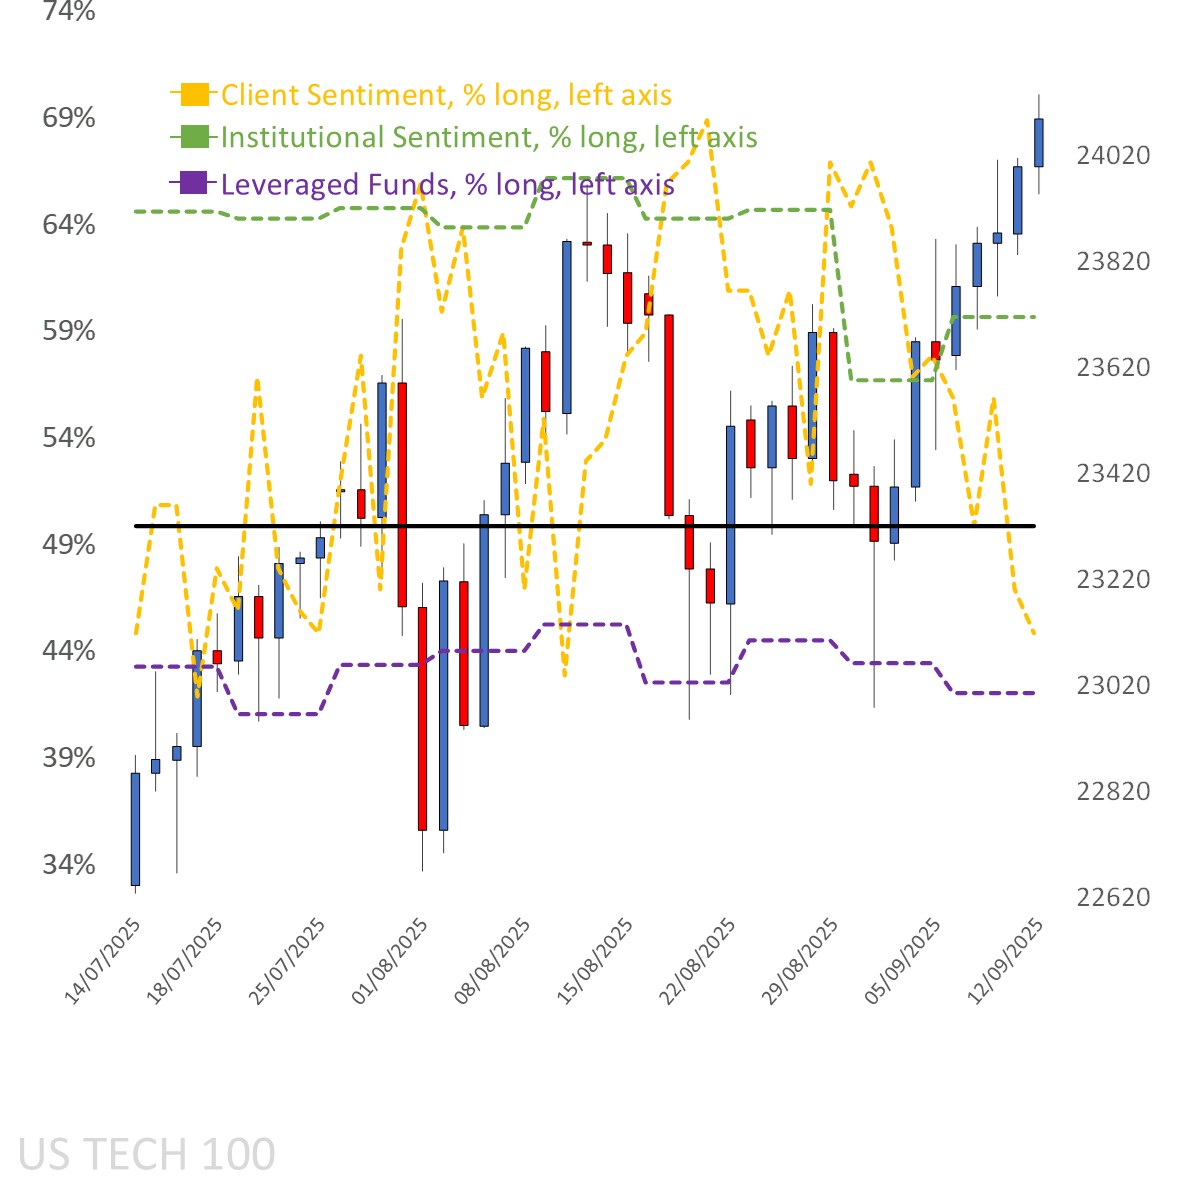
Client sentiment recently shifted from majority long 58% last Monday to majority short as seen on the chart below where it is mapped on price via the yellow-dotted line. Price gains usually result in longs taking profit and shorts initiating, and goes to show not all traders are buying into the latest rally.
CoT (Commitment of Traders) speculators were and remain net long raising their bias from a majority buy 57% to 60% according to the latest report out of the CFTC, due to an increase in long positions (by 8,920 lots) combined with a simultaneous reduction in shorts (by 731).
Client sentiment mapped on the daily chart
 Source: Capital.com
Period: JULY 2025 – SEPTEMBER 2025
Past performance is not an indicator of future results.
Nasdaq 100’s chart on Capital.com platform with key technical indicators
 Source: Capital.com
Period: JULY 2025 – SEPTEMBER 2025
Past performance is not an indicator of future results.