Trading Nasdaq 100’s fresh record high
Progress on the trade front, easing geopolitical tensions, and ‘revenge tax’ removed sees risk appetite improve.
A week of record highs for the S&P 500 (w/w +3.4% to 6,173) and Nasdaq 100 (w/w +4.2% to 22,534), and if today goes according to plan with futures edging higher would translate into a month of notable gains. It’s been a volatile first half of the year, but market optimists are hoping a few items will keep sentiment positive in the second half. Factors that contributed to improved risk appetite include the US-China trade framework confirmed late last week, the administration expecting trade deals with 10 major trading partners soon, geopolitical tensions generally easing, and the ‘big, beautiful bill’ passing an initial hurdle in the Senate without the feared “revenge tax”. For Big Tech, Canada rescinded its digital services tax initially set to be collected today after US President Trump terminated “ALL discussions on Trade with Canada”.
Week ahead
As for the week ahead, there’s plenty to look forward to, but it’ll start off light in the US with Chicago PMI and a couple FOMC (Federal Open Market Committee) members speaking. It picks up quickly with manufacturing PMIs (Purchasing Managers’ Index) tomorrow and a close look at ISM’s (Institute for Supply Management) reading to see if it’ll remain in contracting territory and a worsening stagflationary picture for the sector. Chairman Powell will also be speaking on a panel likely to advocate further caution and patience before cutting rates as has been the case for quite some time now. Jobs data from the employment component of ISM as well as job openings out of JOLTS will also be on offer. Wednesday is when we get ADP’s non-farm estimate before focus shifts to the market-moving Non-Farm Payrolls a day early on Thursday due to Friday’s holiday. Expectations are for growth of about 120K and for the unemployment rate to rise a notch to 4.3%. The weekly claims will also release at the same time, and later that day services PMI to see if it can get back into expansionary territory.
Nasdaq 100’s technical overview, strategies and levels
Looking at the key technical indicators on the daily time frame of the tech-heavy index and price is above all its main moving averages, walking the upper end of the Bollinger Band, a positive DMI (Directional Movement Index) where there’s ample margin between the +DI and -DI, an ADX (Average Directional Movement Index) that only just reached trending territory by one calculation, and an RSI (Relative Strength Index) that’s in overbought territory.
The technical overview? Definitely something positive and recently shifted to ‘bull average’. But that’s on the daily time frame, it’ll need a bit more to shift it on the weekly time frame from the current ‘consolidation – positive bias’ given longer-term technicals aren’t as bullish and less influenced by shorter-term moves.
For the daily time frame’s ‘bull average’ means buy strategies are in the conformist camp while sell strategies are for contrarians. But that doesn’t mean buying immediately off the 1st Support level, as avoiding getting stopped out means doing so only after a significant reversal letting price break beneath it heavily and only initiating on the way back up should it recover. Those who believe we’re in for a pullback or at the very least oscillations at these levels will look to short – after a reversal – off the 1st Resistance level.

Capital.com’s client sentiment for Nasdaq 100
As for sentiment, we got a shift last week among Capital.com’s traders from majority buy to majority short, and the latest reading slight sell 54% at the start of this week.
CoT speculators (from the CFTC’s Commitment of Traders report) are net long and rising taking it from 53% to a moderate 57% due to an increase in longs (by 6,329 lots) and a simultaneous reduction in shorts (by 4,653). Looking at the other key US equity indices in the CoT report and they remain net sell S&P 500 (at 63%) and so too the Russell 2000 (58%) trimming their short bias in both, while reducing their net long bias in the Dow (from 68% to 64%).

Client sentiment mapped on the daily chart

Source: Capital.com
Period: 04.2025 – 06.2025
(Past performance is not an indicator of future results)
Nasdaq 100’s chart on Capital.com platform with key technical indicators
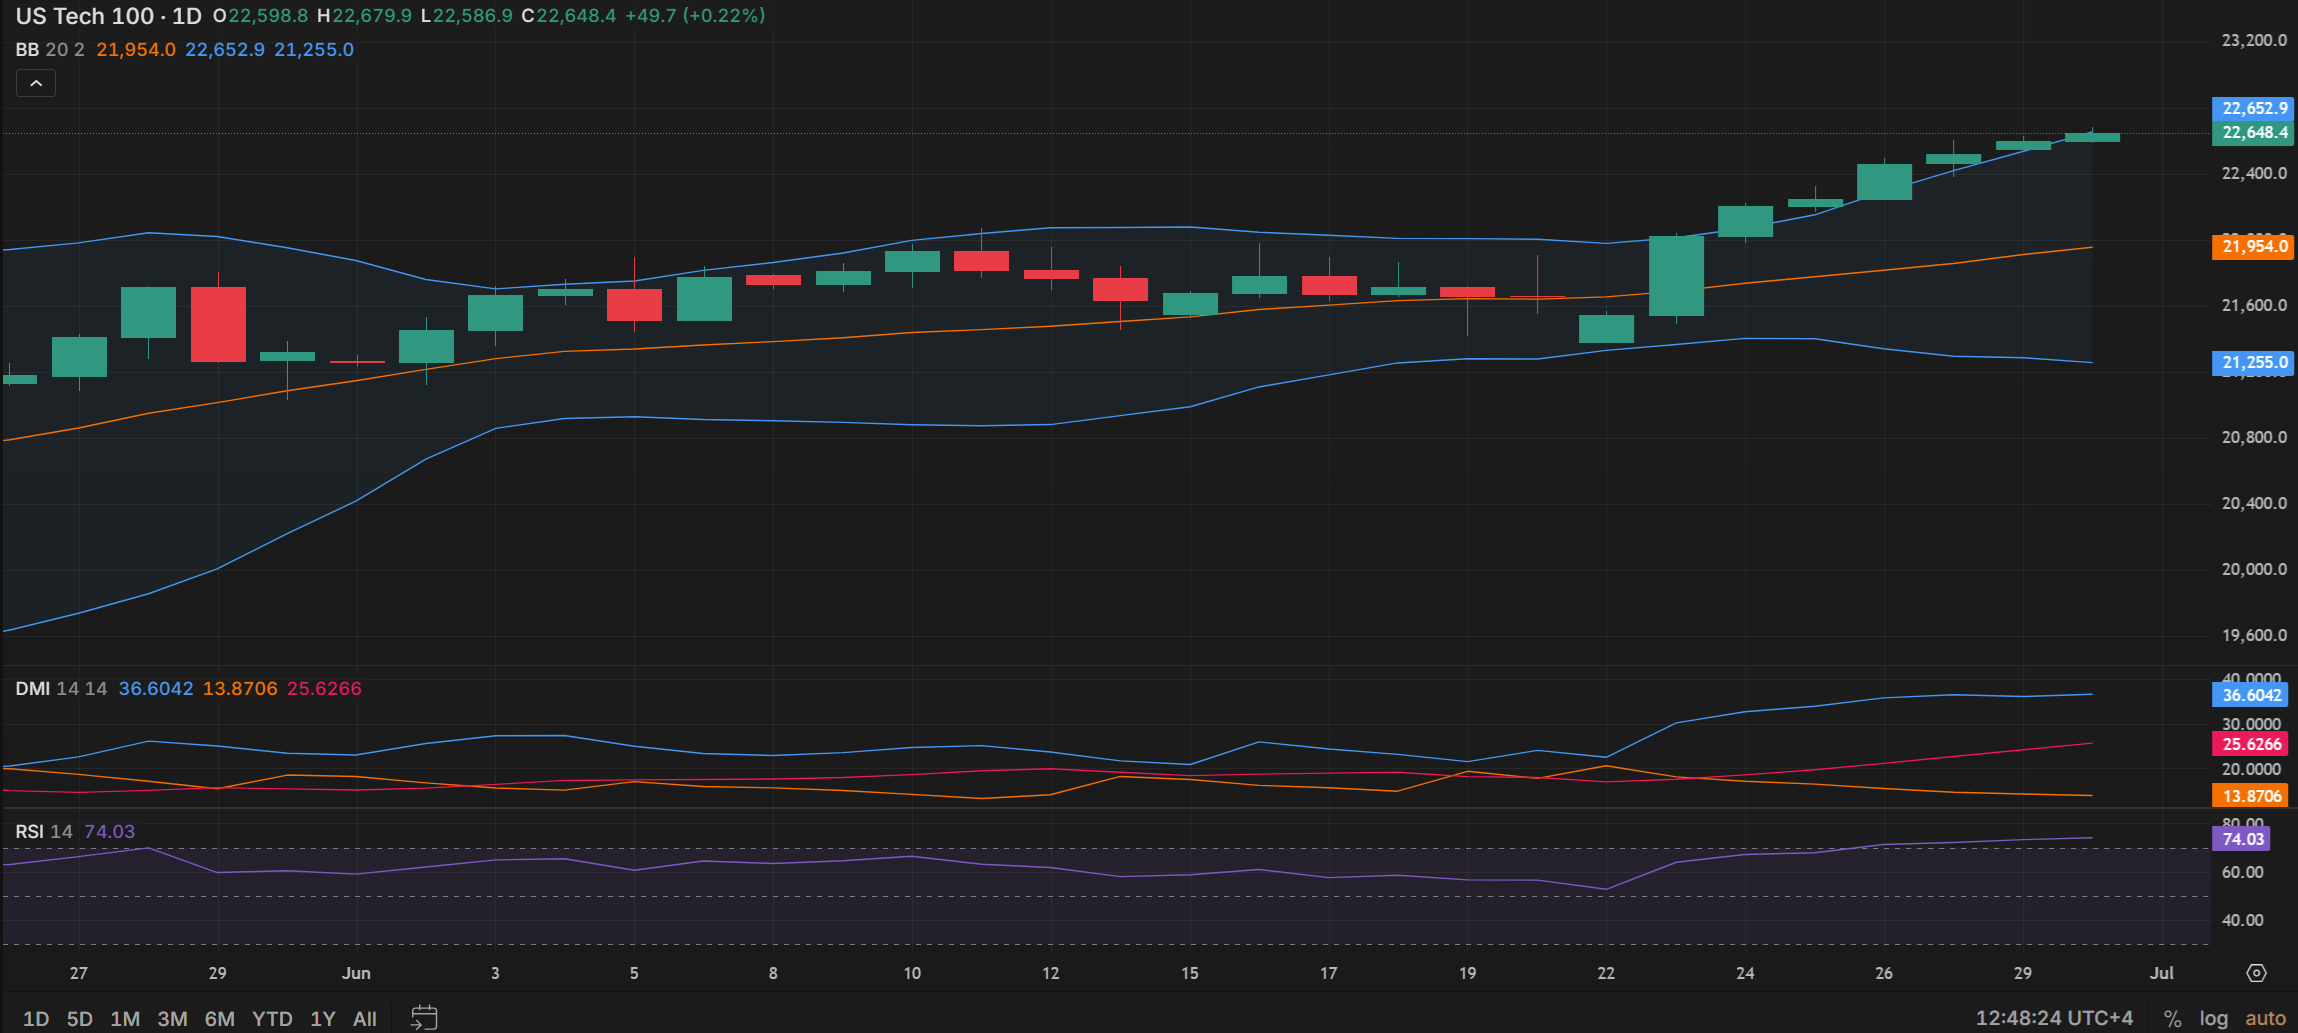
Source: Capital.com
Period: May 2025 – June 2025
(Past performance is not an indicator of future results)