Markets Strain as Liquidity Tightens and Risk Assets Slide
The S&P 500 fell by around 60 basis points on Thursday, 17 October.
The S&P 500 fell by around 60 basis points on Thursday, 17 October. The market appears to be experiencing a significant drain in liquidity, as the overnight Secured Overnight Financing Rate surged to 4.29% — a sign that liquidity conditions are tightening and may be weighing on assets such as stocks as well as Bitcoin. Regional banks also continued to come under tremendous pressure as credit concerns mounted.
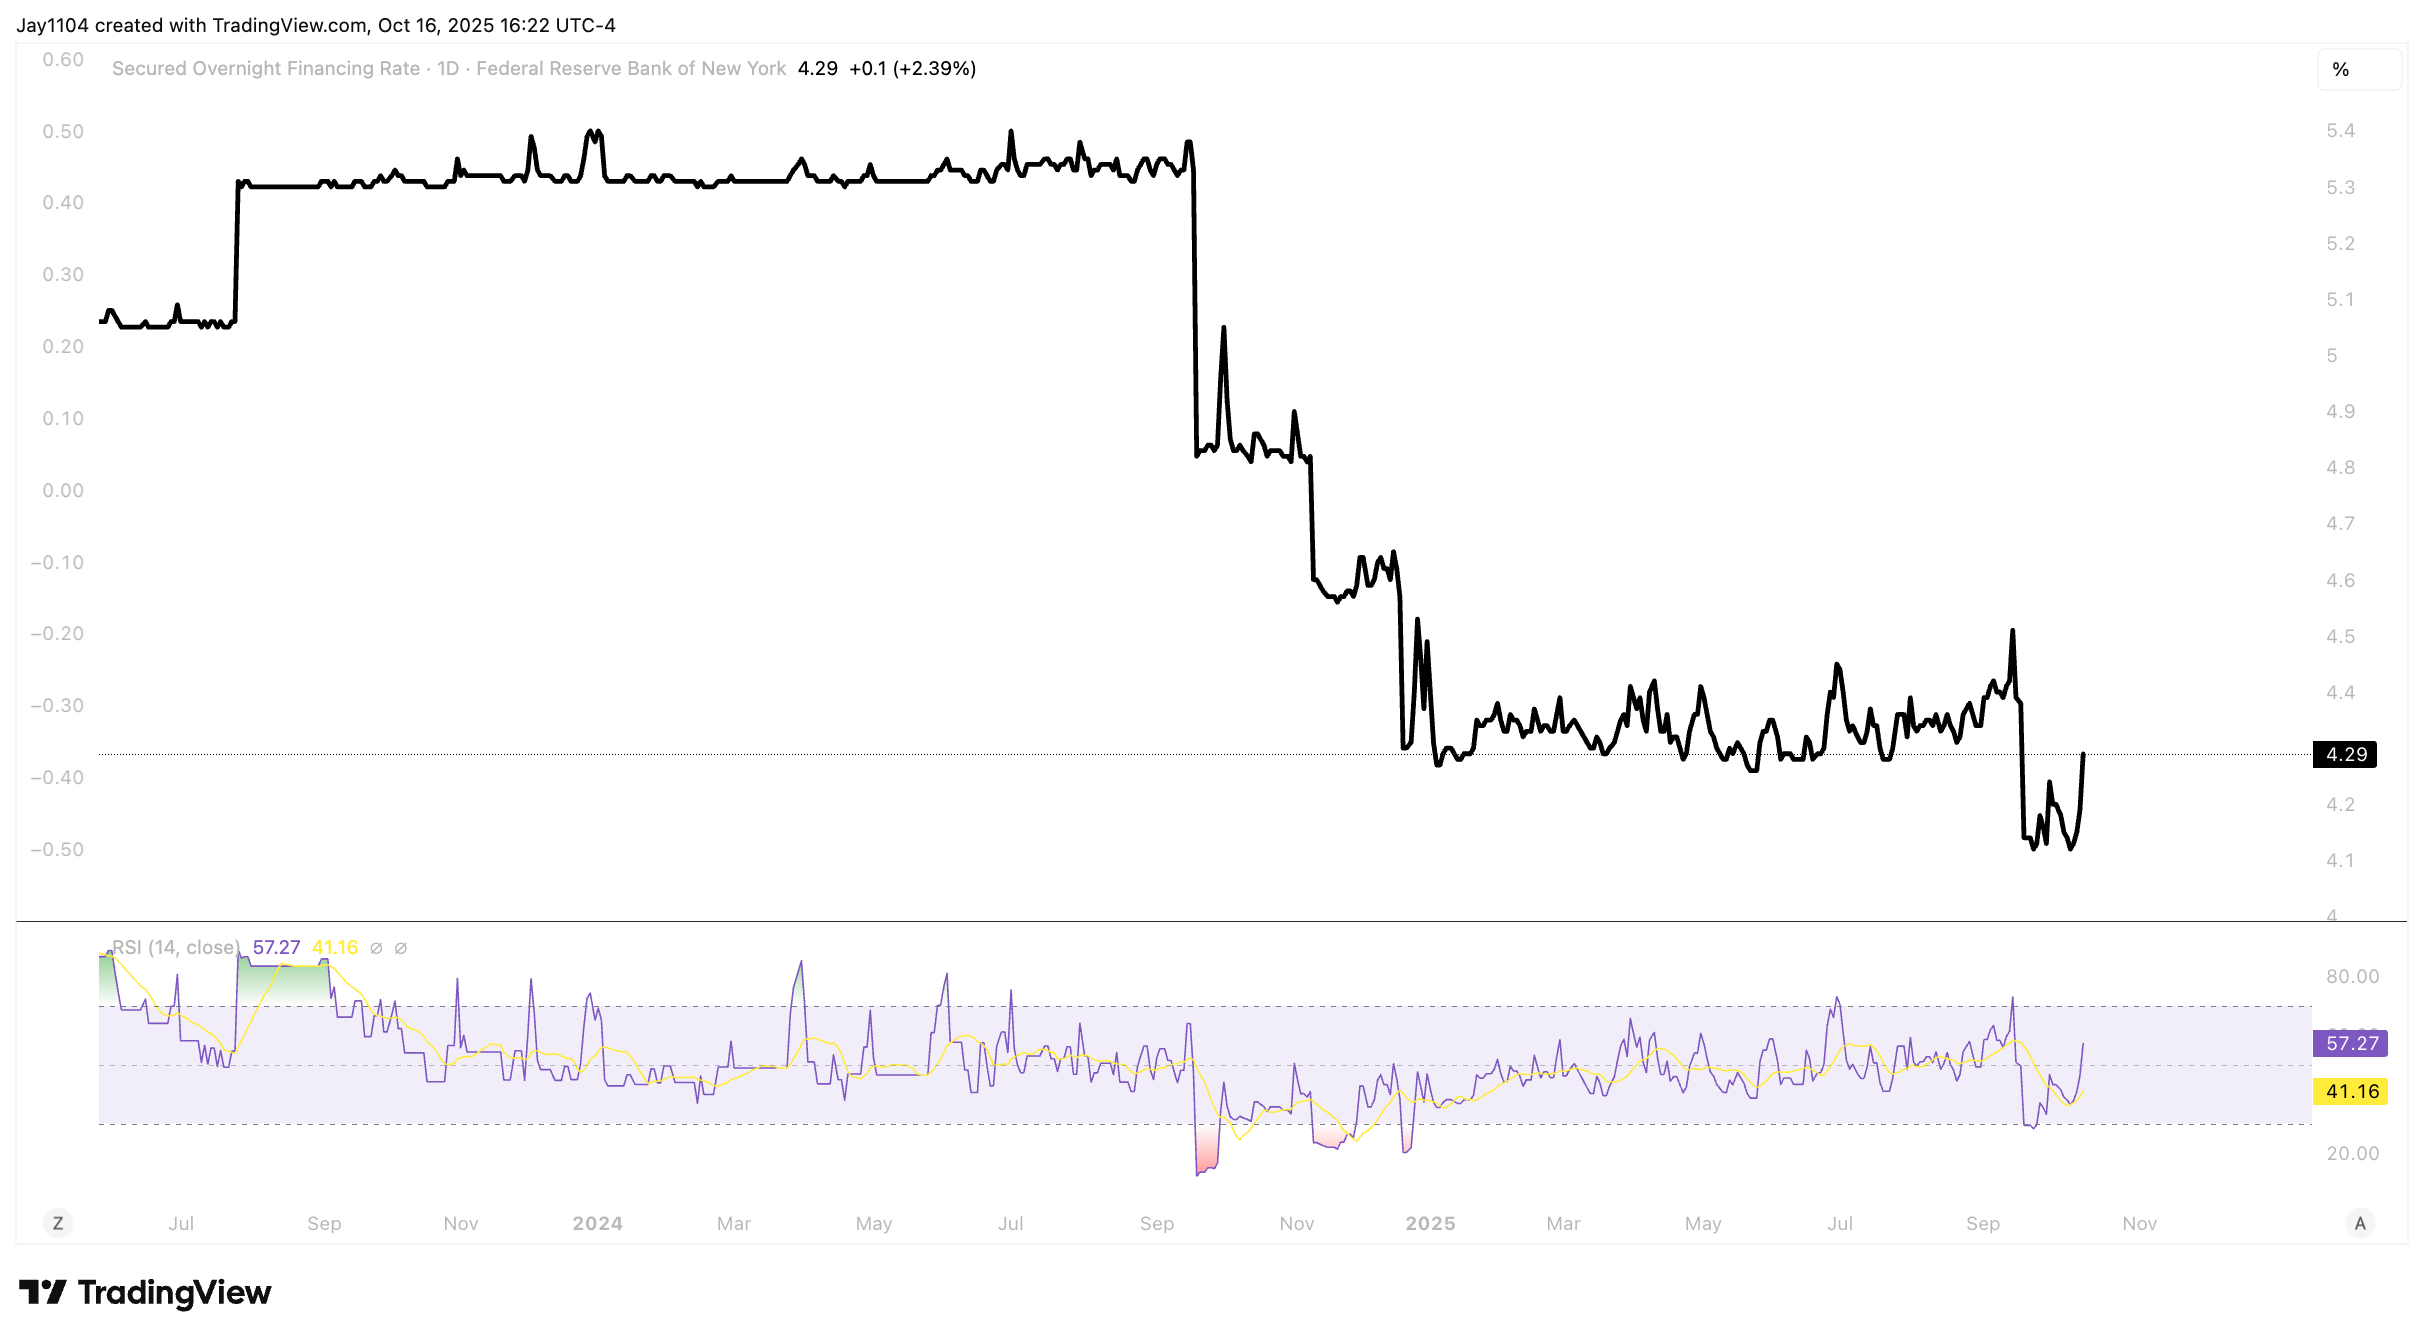
(Source: TradingView)
Past performance is not a reliable indicator of future results.
The S&P 500 Breaks Lower
It seems clear that the S&P 500 broke a short-term uptrend at the 6,650 level after failing for a fifth consecutive day at the 20-day moving average and forming a head-and-shoulders pattern on the intraday chart.
The next level of support now appears to be around 6,550. However, the put wall remains firmly in place at 6,500, and if the 6,550 support level were to be breached, it might lead to a test of that put wall. With options expiry tomorrow, Friday, 18 October, that could become a focal point for the market should such a move occur. The call wall for the S&P 500 has not changed and remains at 6,700, suggesting that the upside appears capped at least until the market moves past October options expiry.
.
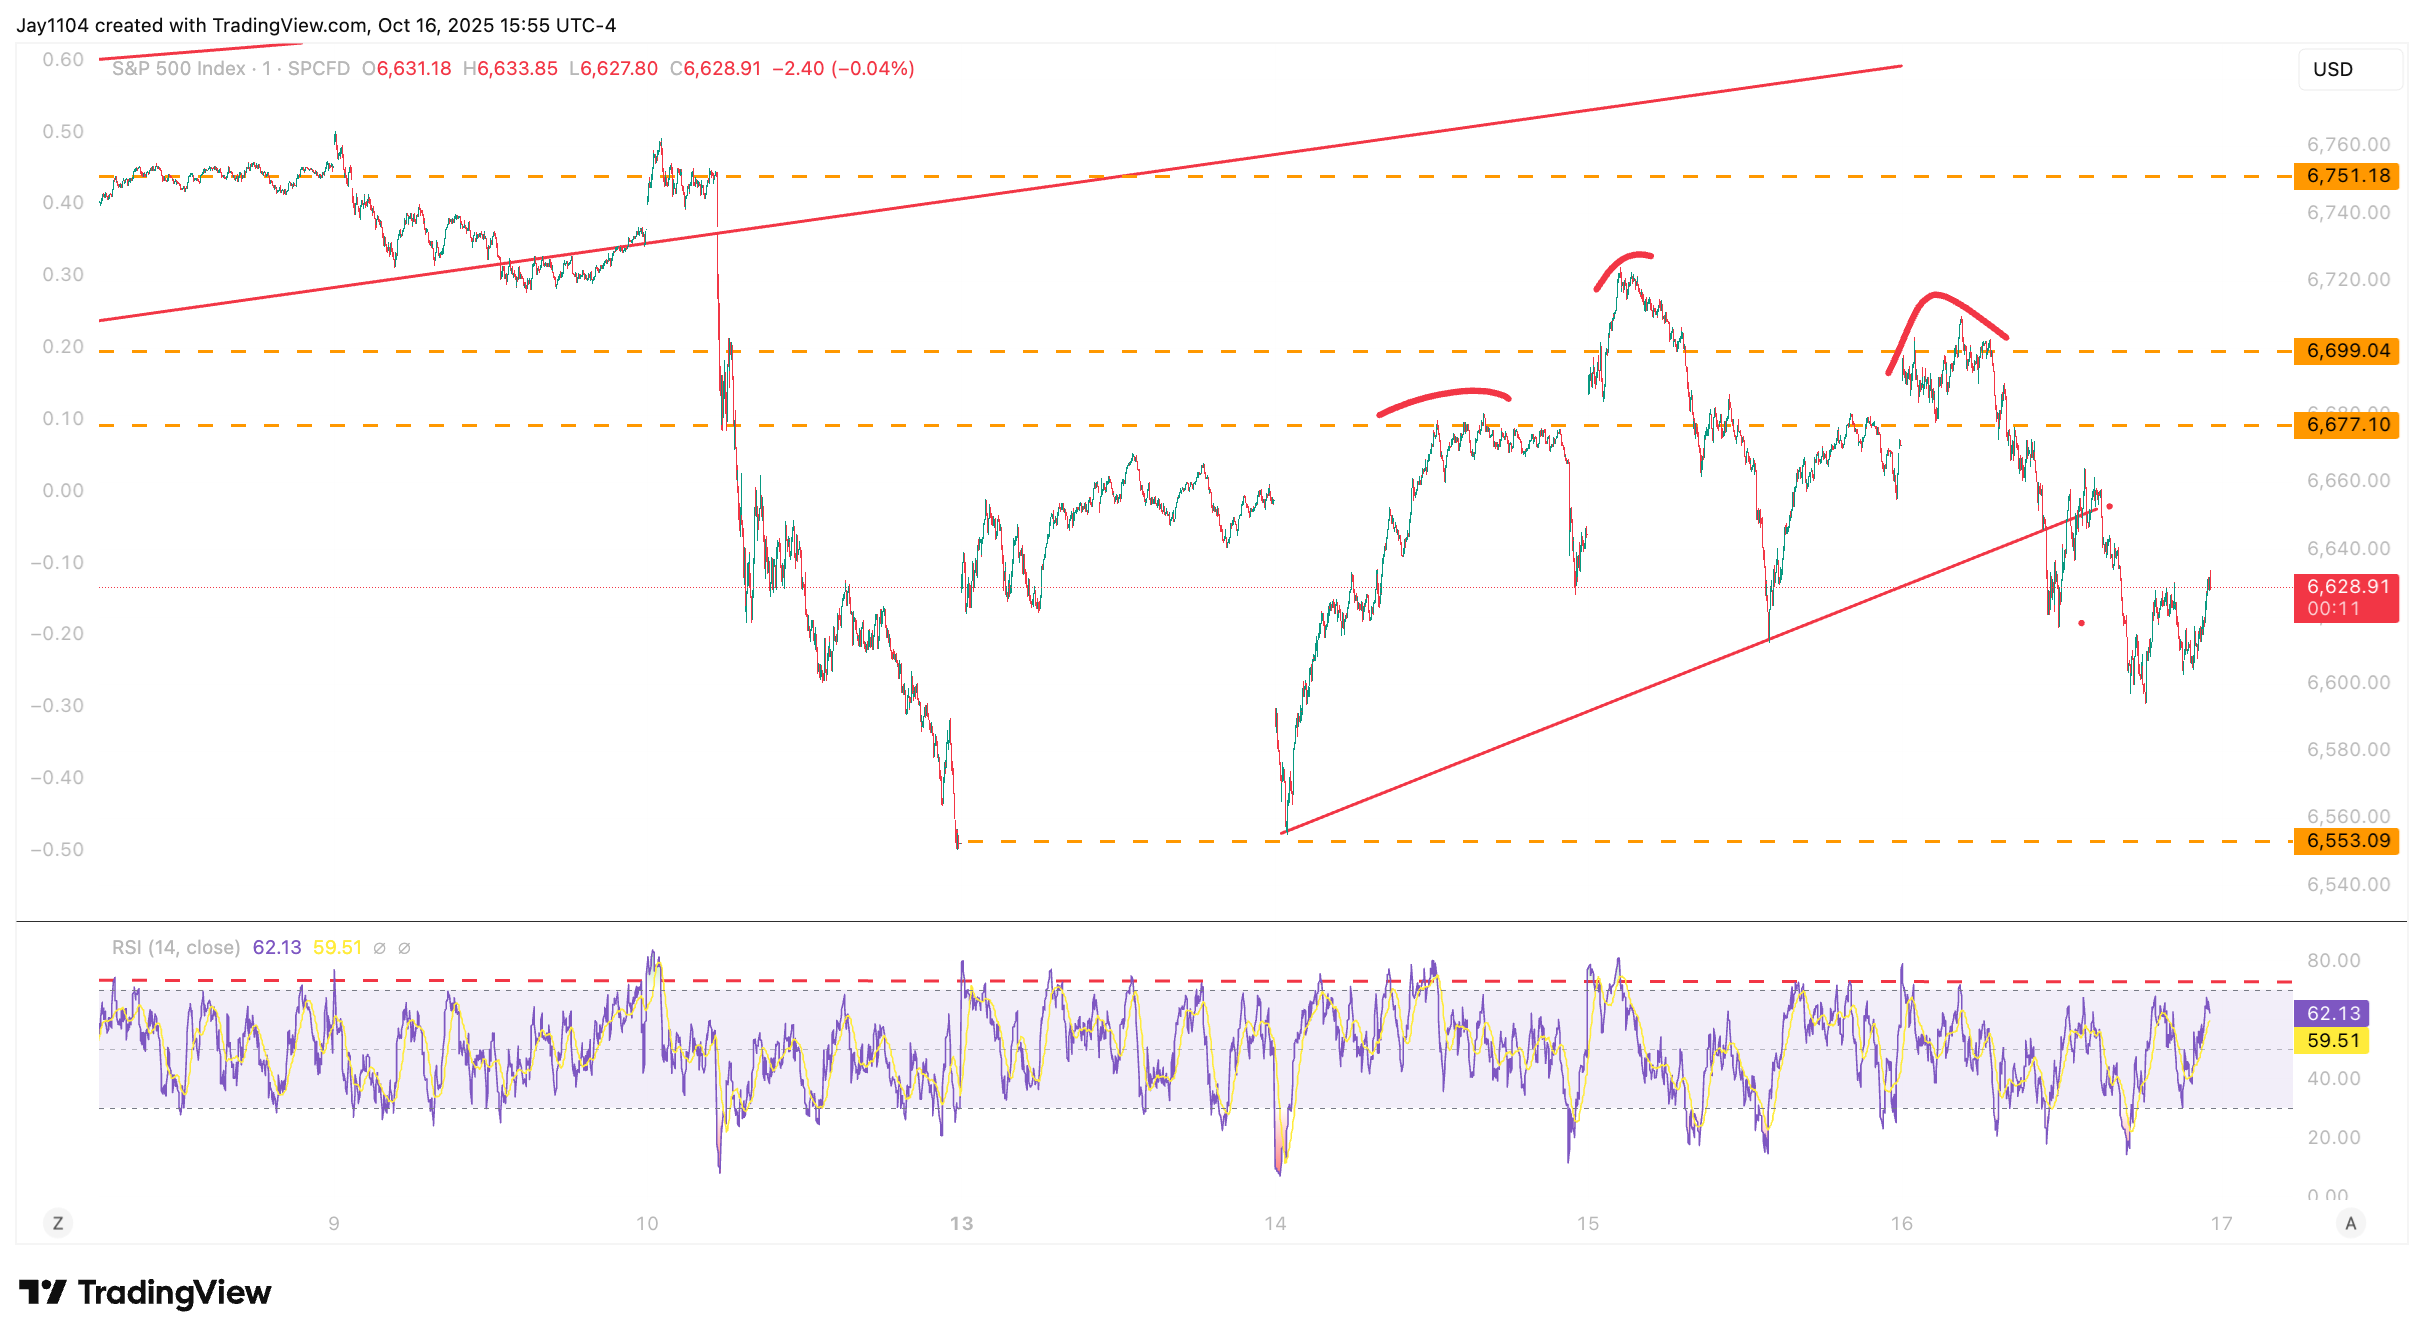
(Source: TradingView)
Past performance is not a reliable indicator of future results.
Bitcoin Breaks Support
Bitcoin also fell sharply on the day, declining by almost 3%. It broke what appeared to be a support level at 109,000 and is now trading below that threshold. A break of 108,000 could set up a potential move lower towards 100,000, where there is a mild level of support. If that support were to give way, it might open the door to a further decline towards 93,000. This makes the 108,000 level a particularly important area of support for Bitcoin. Additionally, momentum has turned somewhat bearish, with the RSI trending lower, though at a reading of just 40, it suggests there could still be room for further declines. Resistance for Bitcoin should move back above 110,000 would be around 114,000.
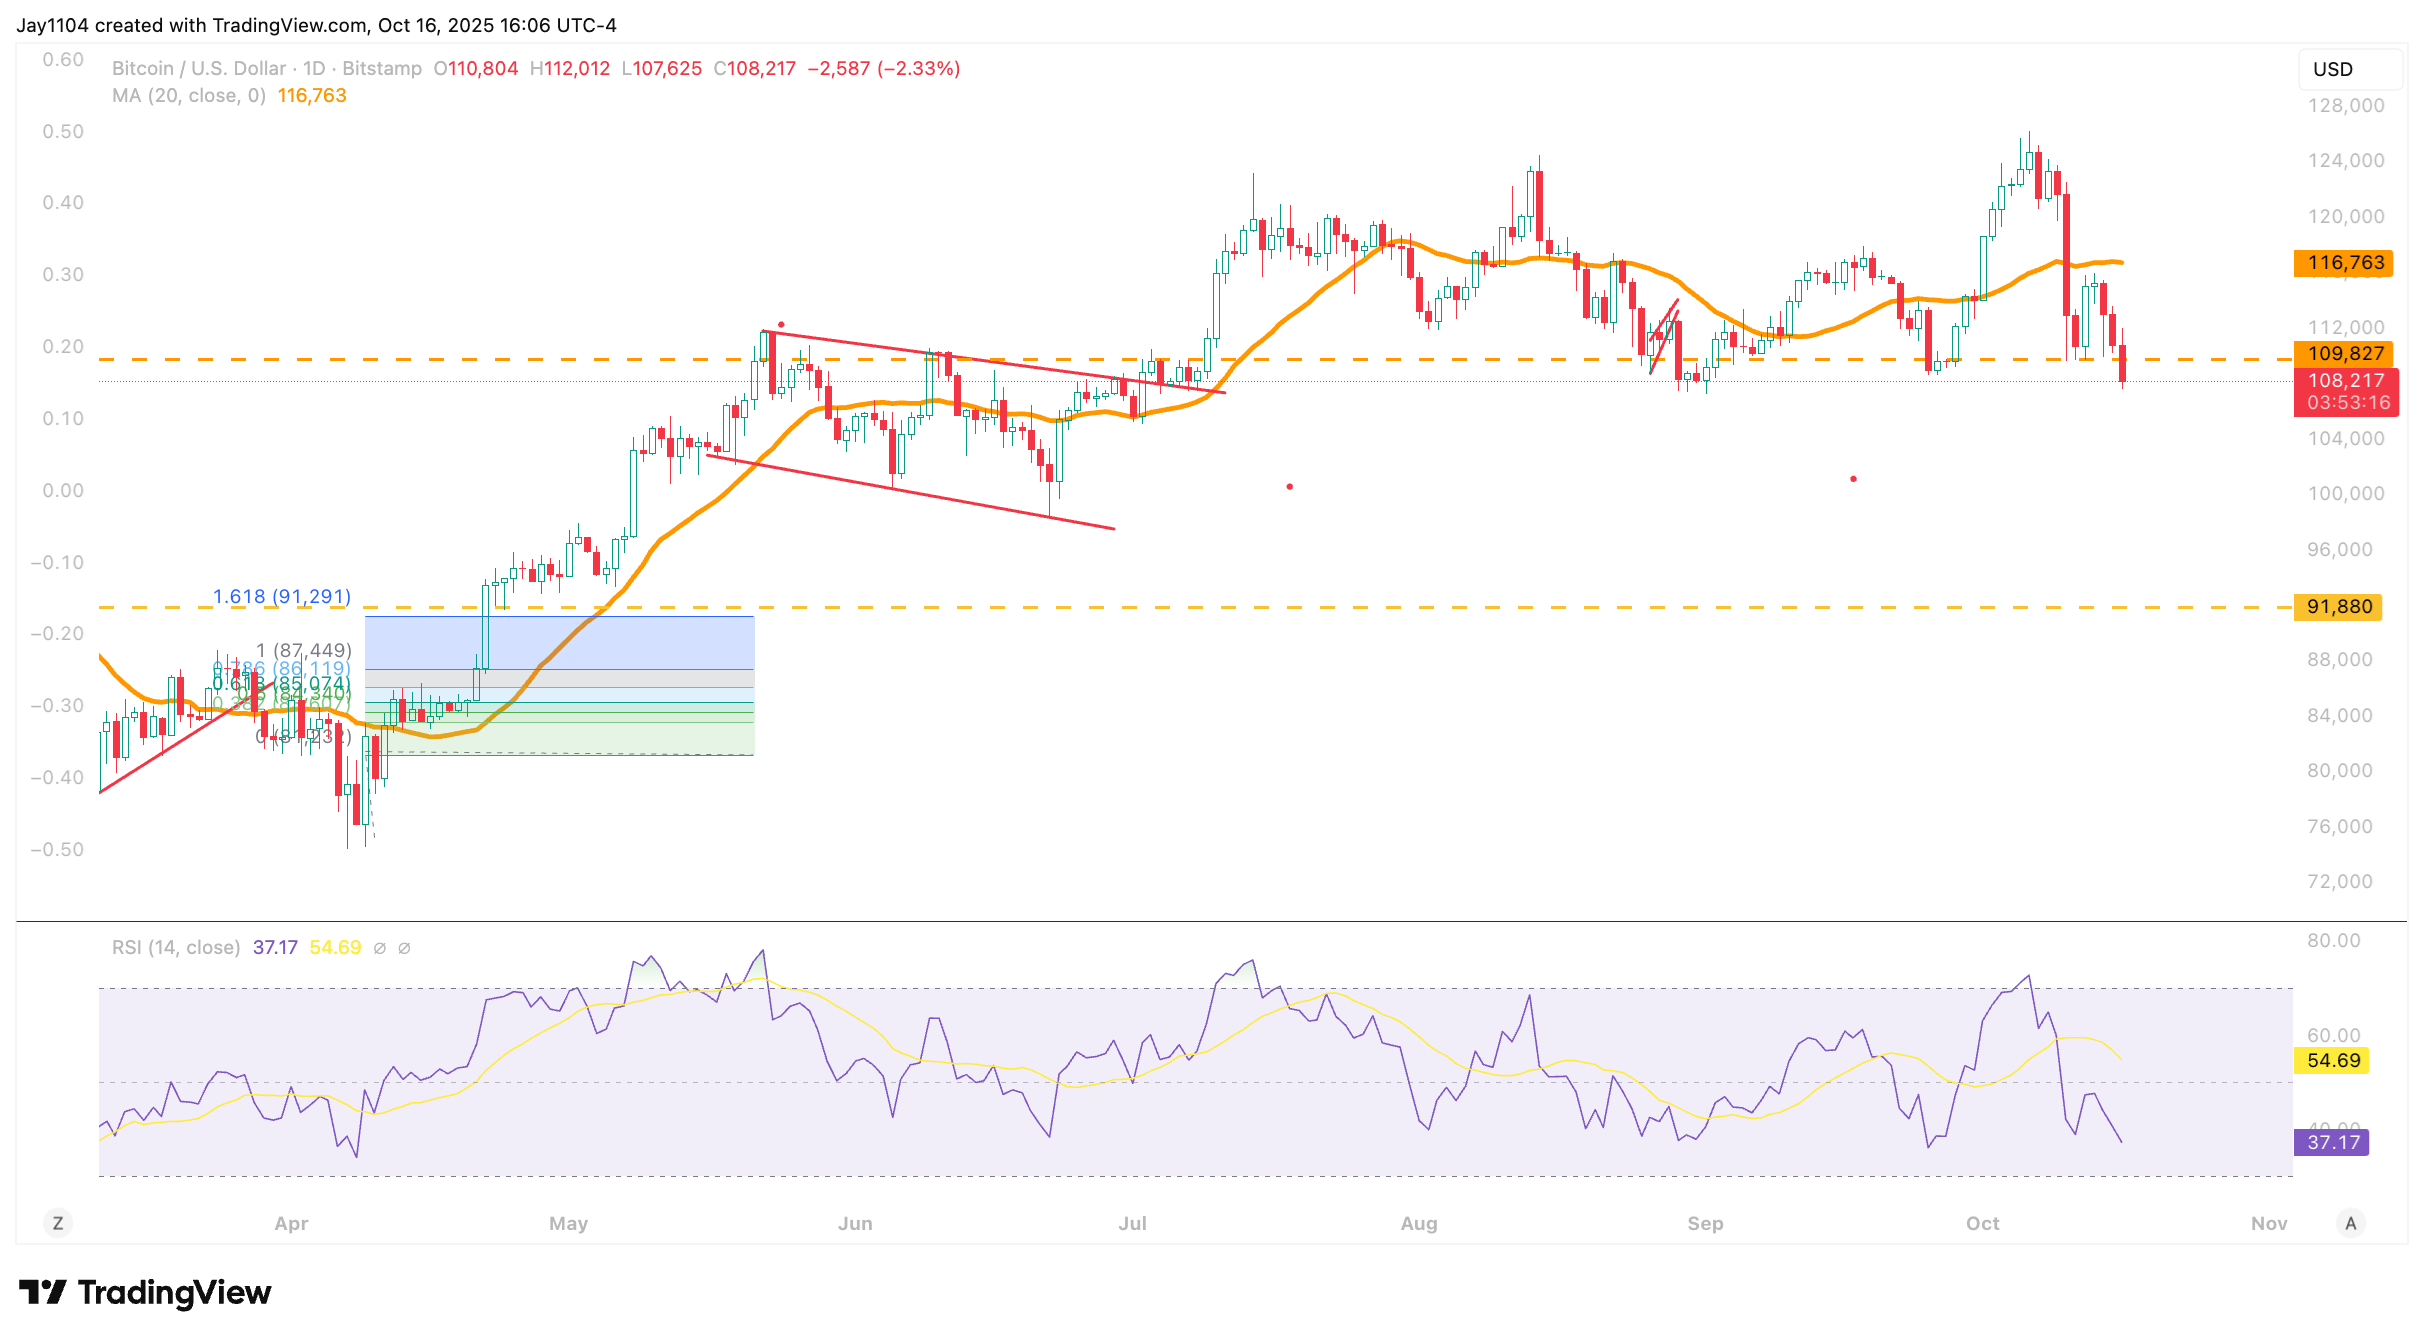
(Source: TradingView)
Past performance is not a reliable indicator of future results.
Banks Drop Sharply
The KBW Regional Bank ETF (KRE) fell by more than 6% after Western Alliance and Zions Bank announced they were exposed to alleged borrower fraud, raising concerns about the health of the sector. The ETF dropped below support around $59.5 and continued to fall to roughly $57.6, followed by an end-of-day bounce. The next significant level of support does not appear until around $55.5. At present, the RSI is trading near 31, suggesting the ETF could decline further, and has not reached oversold levels yet. 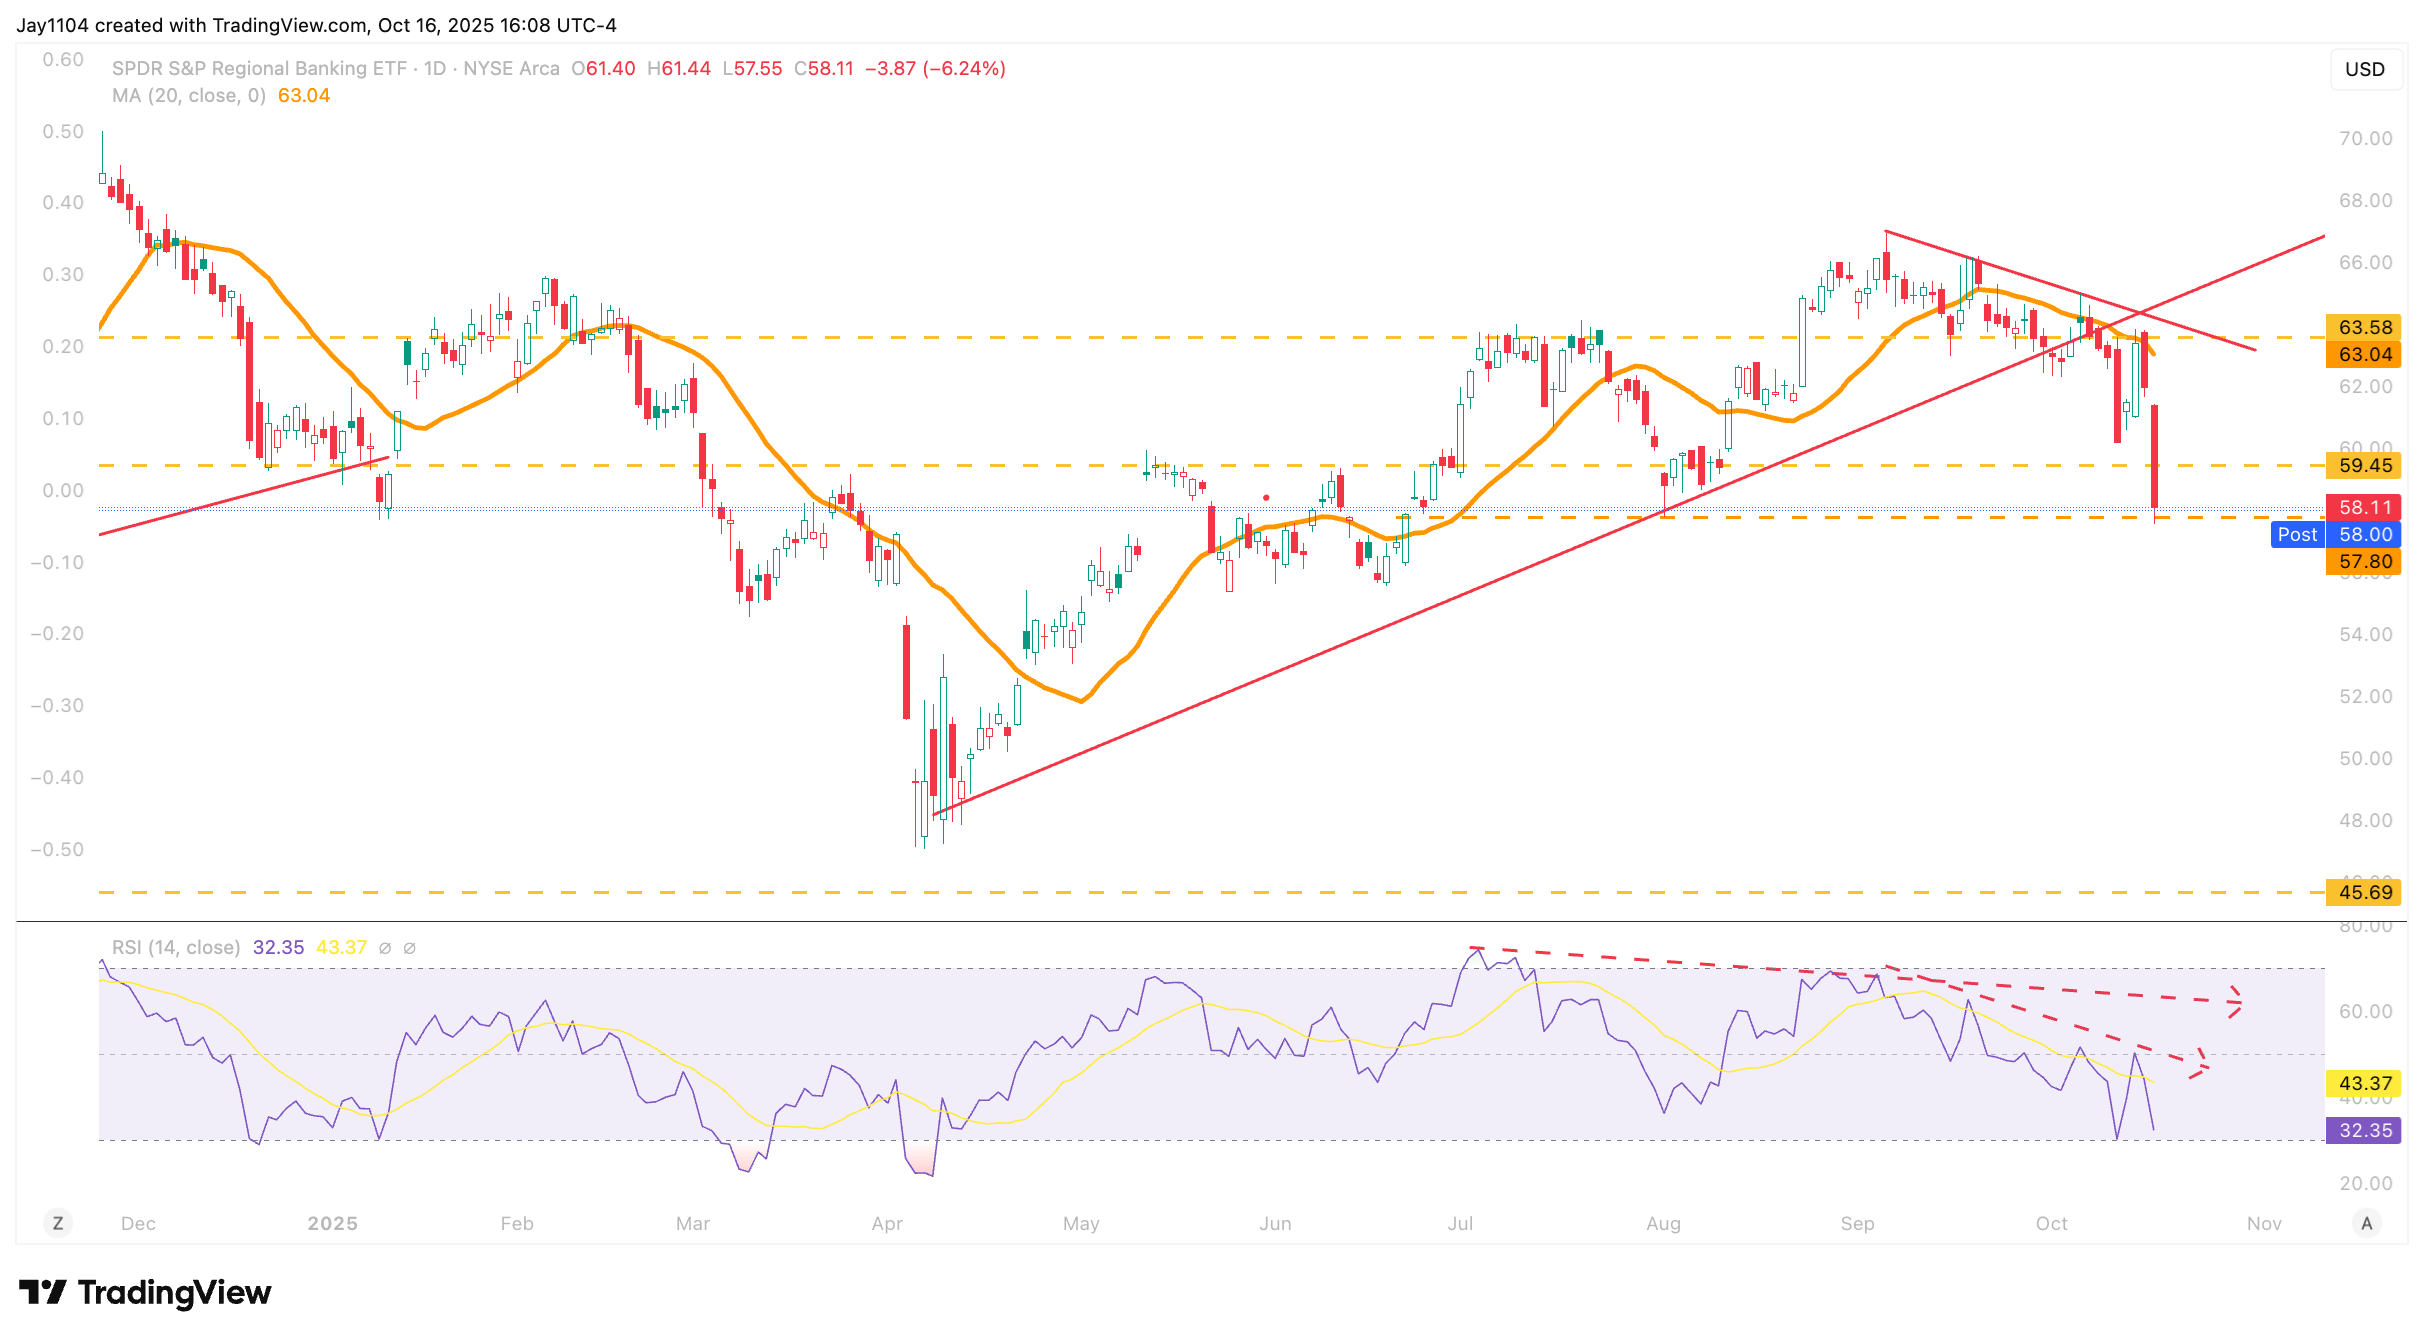
(Source: TradingView)
Past performance is not a reliable indicator of future results.
The sell-off in the banking sector was not limited to regional banks. The money centre banks also fell sharply, with the Financial Select Sector SPDR ETF (XLF) declining by more than 3%. The XLF broke below an uptrend that had been in place since 2 May, falling to a support region around $51.6. If the XLF drops below $51.5, it may create an opportunity for a gap fill near $50.75. Beyond that, the next potential support area lies in the upper 40s.
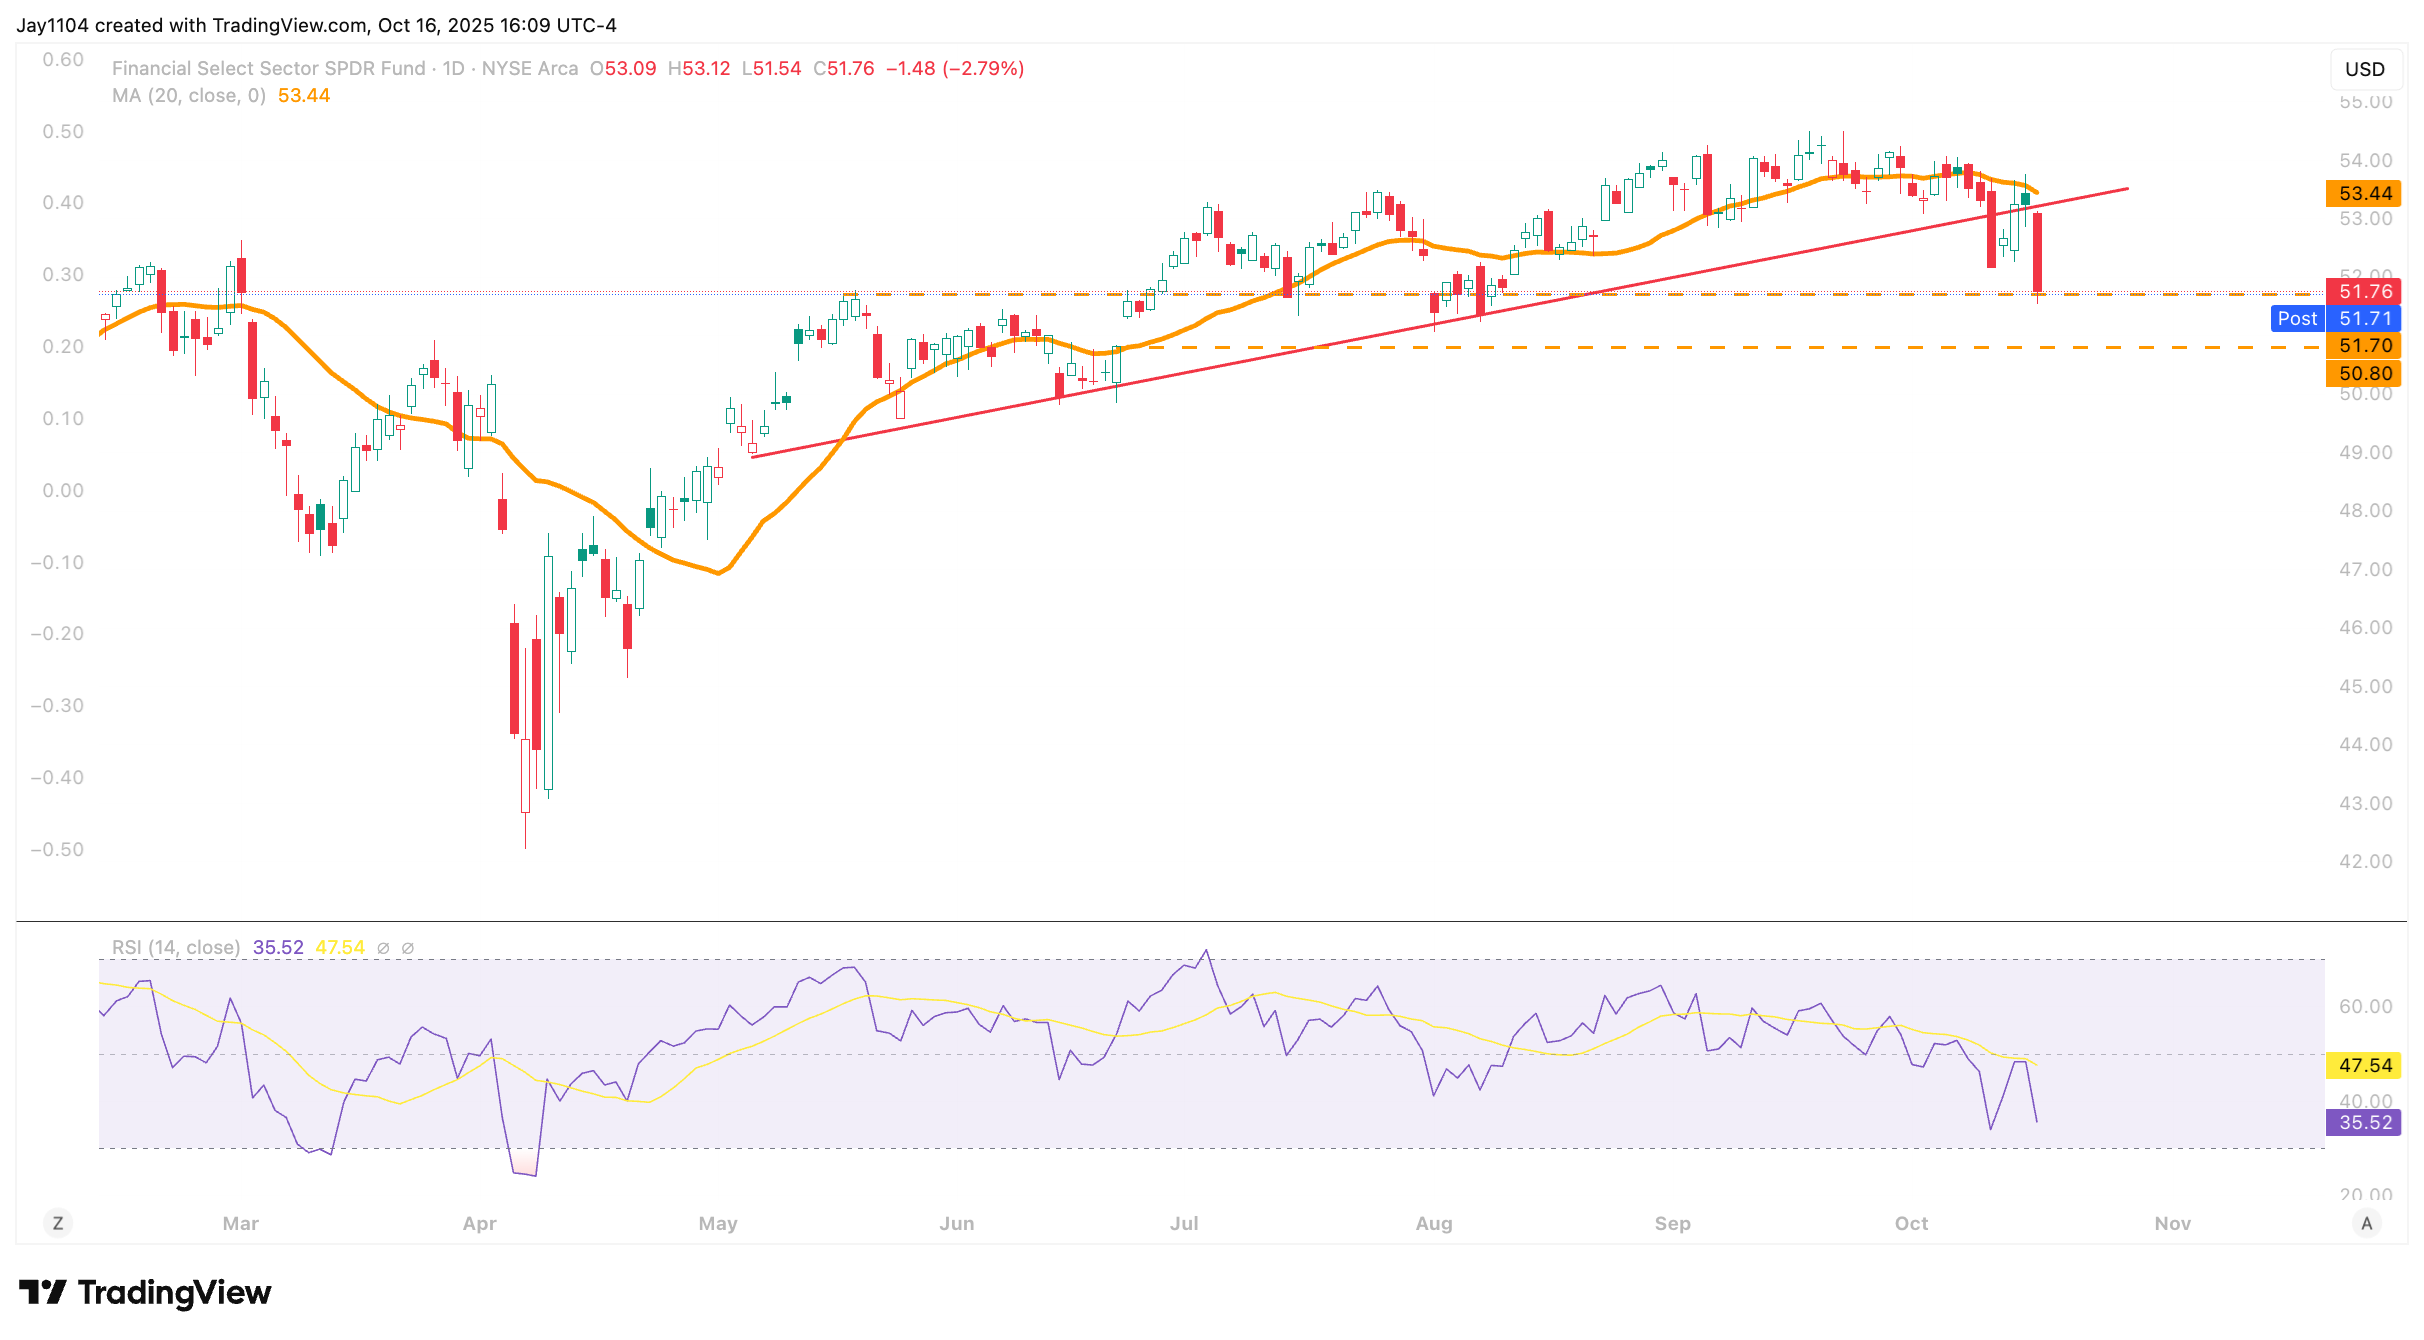
(Source: TradingView)
Past performance is not a reliable indicator of future results.
Oil Slides to Support
US WTI oil prices also fell sharply, by more than 2% to $57.50. Oil has returned to the lows seen on 2 May and may be at risk of breaking lower still. If it falls through this support level at $57.50, it could open a path to roughly $52, where there is mild support. The next major level of support does not appear until the low $40s. Given the sharp downtrend in oil and the RSI's continued downward trend, it suggests there may still be further downside. It would not be surprising to see oil continue to slip in the days and weeks ahead.
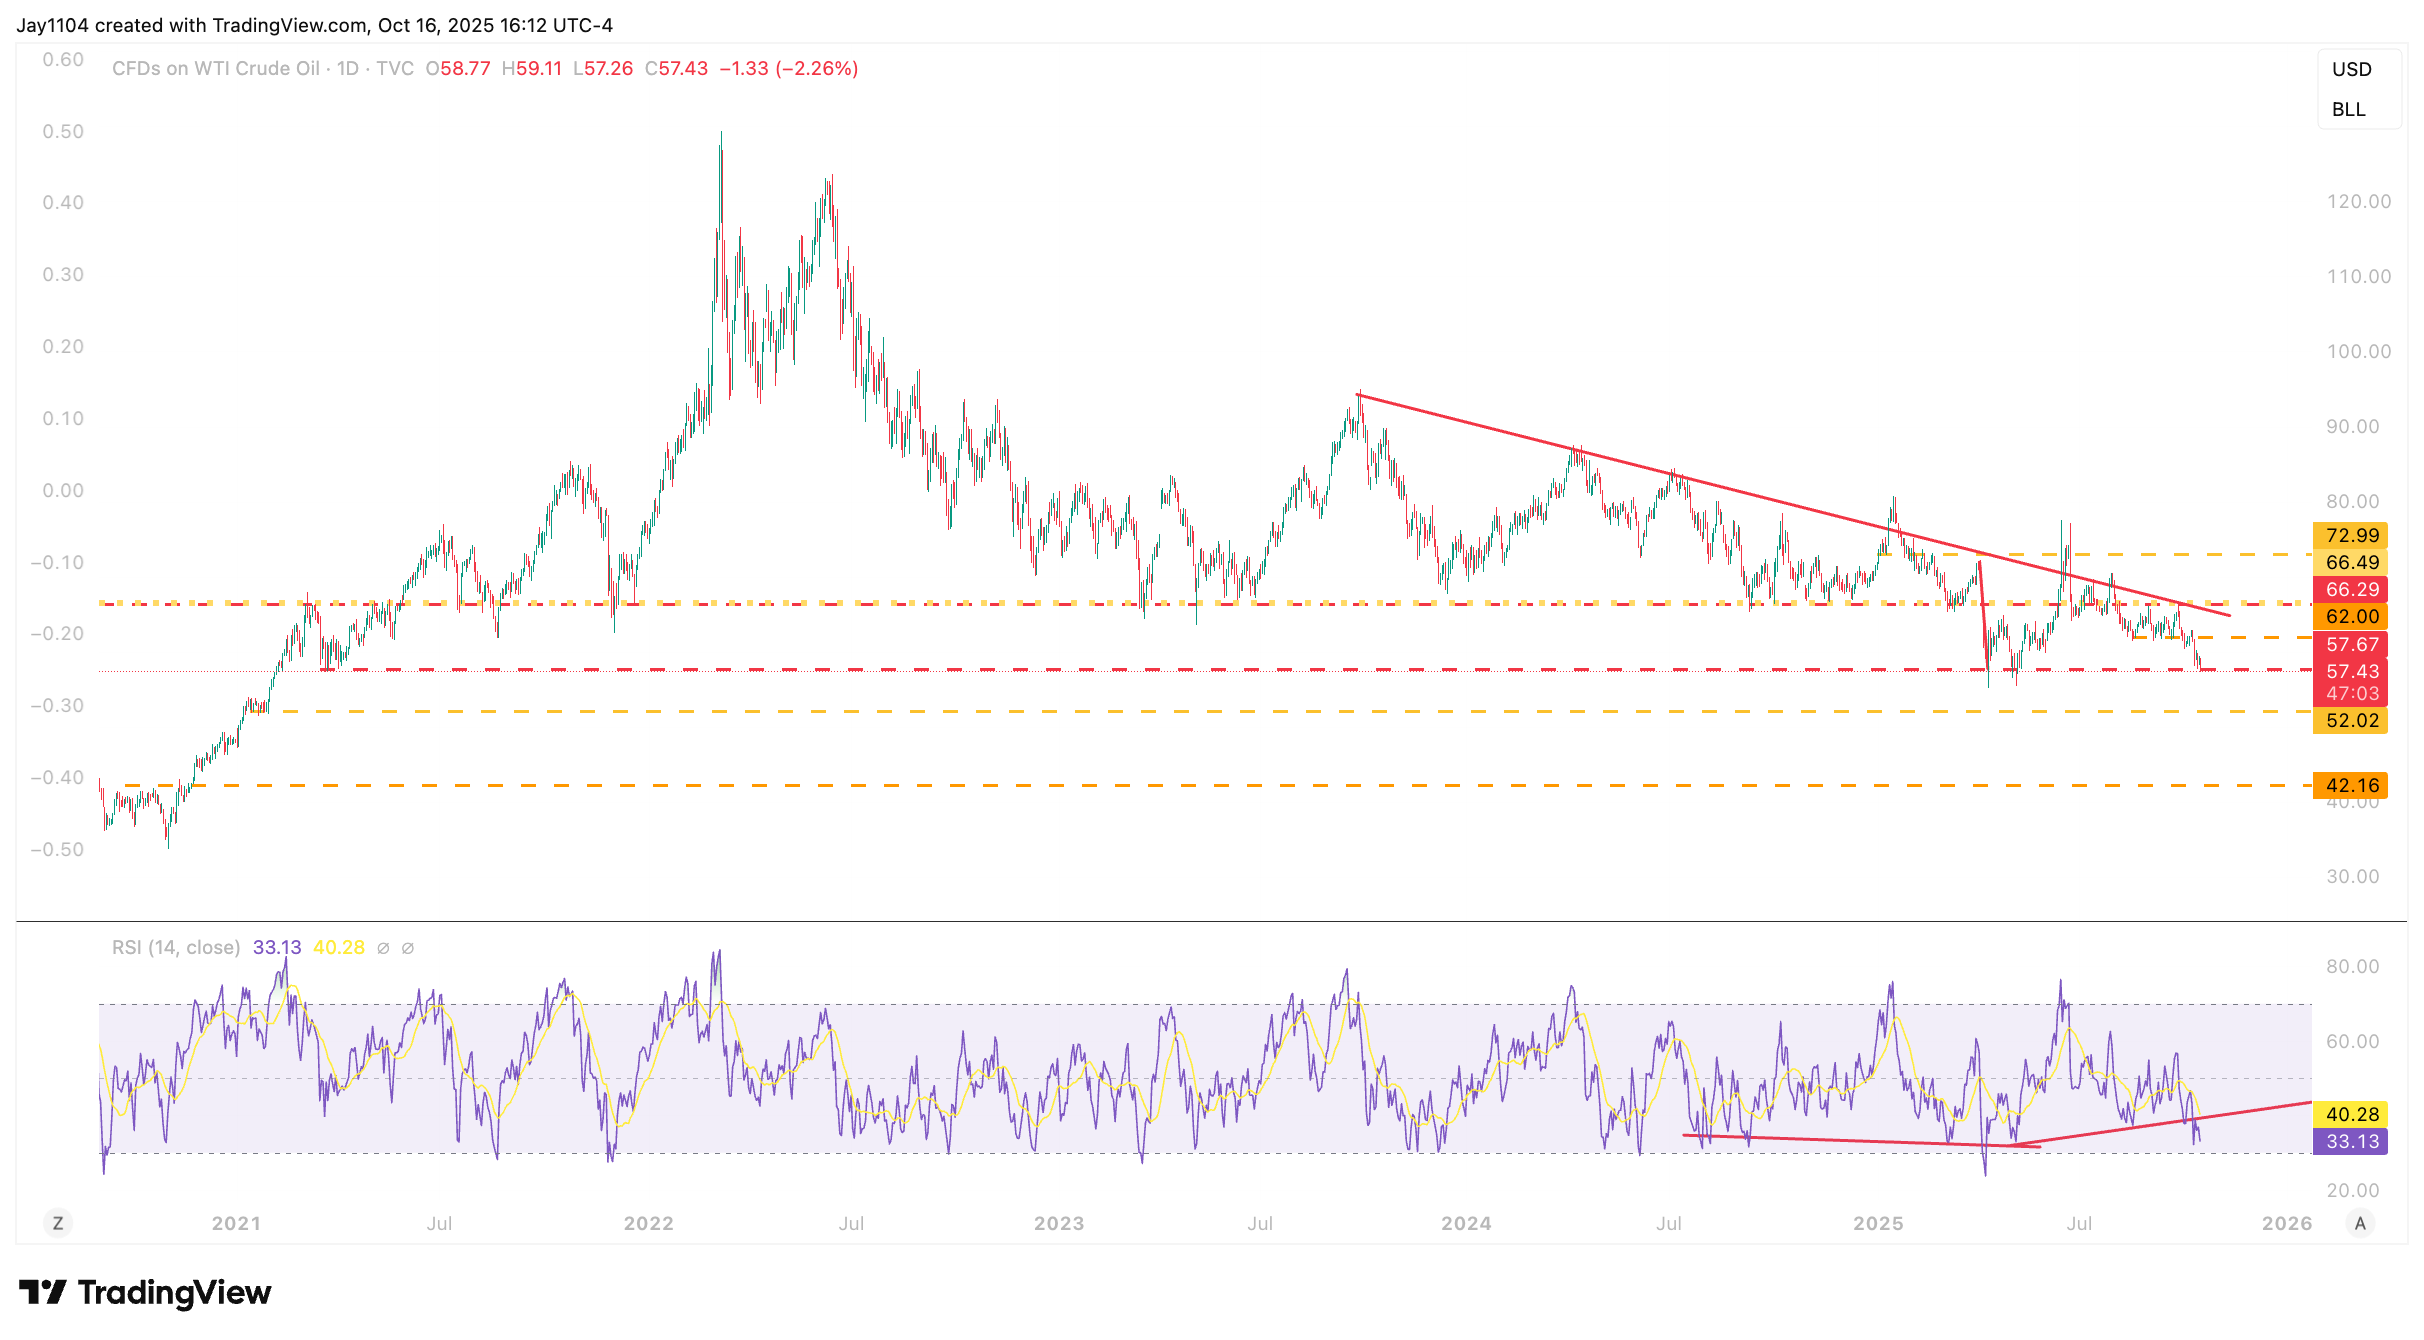
(Source: TradingView)
Past performance is not a reliable indicator of future results.
Weak oil prices led to the Energy Select Sector SPDR ETF (XLE) dropping by over 1% on Thursday. This pushes the XLE just above support at $84.20. The XLE has also broken a major uptrend that formed back at the end of April. A break of support at $84.00 could result in the XLE falling back to around $80.00 to $81.00.
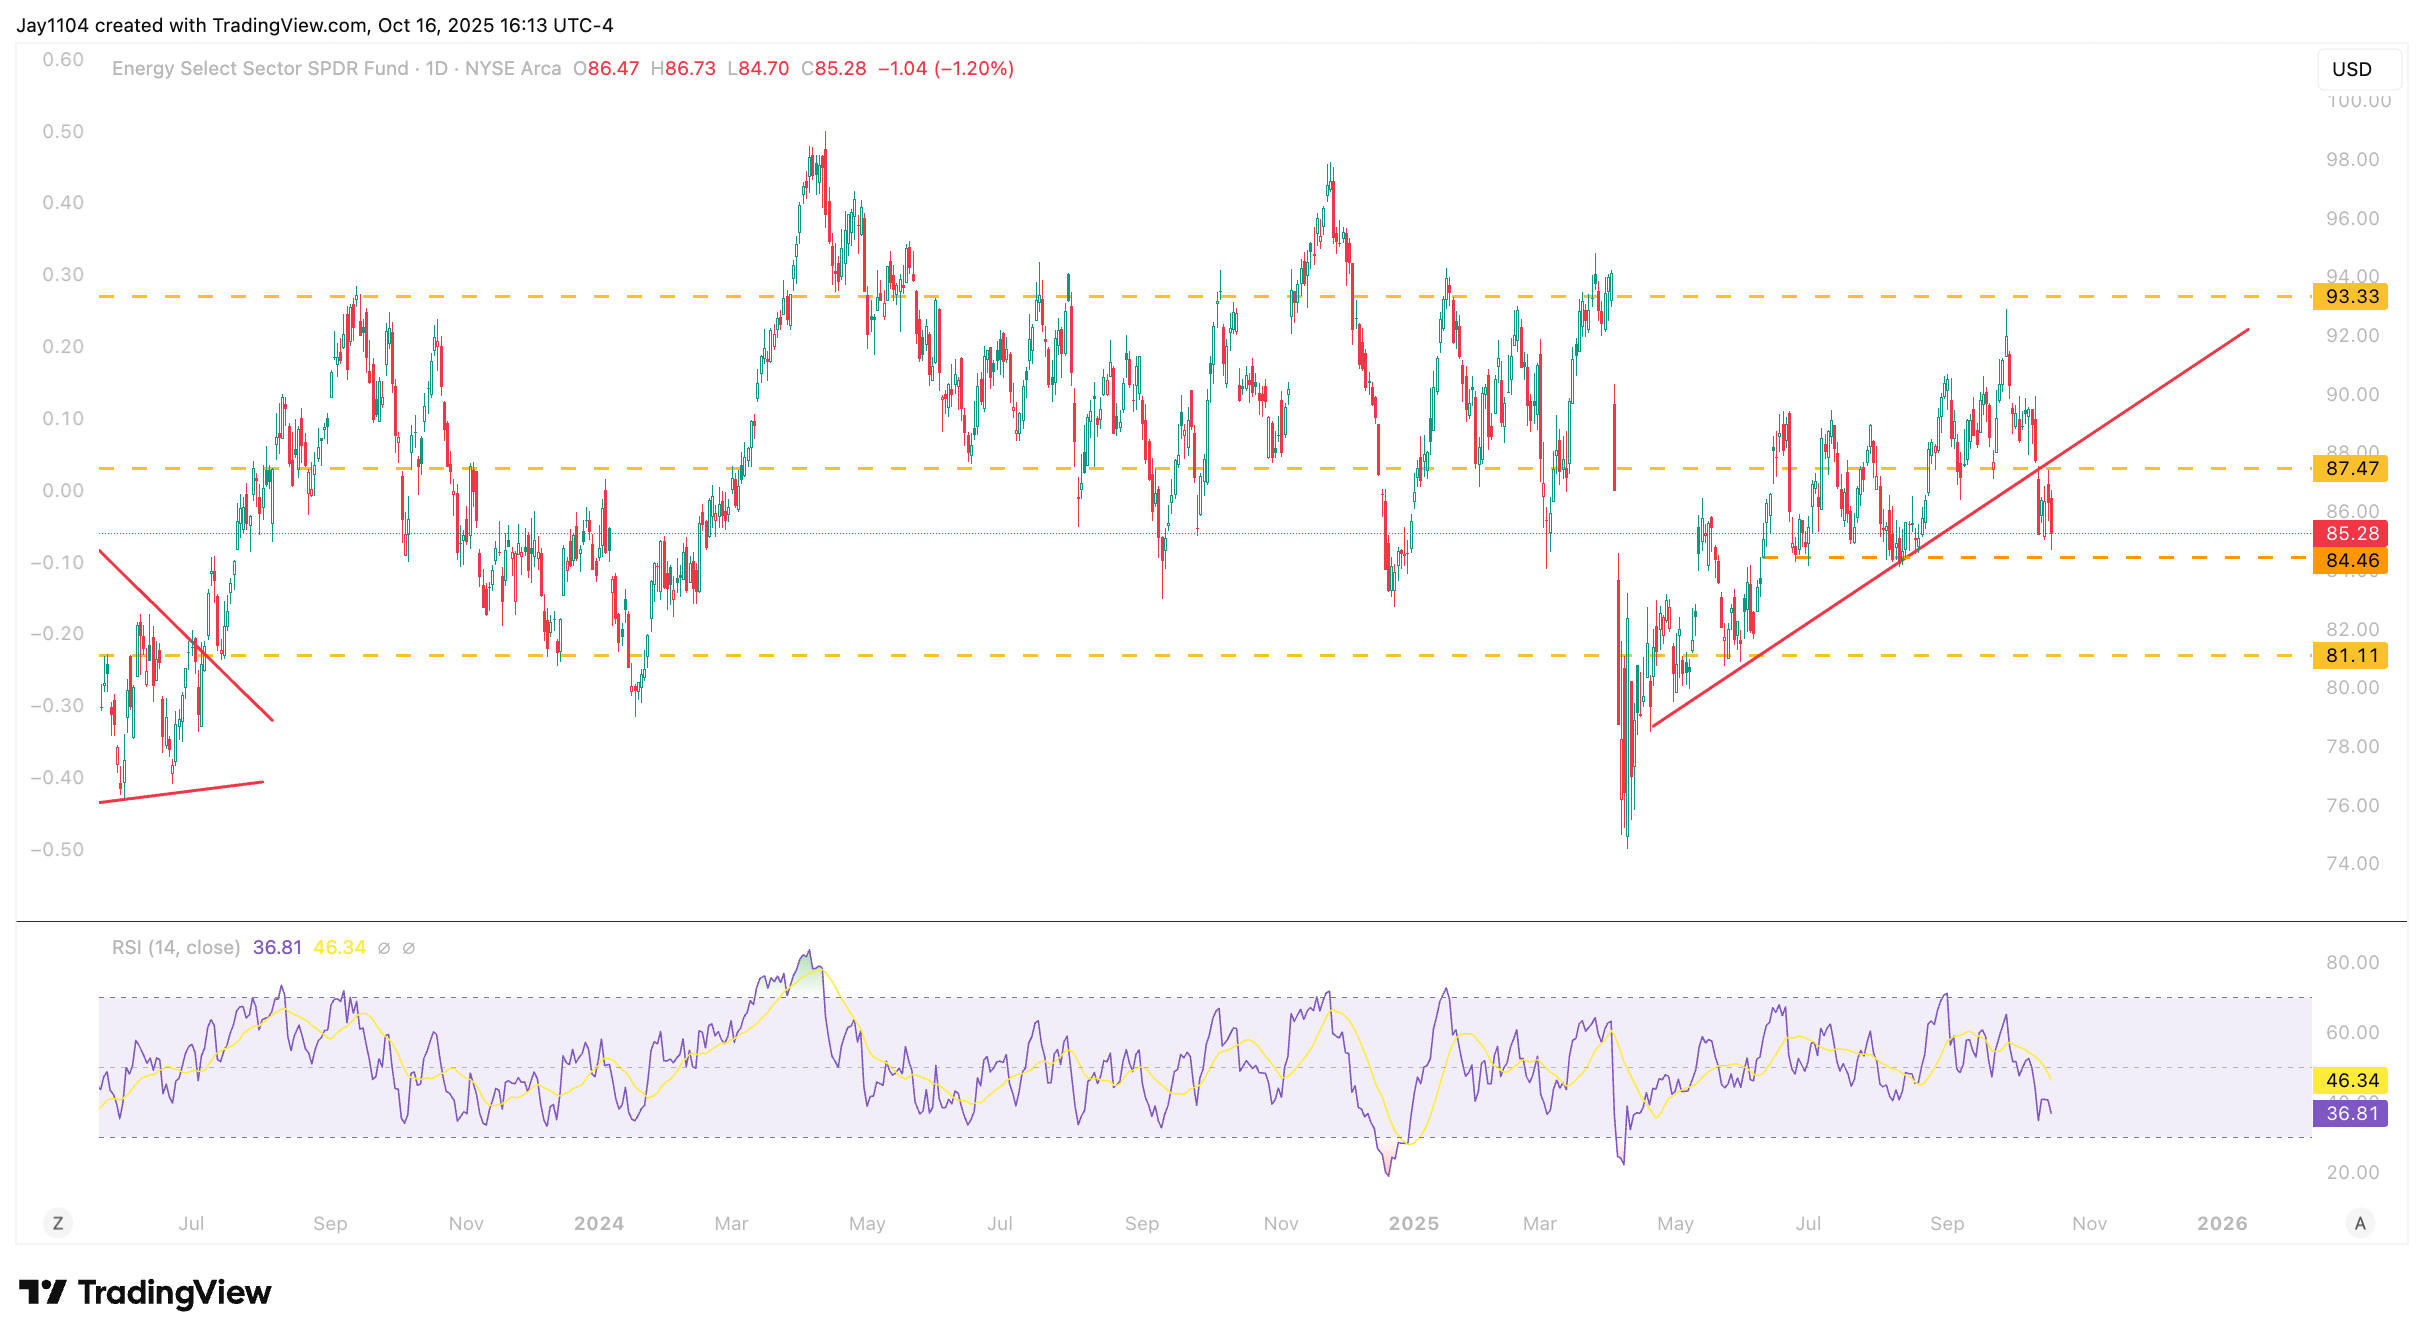
(Source: TradingView)
Past performance is not a reliable indicator of future results.