Trading Gold as it Reaches $4,700
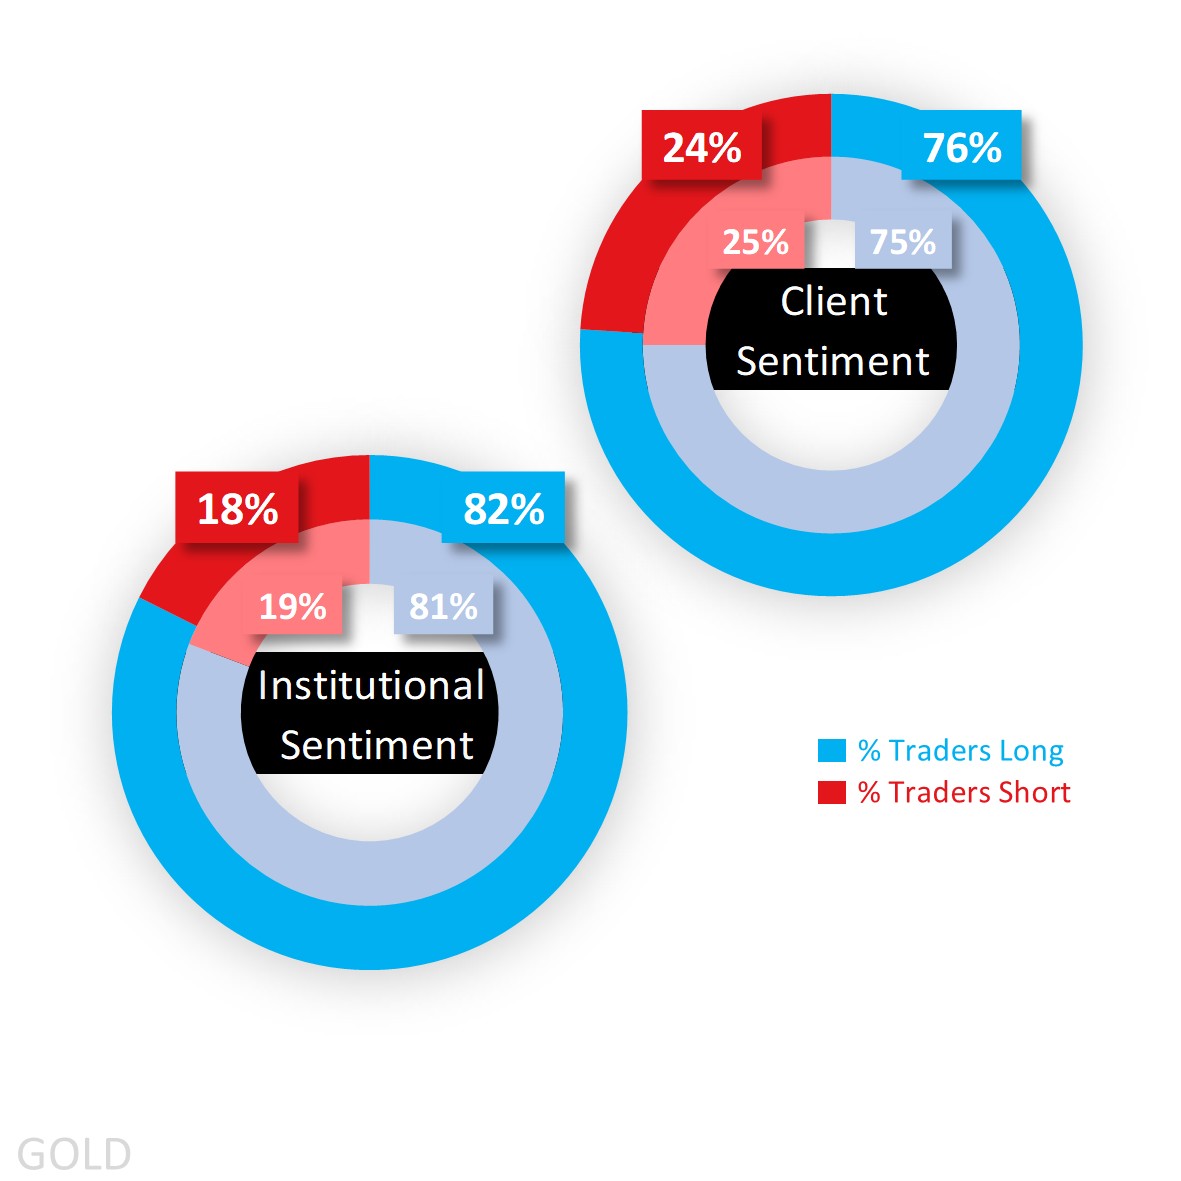
The technical overview remains volatile in the face of the geopolitical event, and in sentiment it’s a story of heavy to extreme long bias among traders both large and small.
U.S. equity index futures have filled the gap and are marching higher as oil prices (WTI) briefly fall below $102, and follows a sharp rebound last week off March’s lows. We’ve been in this period where markets have been experiencing a direct and negative correlation between oil and almost the rest, seeing the energy complex and the dollar climb when geopolitical tensions worsen sending equities and bond values lower and the opposite occurring when a ceasefire seems closer.
For gold, geopolitical uncertainty and upheaval is supposed to be a positive, but not when the precious metal is priced against a greenback that’s been generally bid on rising likelihoods the Federal Reserve (Fed) will be more hawkish to fight what will be more persistent inflation, an added negative factor being a non-yielding asset whenever Treasury yields march higher and especially when it occurs in real terms. That means this morning’s pullback in oil is also welcoming news for gold, helping it retake $4,700, but where there’s still a mountain to climb to undo the losses experienced last month.
There’s been escalating rhetoric on the geopolitical front but also a recent report that both sides of the conflict have received a peace proposal. But we’ve been here before, and it’ll require something more concrete in terms of action (or avoiding escalating action) to help calm the market.
In terms of economic data, U.S. Non-Farm payrolls for March was up a healthy 178K well above the 65K forecast reversing February’s (revised lower to) -133K (strike-related) decline, with the unemployment rate a notch lower to 4.3% due to the drop in the labor force participation rate to 61.9%. Average hourly earnings rose 0.2% m/m (month-on-month) and 3.5% y/y (year-on-year), the slowest annual pace since May 2021. Out of S&P Global, its services PMI (Purchasing Managers’ Index) for the same month fell into contraction with a 49.8 print, missing the 51.1 forecast.
We’ll get ISM’s print later today, durables data tomorrow, minutes from the latest FOMC (Federal Open Market Committee) on Wednesday, PCE (Personal Consumption Expenditures) and GDP (Gross Domestic Product) on Thursday, and both CPI (Consumer Price Index) and UoM’s (University of Michigan) sentiment and inflation expectations on Friday. Important no doubt, but it’ll be about whether we see big escalation following tomorrow’s deadline, with a press conference expected later today.
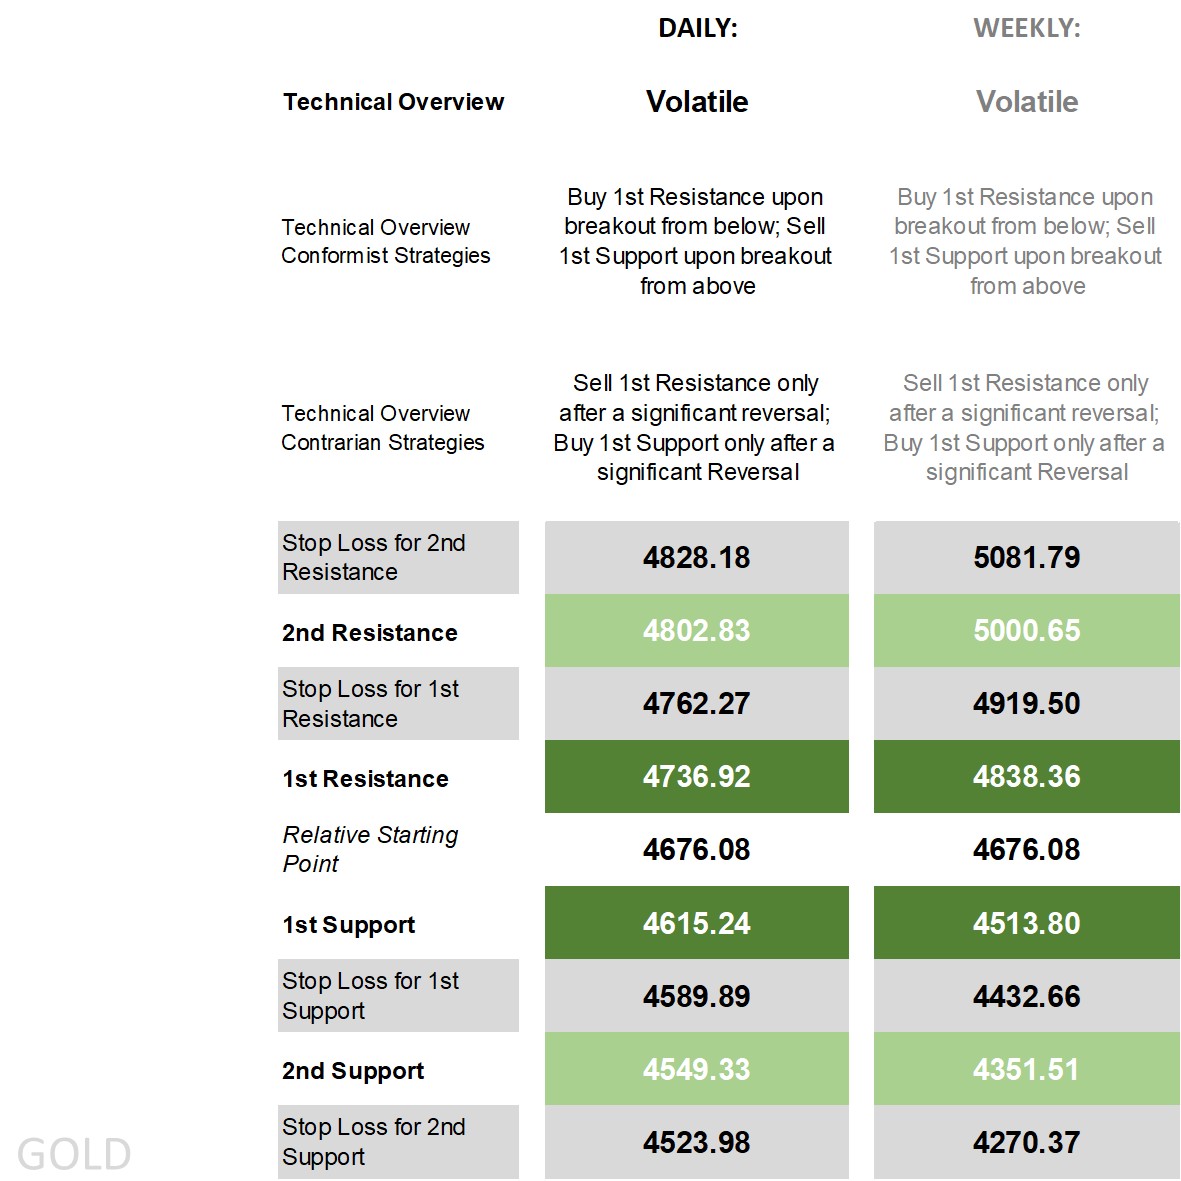
Gold’s technical overview, strategies and levels
Looking at the daily time frame and price isn’t completely above nor beneath its main moving averages (MA) keeping the signal there neutral, so too for the Bollinger Bands as price hovers near the middle, on the DMI (Directional Movement Index) front the -DI well above the +DI enough to classify it as negative and was caused by the $1K pullback back in March, an RSI (Relative Strength Index) that is back near the middle, and an ADX (Average Directional Movement Index) still in trending territory but slowly dropping. It’s a somewhat similar story on the weekly time frame though the weekly ADX by one calculation is no longer in trending territory.
Mostly neutral indicators combined with a negative DMI and a trending ADX are something that usually gives the bears some hope. However, given gold’s reaction to the headlines, the fog from those headlines, as well as the difficulty for market participants in trying to price the non-yielding precious metal, means the overview is stuck at ‘volatile’. That puts breakouts – whether buying off the 1st Resistance or selling off the 1st Support – into the conformist camp who see the overview as holding. Those who expect price to settle in these ranges belong to the contrarian camp and have sell-after-significant reversal strategies to work with waiting for the levels to break/breach and only initiating if they reverse back to the key price levels, avoiding fading strategies that are far more prone to getting stopped out.
The issue here is that when there’s a big uptick in volatility the likes of which we saw a few weeks ago that saw conformists sell-breakouts cheer, it also caused levels to widen and starts testing trend-traders when the market navigates calmer waters. That’s not to say another bout of volatility isn’t around the corner especially when considering that the smallest geopolitical update could have big ramifications, but it does mean that even if conformists net outperform against contrarians, it may not always be smooth sailing.
Capital.com’s client sentiment for Gold
It has remained a story of heavy to extreme buy sentiment among Capital.com’s traders, usually taking profit when prices climb and emerge to buy on dips when they occur. But the pullback in March saw longs get squeezed notably and took sentiment out of extreme long territory even if they remain just a couple notches shy of it at the start of this week at 76%. That explains the yellow-dotted line (% long sentiment using the left axis) on the chart below falling alongside price last month instead of rising.
Larger speculators, according to the latest CoT (Commitment of Traders) report (and mapped using the green-dotted line on the chart below), show they’re still at extreme buy levels, raising the net buy sentiment to 82% from 81% prior. Keep in mind they reduced both long (by 13,529 lots) and short (by 8,134) positions but in percentage terms helped take the percentage of lots long slightly higher. They are also majority buy in silver and, at 78%, are only just at extreme long levels.
Client sentiment mapped on the daily chartSource: Capital.com
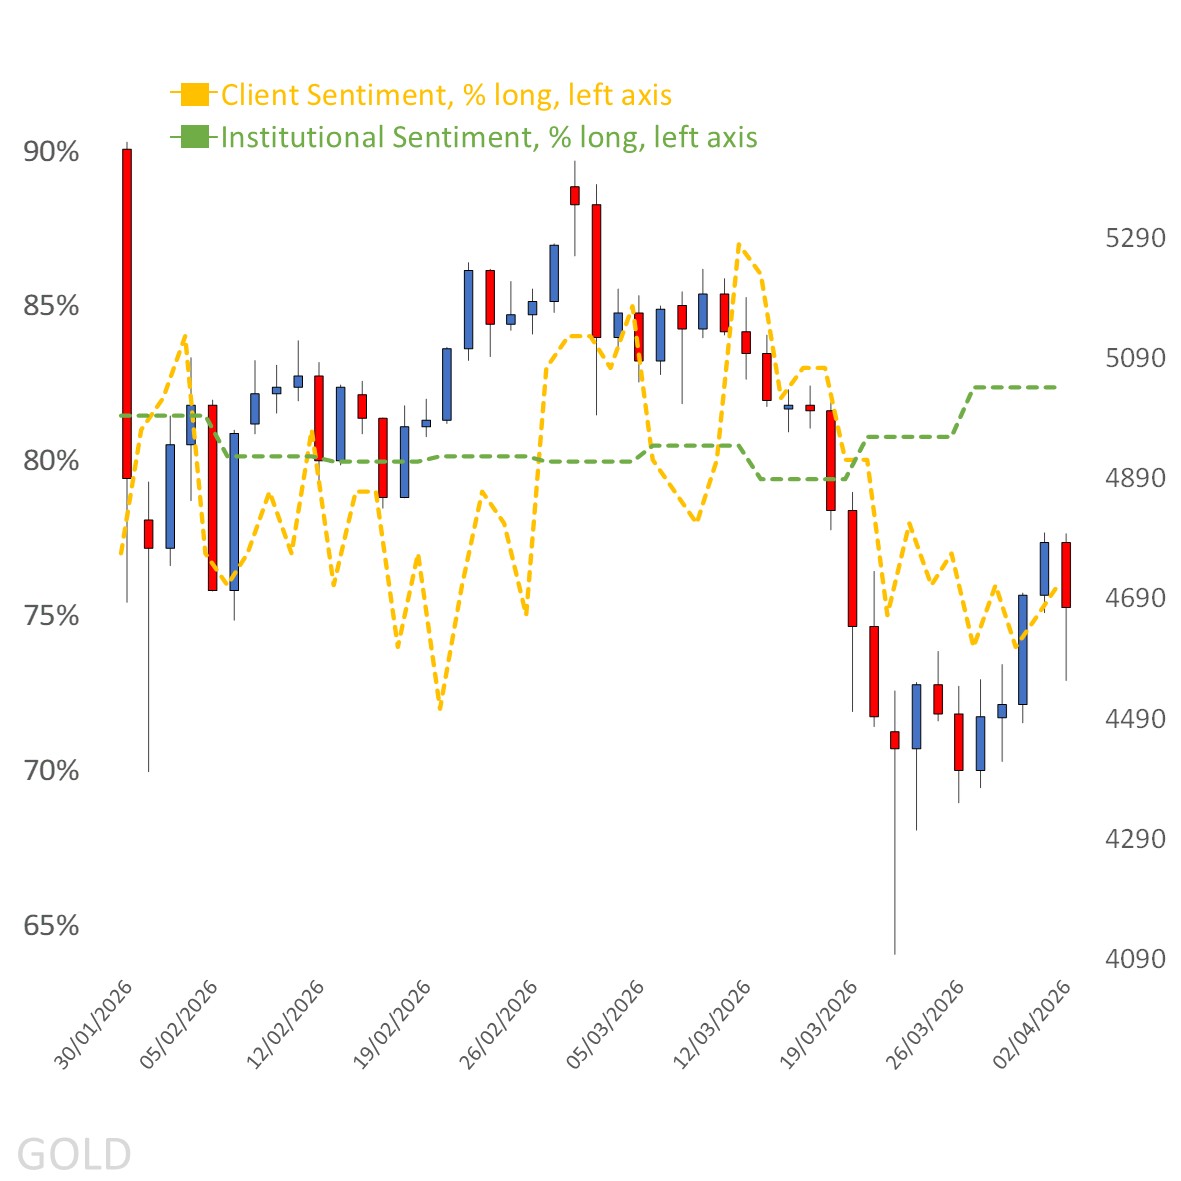
Period: January 2026 – April 2026
Past performance is not an indicator of future results.
Gold’s chart on Capital.com’s platform with key technical indicators
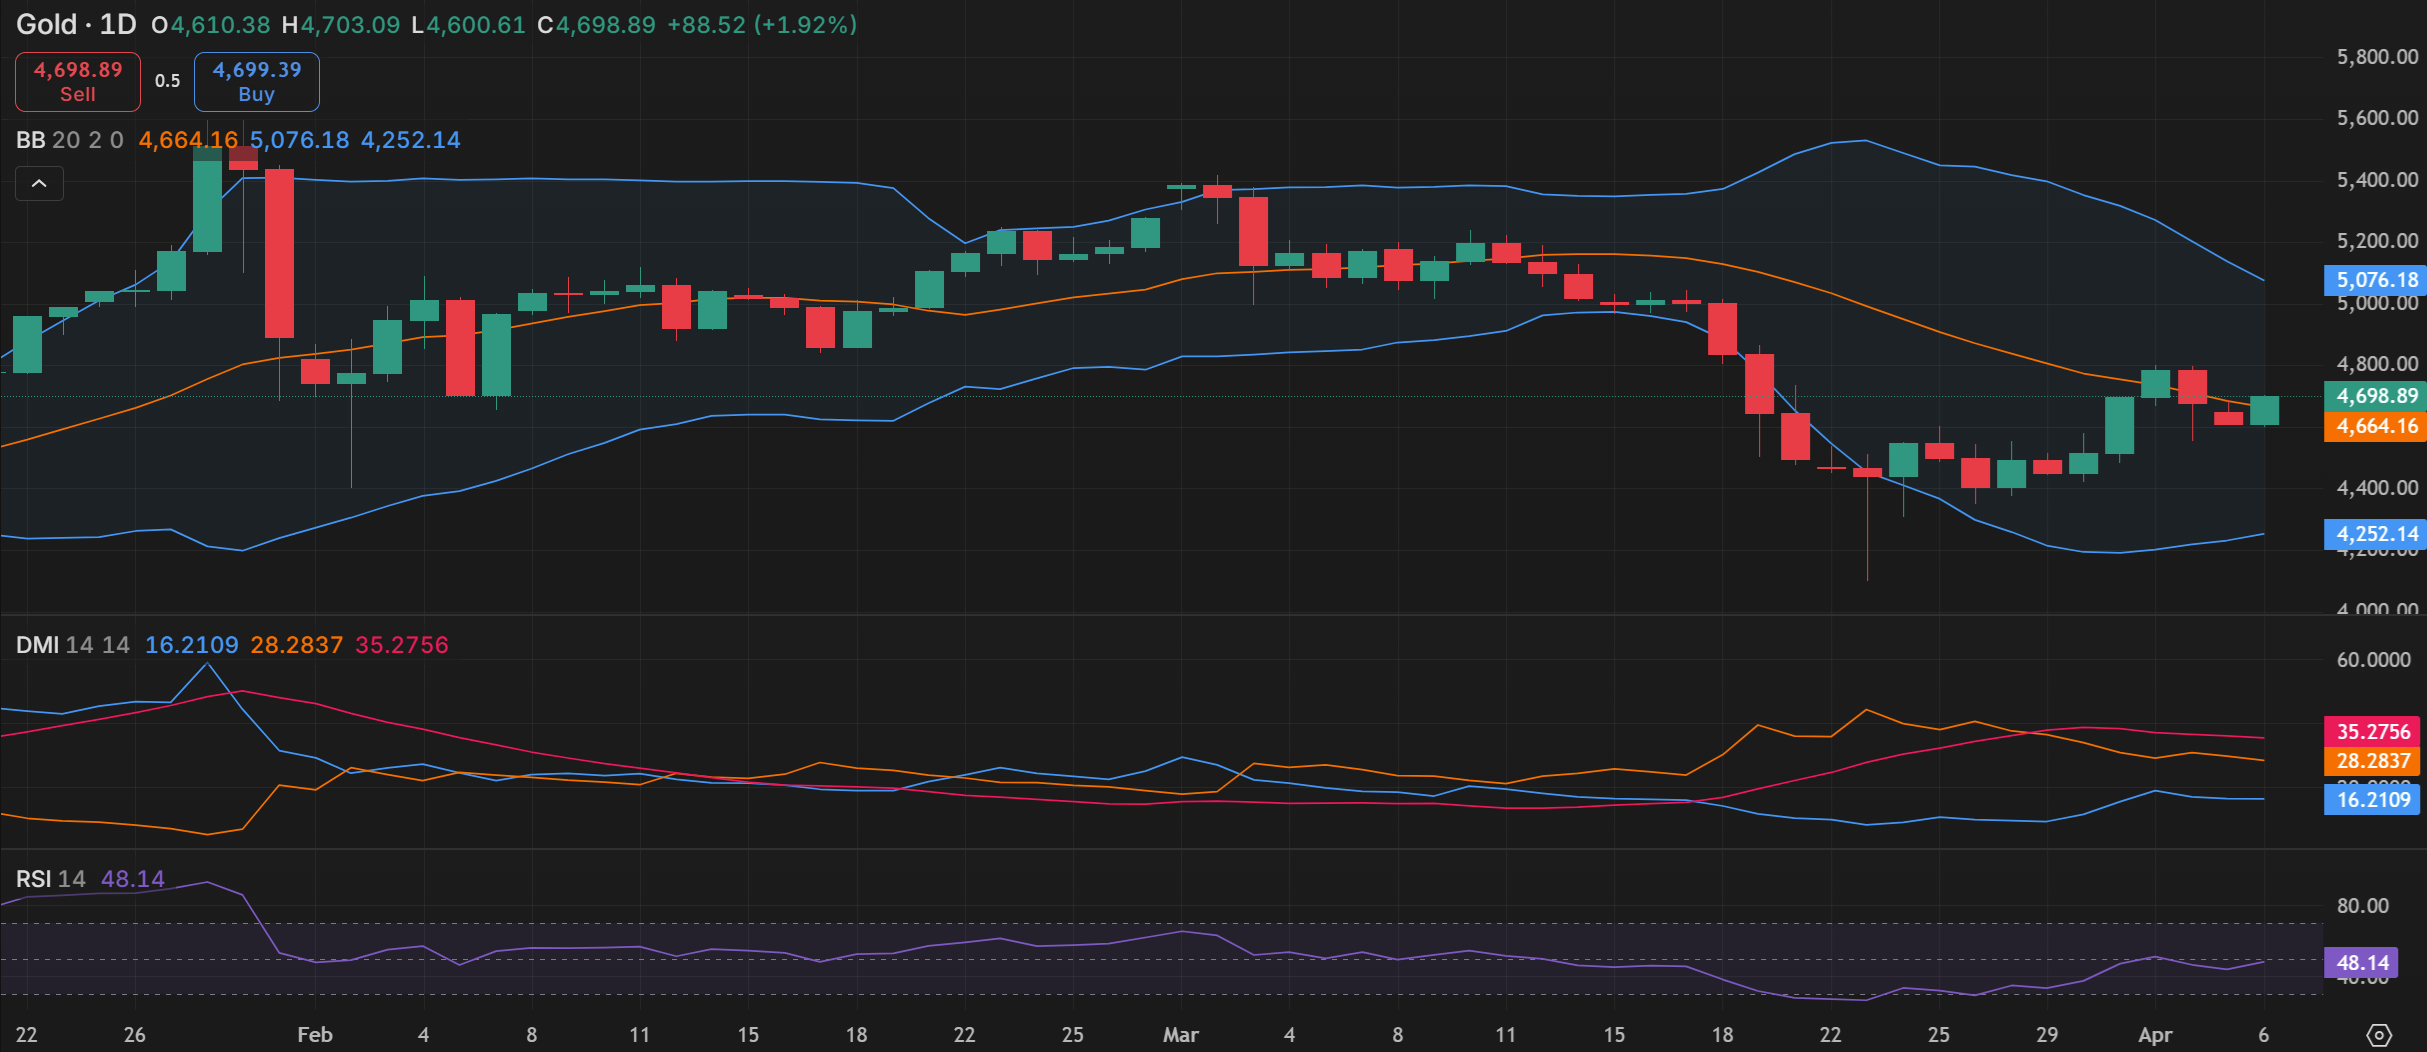
Source: Capital.com
Period: January 2026 – April 2026
Past performance is not an indicator of future results.