Trading the Dow 30 After a Weak NFP
The technical overview remains unchanged in both daily and weekly time frames, while in sentiment CoT speculators raised their net sell bias.
US equity index futures are climbing after what was a session of light losses for the Dow 30 (-0.5% to 45,400) but where the tech-heavy Nasdaq 100 (w/w +0.2% to 23,652) and small-cap Russell 2000 (w/w +0.4% to 2,391) both avoided a red weekly finish. It was a turbulent Friday session where the attention was on the latest figures out of the labor market.
US Non-Farm Payrolls (NFP) showed growth of only 22K in August far beneath 75K expectations, and where the revision was a bit frightening for June suffering a 13K loss. The unemployment rate rose a notch to 4.3% with a larger increase for the U6 underemployment rate reaching 8.1%, its highest since 2021. Other key figures included the labor force participation rate rising to 62.3%, and wage growth at 0.3% m/m (month-on-month) and 3.7% y/y (year-on-year).
A weaker labor market is a test for the Federal Reserve (Fed’s) dual mandate having to struggle with inflation above target, and means it’ll be a balancing act here on out. Over in the bond market, Treasury yields ended the week notably lower suffering further losses following the weaker NFP print and where bond traders preferred to latch onto a weakening labor market over above-target inflation, and where market pricing (CME’s FedWatch) cemented a 25bp (basis point) rate cut in September with a minority going for a larger 50bp reduction, and via majority sees further 25bp rate cuts each in October and December. There was the Fed’s Goolsbee still undecided regarding the September decision as he wants to ensure the recent services inflation uptick is only a blip.
Week ahead
That makes the week ahead a crucial one. It starts off light today with consumer credit for the month of July and will remain light tomorrow with a couple of usually low-impacting items, but then it picks up on Wednesday with pricing data out of the US starting with producer prices. It came in hot last time showing 0.9% m/m growth, and given it front-runs consumer prices is something market participants will no doubt note. Speaking of which, CPI (Consumer Price Index), the big one for this week, that’s on Thursday where expectations are 0.3% m/m growth for both headline and core. And lastly, on Friday, preliminary consumer sentiment and inflation expectations out of UoM (University of Michigan) where the former has been averaging lower while the latter is well above the Fed’s comfort level.
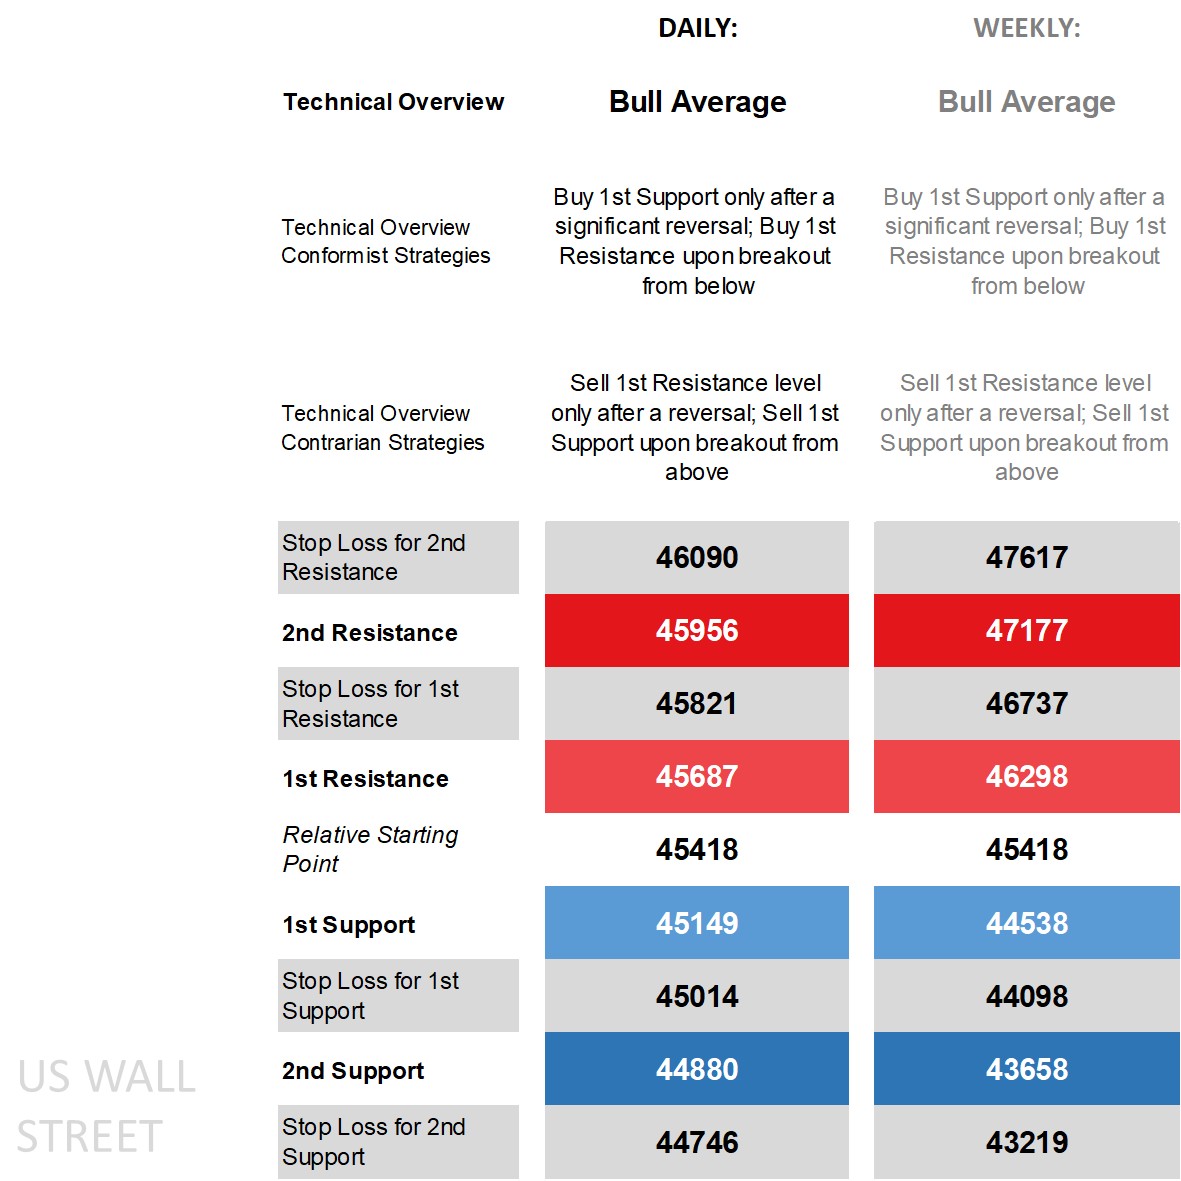
Dow 30’s technical overview, strategies and levels
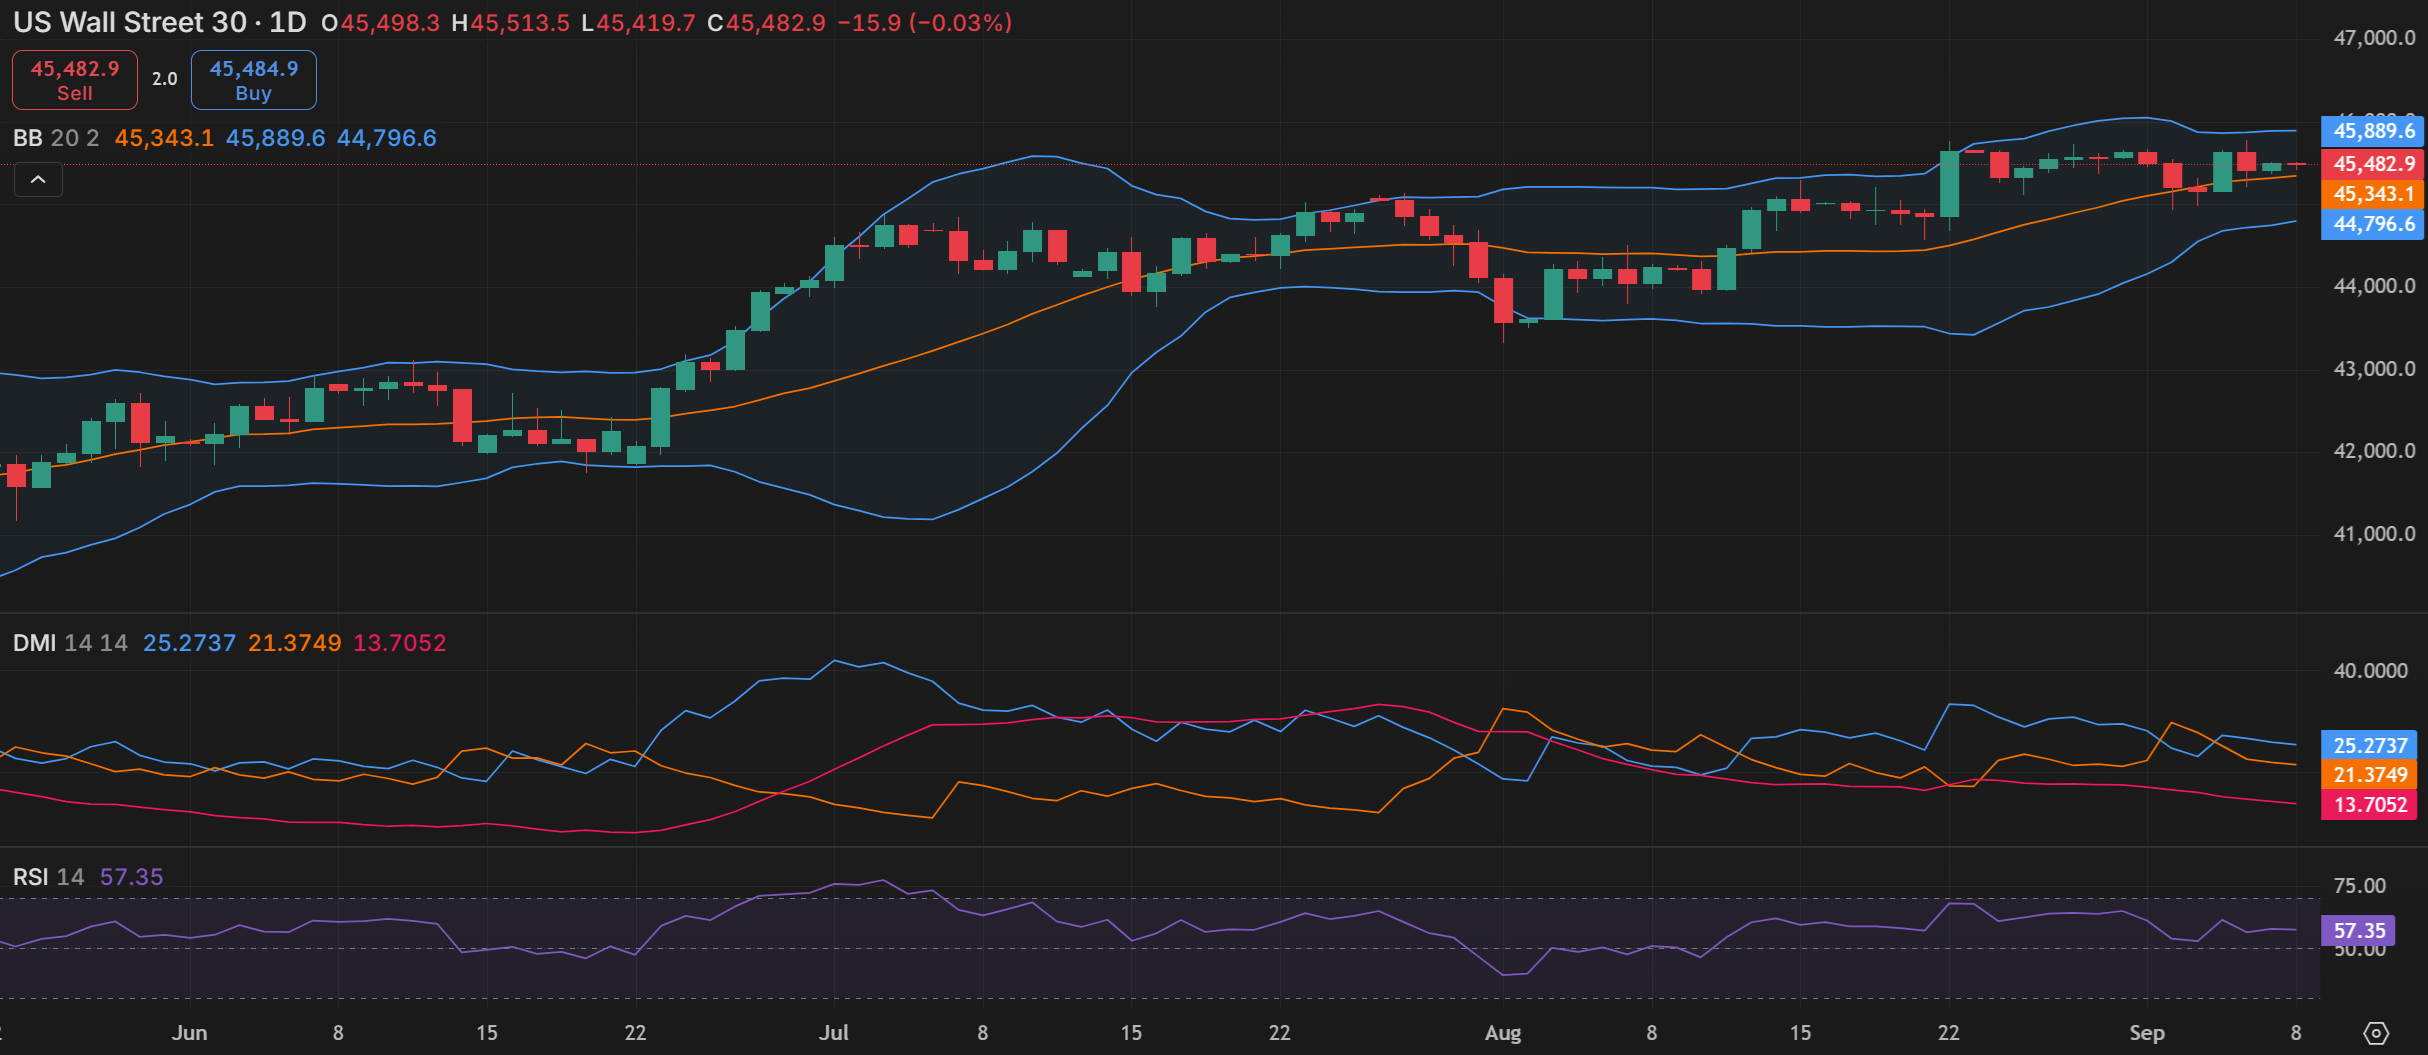
Looking at the daily time frame and price is above all its main long-term main moving averages (MA), on the DMI (Directional Movement Index) front close proximity between the +DI over the -DI but not enough to label it as positive, an RSI (Relative Strength Index) not too far off the middle, and an ADX (Average Directional Movement Index) in non-trending territory. That makes it closer to a stalling bull, with wider ranges and longer-term bullish bias keeping the overview a ‘bull average’ where there’s added caution buying on any pullback to the daily 1st Support level doing so only after a significant reversal should price drop significantly beneath it and recover. Those who feel we’re near the top have contrarian sell strategies to contend with, be it via reversal off the 1st Resistance or sell-breakout off the 1st Support.
Zooming out to the weekly time frame and the technicals are also closely huddled to each other and lacking a significant signal, still holding as ‘bull average’ here as well and more so after it recovered from ‘Liberation Day’ losses. It also means identical strategies for conformist and contrarian traders but where the levels are larger from the Relative Starting Point since we’re dealing with the longer-term weekly time frame.
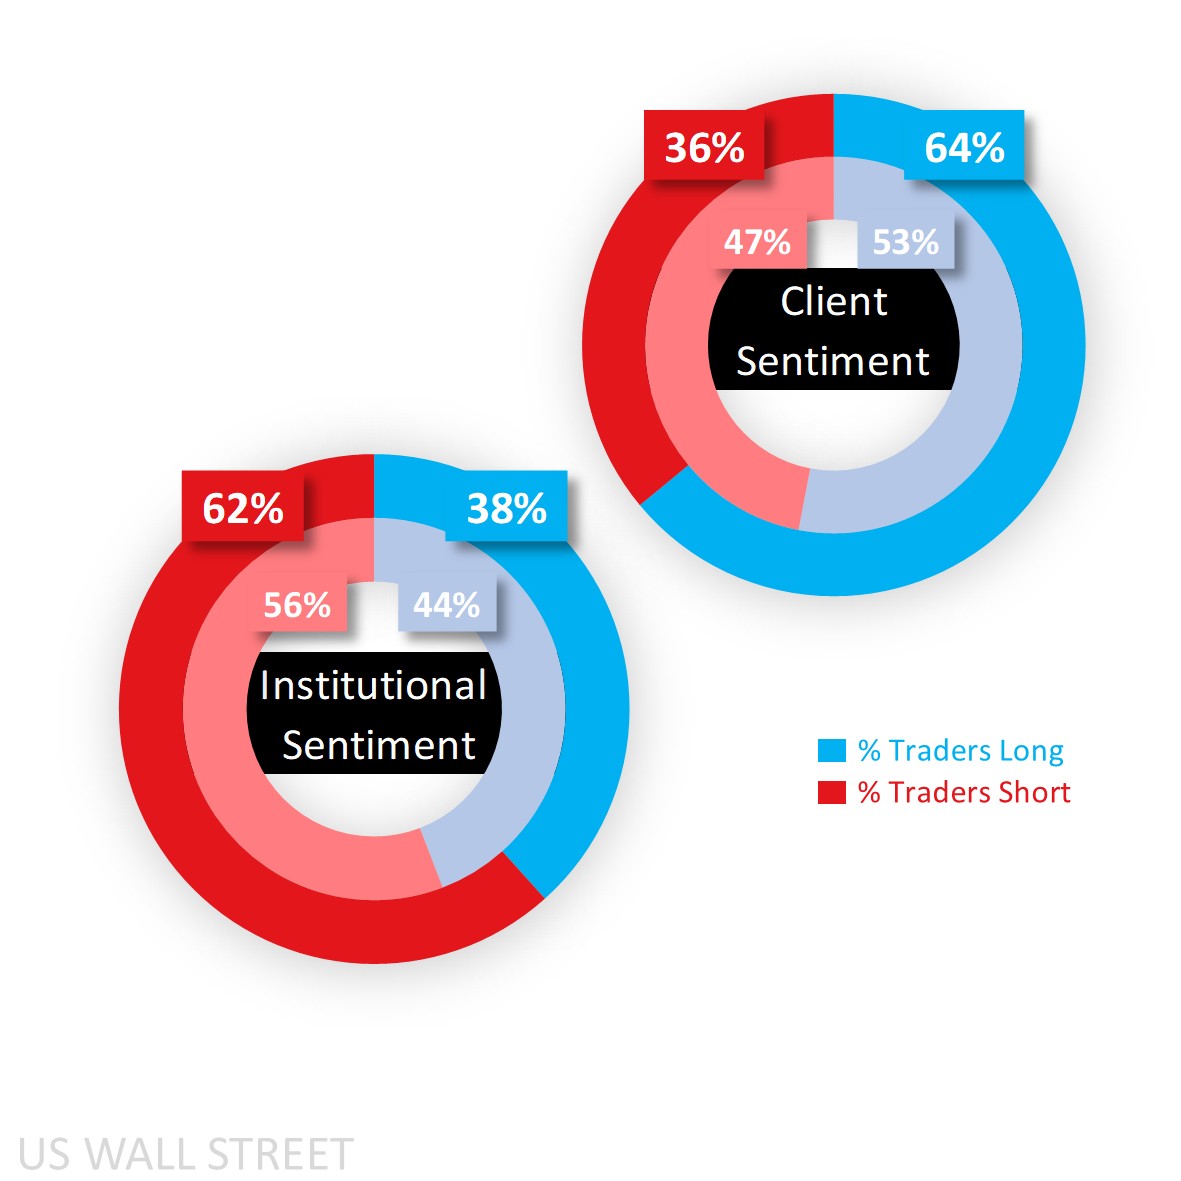
Capital.com’s client sentiment for Dow 30
As for sentiment, Capital.com’s clients have raised their majority long bias from what was a slight buy 53% to just shy of heavy long territory at 64% as of this morning and goes to show how the smallest of pullbacks in price the likes of which we saw last Friday can result in significant moves on the sentiment front.
CoT (Commitment of Traders) speculators were net short and raised it from 56% to 62% as of last Tuesday due to a reduction in longs (3,073 lots) far outdoing the drop in shorts (by 1,220) and taking the net sell bias to levels unseen in months.
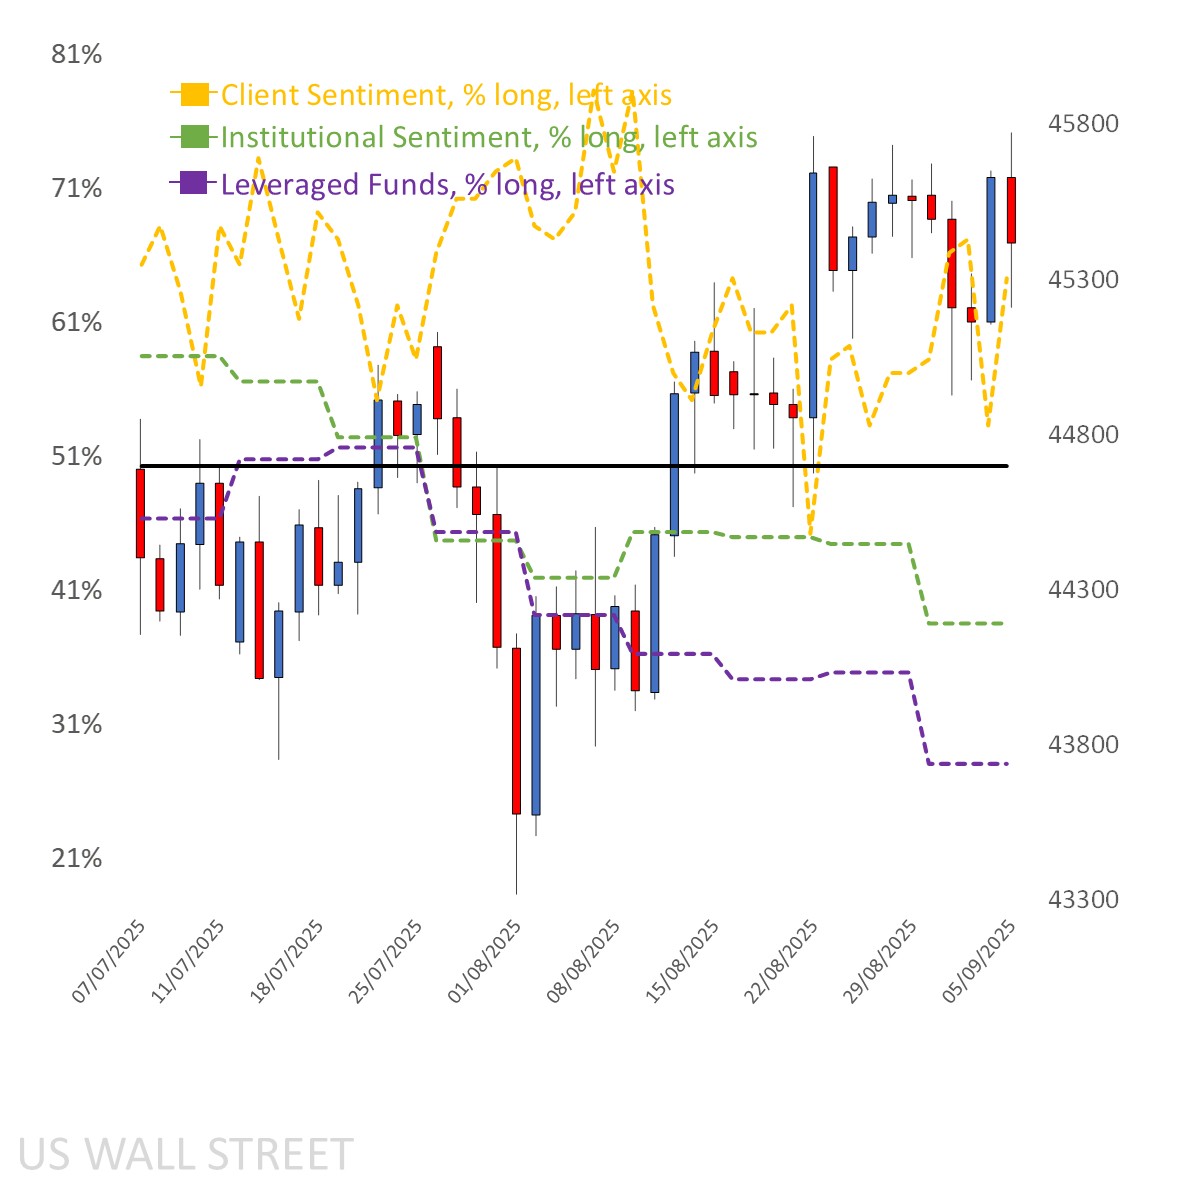
Client sentiment mapped on the daily chart
 Source: Capital.com
Period: JULY 2025 – AUGUST 2025
Past performance is not an indicator of future results.
Dow 30’s chart on Capital.com platform with key technical indicators
 Source: Capital.com
Period: MAY 2025 – AUGUST 2025
Past performance is not an indicator of future results