Trading the Dow 30 After its 46,000 Breach
Recent record high as kept its technicals bullish in both time frames, but on the CoT sentiment front there’s been a notable increase in net short bias.
US equity index futures are in slight retreat after a week that involved record highs for the S&P 500 (w/w +0.9% to 6,664), Nasdaq 100 (w/w +1.8% to 24,626), Dow 30 (w/w +1% to 46,315), and Russell 2000 (w/w +1.9% to 2,448). A key catalyst that has helped risk appetite has been optimism on the rate reduction front following last Wednesday’s FOMC (Federal Open Market Committee) event that resulted in a rate reduction, with market pricing (CME’s FedWatch) not far off fully pricing in another 25bp (basis point) rate cut in October and via significant majority in favor of a third one in December.
There have been a few FOMC members speaking since then, including the Federal Reserve’s (Fed) Kashkari that “the risk of a sharp increase in unemployment warrants the committee taking some action to support the labor market”, Daly on the job market softening partly due to the economic outlook, and Miran that President Trump didn’t pressure him on how to vote and that in their conversation didn’t talk “about how I vote” nor “about my dots”.
Week ahead
And with the absence of any impacting data, it’ll be about more FOMC members speaking today before Fed Chairman Powell tomorrow, with plenty more scheduled to speak later this week. Those looking for notable data have got preliminary manufacturing and services PMIs (Purchasing Managers’ Index) tomorrow and a plethora of data on Thursday including final Q2 GDP (Gross Domestic Product), durables and the weekly claims, with the attention shifting to PCE (Personal Consumption Expenditures) price index on Friday.
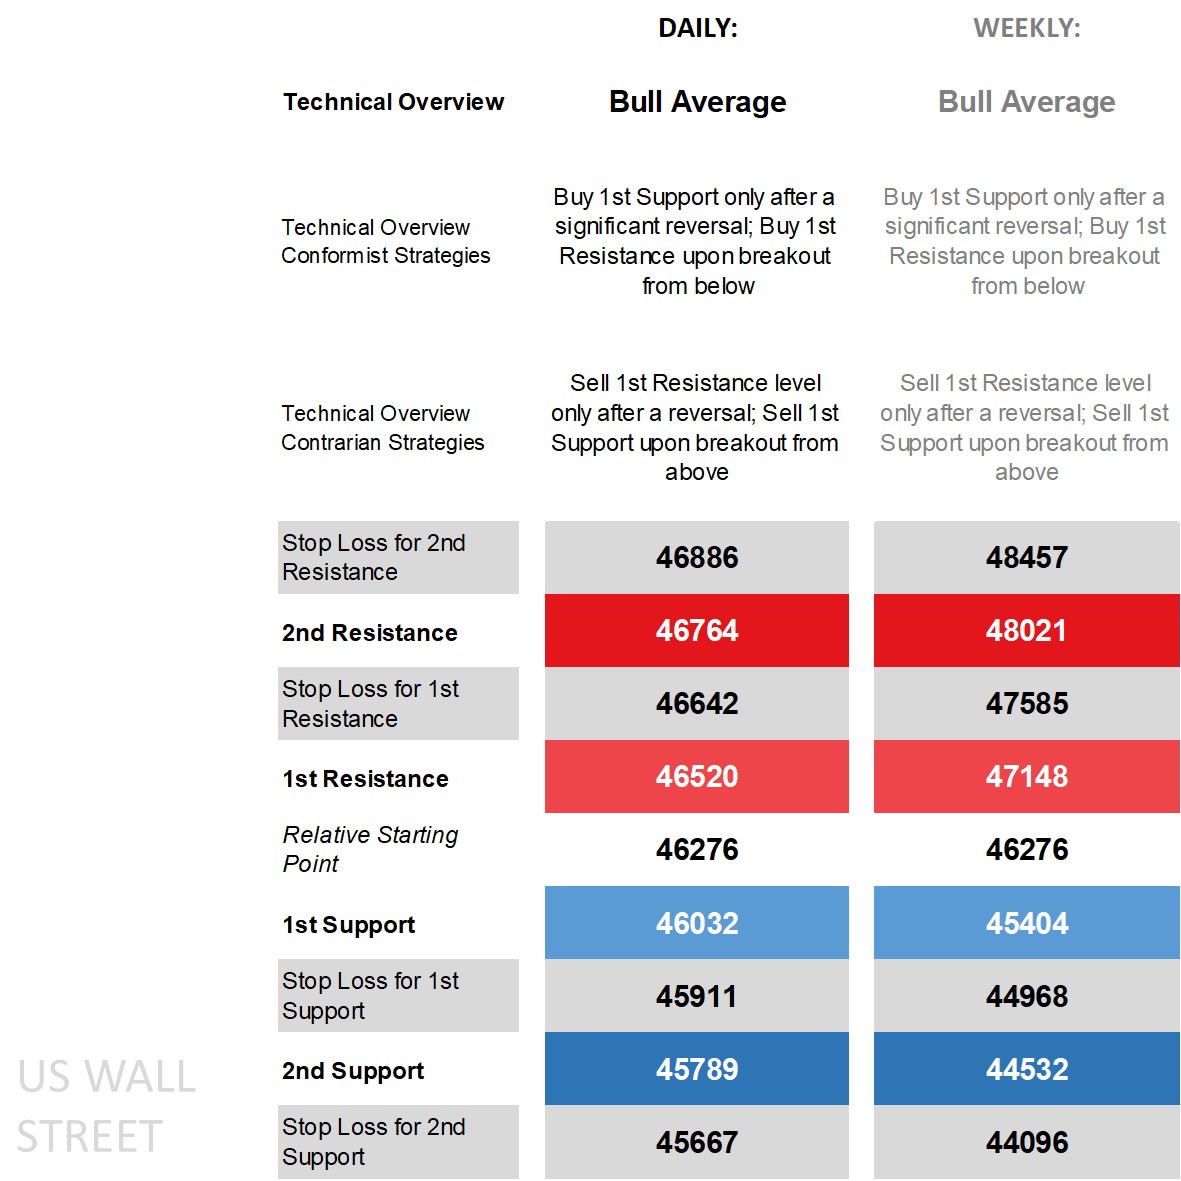
Dow 30’s technical overview, strategies and levels
Looking at the daily time frame and price above its main moving averages (MA), coming off the upper end of the band, on the DMI (Directional Movement Index) front the +DI well above the -DI enough to label it as positive, an RSI (Relative Strength Index) near but not in overbought territory, and an ADX (Average Directional Movement Index) by one calculation already in trending territory.
It’s net positive on the technical front and working within a relatively narrow bull channel keeping the technical overview more ‘bull average’ then a ‘stalling bull trend’. That means added caution buying off the 1st Support level for conformist traders who see the overview holding doing so only after a significant reversal should price go beneath it by a sizable amount and mount a recovery, while contrarian traders have got sell strategies be it via reversal off the 1st Resistance or sell-breakout strategies off the 1st Support. Zooming out to the weekly time frame and the technical overview is also ‘bull average’ but where the ‘Liberation Day’ announcement threw a wrench into its technicals earlier this year before the recovery that ensued. This also means added caution for conformist buys off the weekly 1st Support and identical strategies for conformist and contrarian strategies albeit off wider levels for the weekly given the longer-term time frame.
Capital.com’s client sentiment for Dow 30
Client sentiment was and remains majority long but has fallen back from 62% on Friday morning to 56% at the start of this week as some longs got enticed into closing while some fresh shorts initiated at key technical levels anticipating a pullback off recent highs.
The more interesting positioning change was on the CoT (Commitment of Traders) front, with speculators according to the latest report out of the CFTC showing net sell bias rise among them notably from a slight sell 54% to a heavy 71% due to a reduction in longs (by 4,045 lots) and a simultaneous increase in shorts (3,661). The surprise here is that CoT speculators in the Dow usually go with the move with a chunk of it momentum traders, and therefore price increases and record highs would normally see long bias rise but instead the opposite has been occurring in the latest run higher from around July onwards.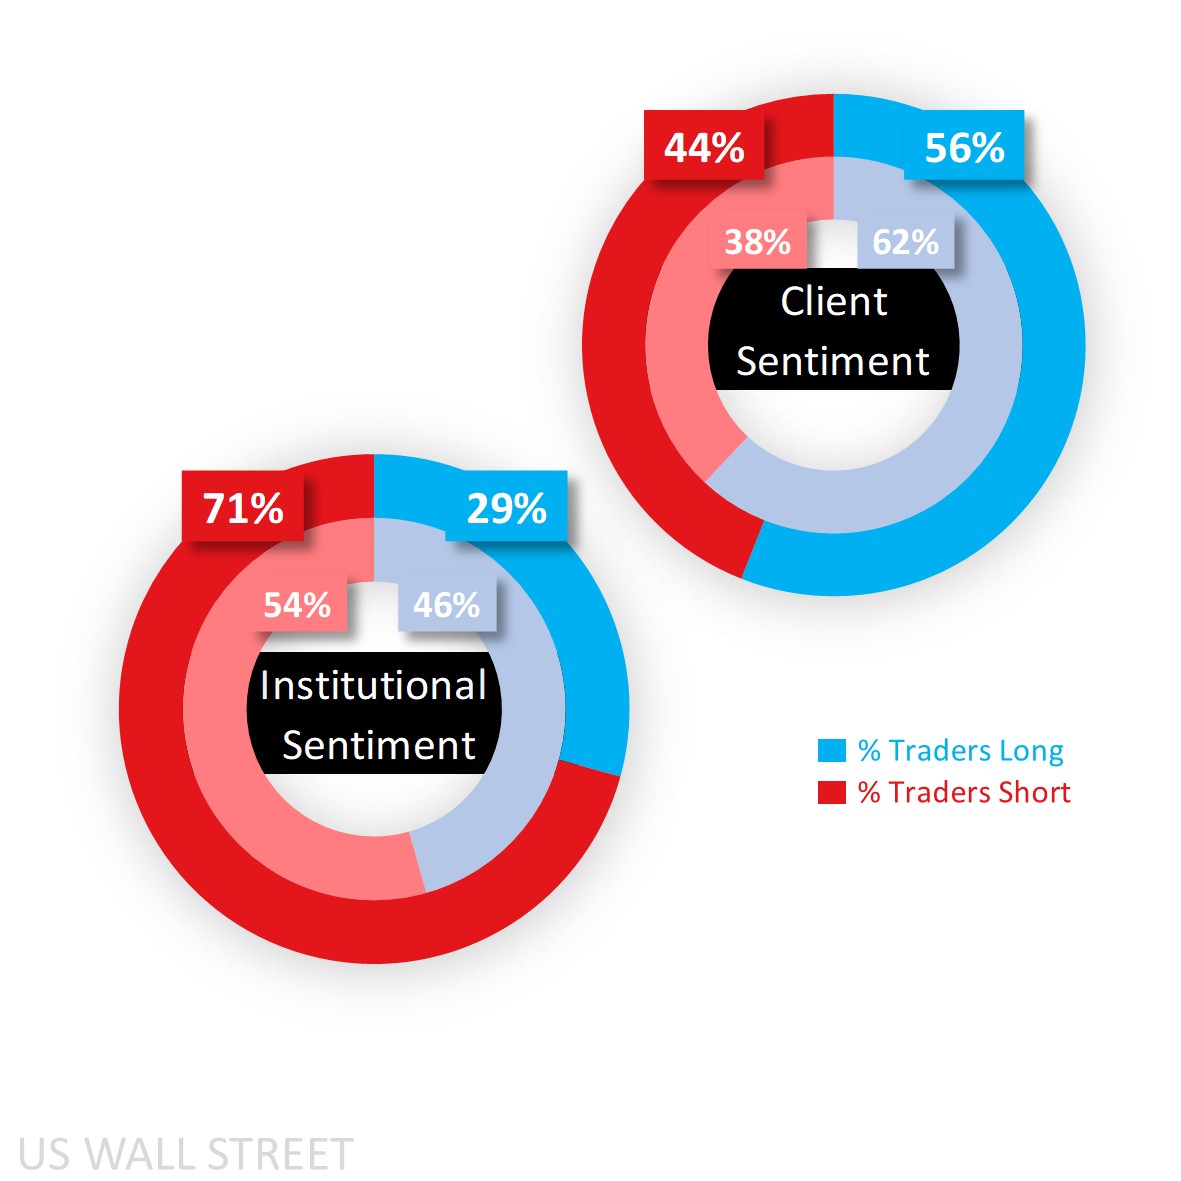
Client sentiment mapped on the daily chart
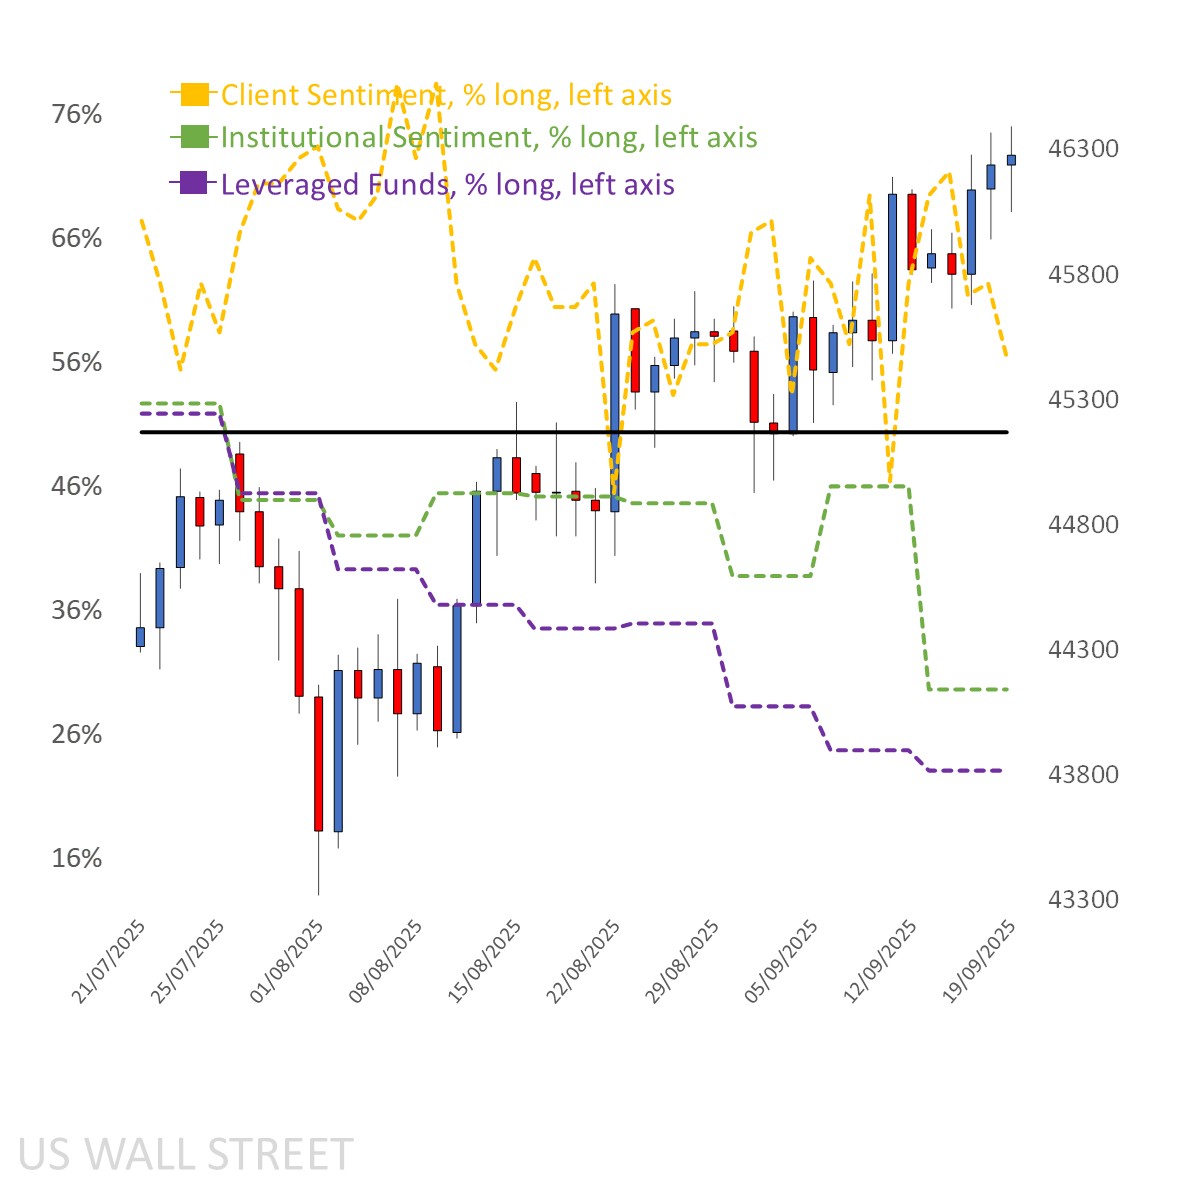
Source: Capital.com
Period: JULY 2025 – SEPTEMBER 2025
Past performance is not an indicator of future results.
Dow 30’s chart on Capital.com platform with key technical indicators
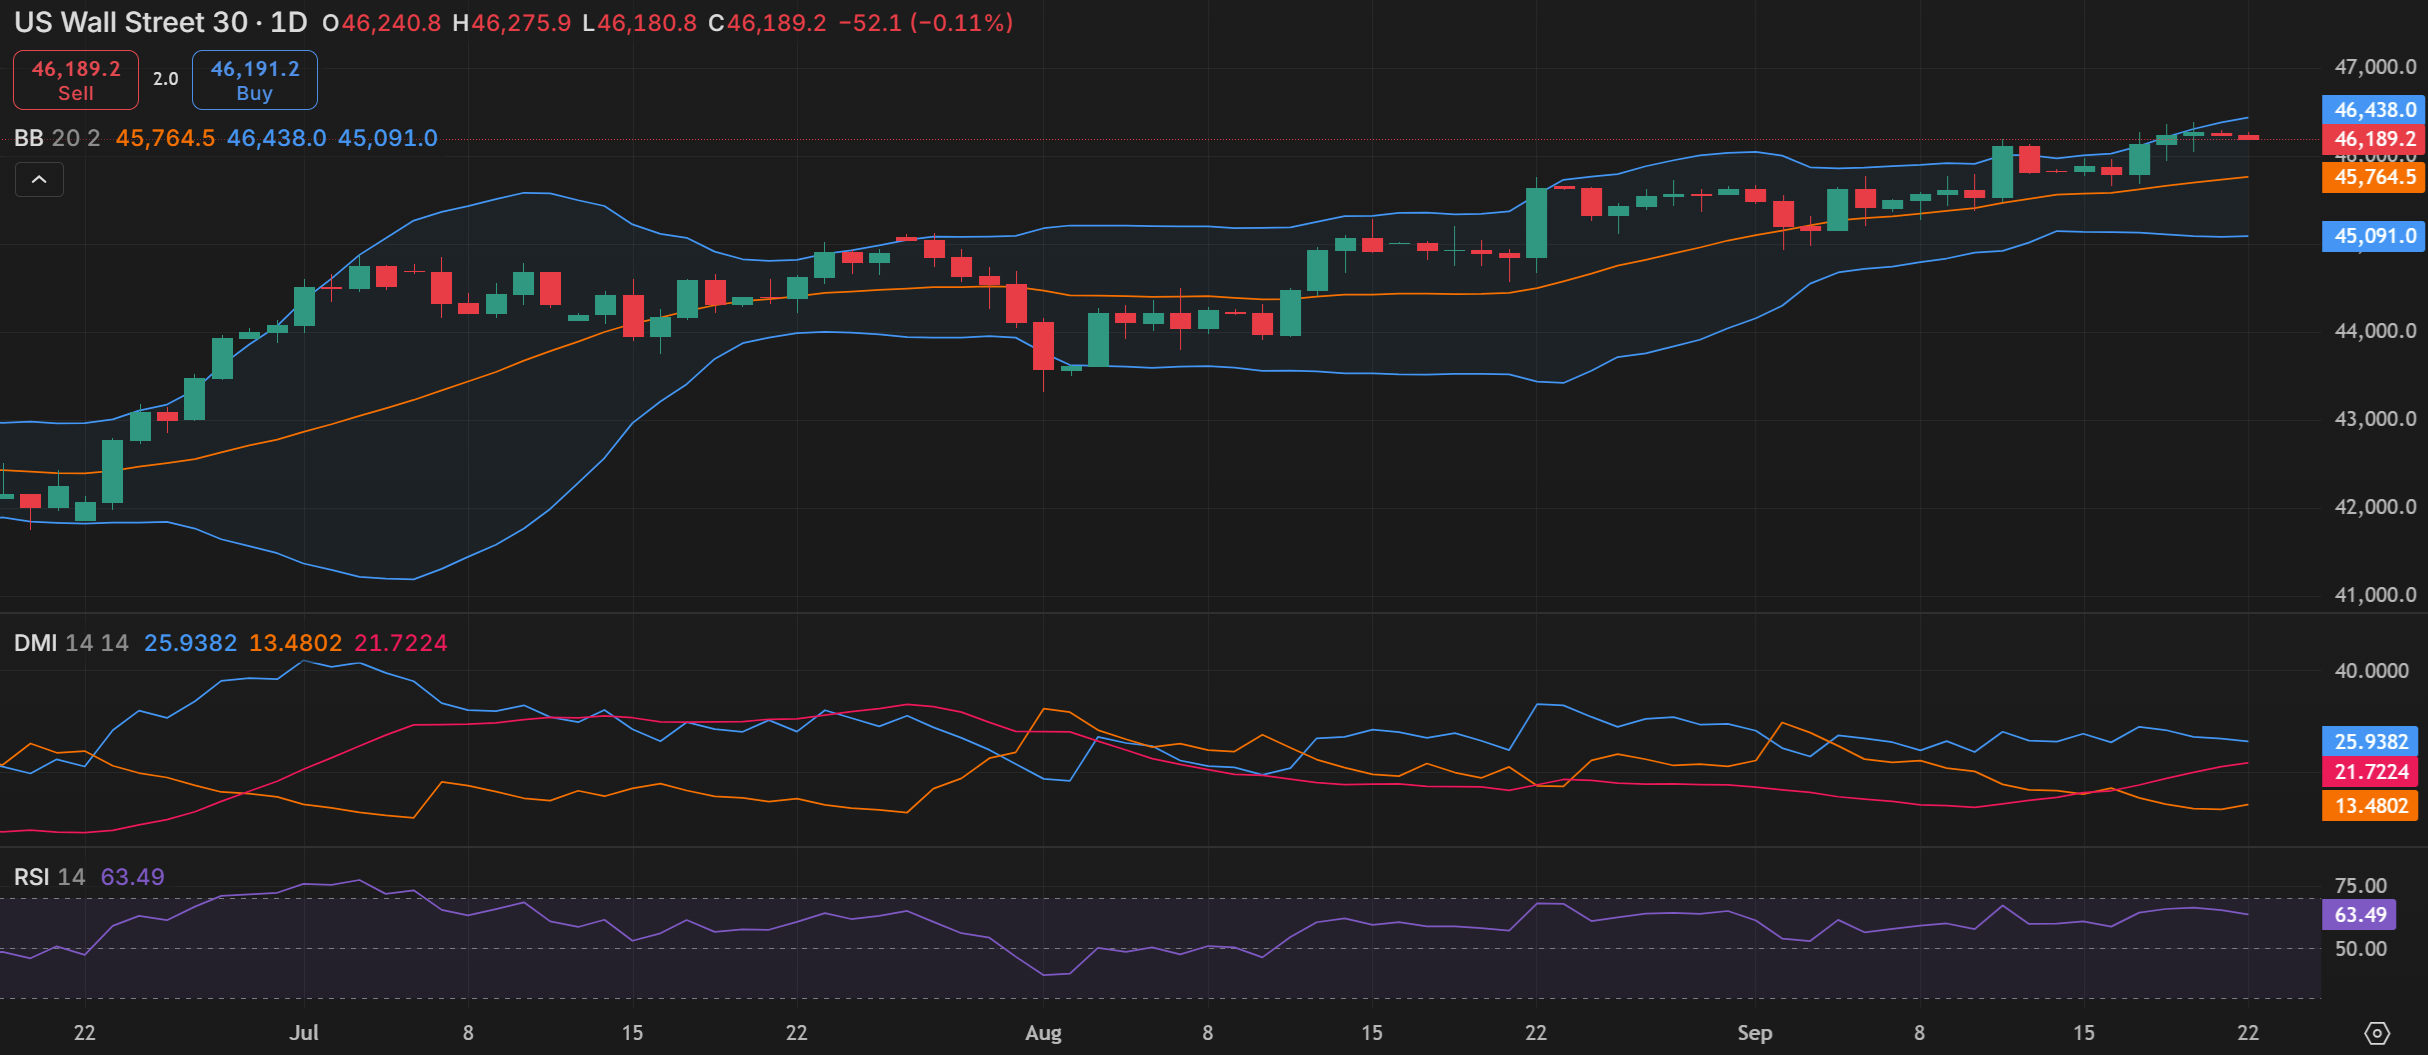
Source: Capital.com
Period: JUNE 2025 – SEPTEMBER 2025
Past performance is not an indicator of future results