

Lufthansa stock forecast: Third-party price targets
Deutsche Lufthansa AG is one of Europe’s largest airline groups and a long-established constituent of regional equity markets.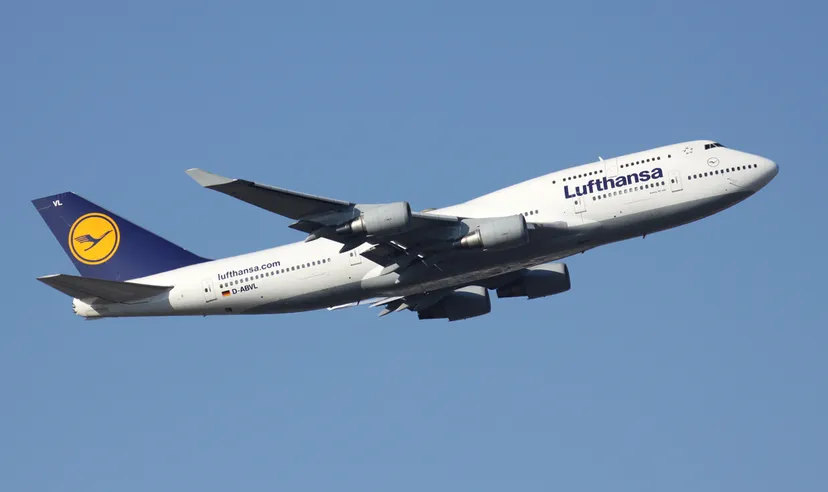
Deutsche Lufthansa AG (LHA) is trading around €8.78 as of 2:47pm UTC on 12 January 2026, after moving between an intraday low of €8.675 and a high of €9.03 during the current session, based on Capital.com pricing data. Past performance is not a reliable indicator of future results.
The share is trading amid reports that Lufthansa plans to resume flights to Tehran on 16 January after a months-long suspension, following coverage of the decision in recent airline and market updates (MarketScreener, 12 January 2026). This development sits alongside ongoing adjustments across the group’s route network, including previously announced reductions to some domestic German services from summer 2026 (VisaHQ, 30 October 2025). In parallel, sector-level data show that overall European airline seat capacity in January 2026 is higher year on year, providing broader context for the demand and capacity environment in which Lufthansa operates (OAG, 12 January 2026).
Lufthansa stock forecast 2026–2030: Third-party price targets
As of 12 January 2026, third-party Lufthansa stock predictions
Analyst price targets for Lufthansa AG compiled in late 2025 and early 2026 indicate a wide range of one-year views on the stock, reflecting differences in methodology, coverage scope, currency denomination and listing line. These figures represent third-party opinions and may differ from Capital.com pricing, which reflects Lufthansa AG stock CFDs quoted in euros on the Capital.com platform as of 12 January 2026.
Across the sources below, targets are presented as published consensus snapshots rather than forward-looking guarantees.
Fintel (aggregated consensus)
The latest monthly update shows an average one-year LHA stock forecast of €7.87, with individual analyst forecasts ranging from €5.45 to €12.60, based on the primary Frankfurt listing. Fintel notes that this spread reflects differing assumptions around earnings performance and valuation, with the average updated on a rolling monthly basis as broker estimates change (Fintel, 14 December 2025).
Investing.com (consensus screen)
Data from Investing.com indicate that, over the past three months, around 19 LHA stock forecasts have set an average 12-month target around €8.30, bounded by a low estimate of €6 and a high of €12. The platform highlights that this consensus combines buy, hold and sell ratings and is presented as a statistical summary rather than a single institutional view (Investing.com, 12 January 2026).
MarketWatch (ADR analyst estimates)
For the New York-listed ADR, MarketWatch reports that analysts’ targets cluster around an average of approximately $9.84, with a high estimate of $13.92 and a low of $6.90 over a one-year horizon. These figures are cited as a distribution of registered analyst estimates in US dollars, with individual assumptions linked to factors such as earnings outlook, balance-sheet considerations and peer comparisons (MarketWatch, 8 January 2026).
MarketBeat (ADR coverage snapshot)
A MarketBeat update on Lufthansa’s ADR line notes that some analysts have discussed a one-year high price target near $19.20, set against a prevailing price in the mid-single-digit dollar range at the time. MarketBeat attributes this dispersion to a mix of rating changes and house-specific views, including differing assessments of capacity plans, demand trends and valuation multiples (MarketBeat, 6 January 2026).
Stockscan.io (DLAKF forecast aggregation)
Stockscan.io’s DLAKF stock forecast references an average 12-month price target around $33, with reported estimates spanning from $26.30 to $39.97. The service notes that these figures are derived from a relatively small analyst sample and that any implied upside percentages are mechanical calculations based on target prices and a snapshot spot level (Stockscan.io, 12 January 2026).
Predictions and third-party forecasts are inherently uncertain, as they cannot fully account for unexpected market developments. Past performance is not a reliable indicator of future results.
LHA stock price: Technical overview
The LHA stock price is near €8.78 as of 2:47pm UTC on 12 January 2026, with price holding above a rising cluster of simple moving averages, including the 20-, 50-, 100- and 200-day SMAs, located around €8.5, €8.1, €7.8 and €7.4 respectively. This configuration maintains a 20-over-50 alignment, often monitored by technical traders. The 10-day SMA near €8.7 and the Ichimoku base line around €8.6 sit just below spot, while the 20-day volume-weighted moving average near €8.6 reflects recent traded volumes.
Momentum indicators remain in the upper-neutral range, with the 14-day RSI close to 58.8 and the ADX around 34.7, suggesting an established trend rather than a sideways market. On the upside, the first reference point is the classic R1 pivot near €8.80, with R2 around €9.19 becoming relevant if prices hold above that area on a daily closing basis. On pullbacks, the classic pivot at approximately €8.37 provides initial support, followed by the 100-day SMA near €7.8 and the S1 level around €7.98 if that moving-average zone is breached (TradingView, 12 January 2026).
This technical analysis is provided for informational purposes only and does not constitute financial advice or a recommendation to buy or sell any instrument.
Lufthansa share price history (2024–2026)
LHA’s stock price has trended higher over the past two years, rising from around €6.20 in late December 2024 to approximately €8.79 by 12 January 2026, with several notable swings along the way. After trading largely within a €6.50–€7.20 range during early 2024, the stock declined towards €5.60 in September 2024 before recovering into year-end. It then advanced from the €5.60–€6.20 area in early 2025 to trade above €8.50 by the final weeks of the year. On 12 January 2026, LHA closed at €8.79, placing it well above levels seen one and two years earlier, but only modestly above the late-December 2025 close near €8.42, as recent price action has consolidated near the upper end of its two-year range.

Past performance is not a reliable indicator of future results. Share prices are indicative and may differ from live market prices.
Lufthansa (LHA): Capital.com analyst view
The LHA stock price has moved steadily higher over the past two years, increasing from the mid-€6 range in late 2024 to around €8.78 as of 12 January 2026, with periods of consolidation and pullbacks along the way. More recent trading has seen the stock hold above €8.50 and record intraday highs just above €9.00 in early January 2026, illustrating how shorter-term volatility has developed within a broader upward trend.
From a driver perspective, price behaviour has reflected a combination of company-specific developments, conditions across the European aviation sector and wider macroeconomic factors such as fuel costs and consumer demand. These influences can affect the share price in different ways, depending on whether they point to improved efficiency and revenue generation or, alternatively, to higher costs, softer demand or operational challenges. As a result, Lufthansa’s share price can respond to both supportive and adverse developments across these areas.
Capital.com’s client sentiment for Lufthansa CFDs
As of 12 January 2026, Capital.com client positioning in Lufthansa CFDs is currently skewed towards long positions, with 93.4% buyers versus 6.6%sellers. This places buyers ahead by approximately 88.7 percentage points. The data reflect open positions on the Capital.com platform and may change as positions are opened or closed.

Summary – Lufthansa stock price 2026
- During 2025, Lufthansa AG traded largely between €6.00 and €9.00, with the share price gradually moving higher over the course of the year.
- The stock began January 2025 near €6.18 and ended December around €8.42, indicating year-on-year gains.
- From October to December 2025, prices advanced from the mid-€7 range into the mid-€8s, briefly testing above €8.60–€8.70 towards year-end.
- Technical indicators showed the 20-, 50-, 100- and 200-day SMAs rising through 2025, with a 20-over-50 alignment and RSI remaining in the upper-neutral zone near 58.8 by early January 2026.
Past performance is not a reliable indicator of future results.