

AMC Entertainment stock forecast: record revenue, summer box office
AMC Entertainment is a US cinema operator whose latest results showed record quarterly revenue of about $1.6bn and a surprise adjusted profit, supported by a stronger summer box office. Explore third-party AMC price targets and technical analysis.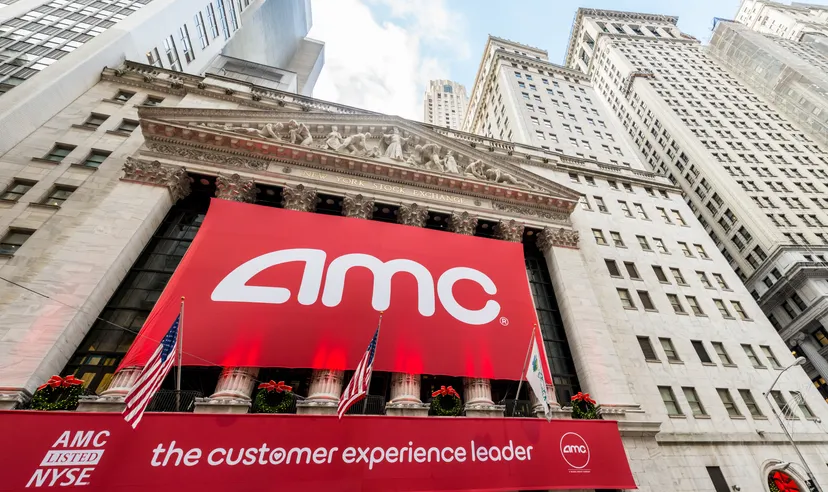
As of 11:01am UTC on 23 July 2026, AMC Entertainment Holdings, Inc. (AMC) was trading at $2.25, within an intraday range of $2.16–$2.38. Past performance is not a reliable indicator of future results.
The stock found support after last week's second-quarter results, in which the cinema operator reported record quarterly revenue of approximately $1.6bn and a surprise adjusted profit of $0.14 per share, compared with analysts' forecasts for a loss (The Spokesman-Review, 20 July 2026). A strong summer box-office slate supported attendance, with releases including 'The Super Mario Galaxy Movie' and 'Obsession' (MarketScreener, 19 July 2026). Shares also built on the previous session's 26.8% rise (Investing.com, 20 July 2026). Debt refinancing and balance-sheet repair remain central to the company's efforts to address its capital structure (Bloomberg, 29 January 2026).
Third-party AMC outlook after record Q2 2026 results
As of 23 July 2026, third-party AMC Entertainment stock predictions vary across sources, reflecting differing views on the pace of the cinema chain's earnings recovery.
Investing.com (consensus estimates)
Investing.com projects an average 12-month price target of $2.24 for AMC Entertainment based on six analysts, with a high estimate of $3 and a low of $1.20. This range reflects differing expectations about how quickly debt refinancing and a box-office recovery could support sustained profitability (Investing.com, 20 July 2026).
AltIndex (AI model forecast)
AltIndex's AI model assigns AMC Entertainment a six-month price target of $1.95, which was below the prevailing share price when the forecast was captured. The model draws on more than 25 alternative-data signals and classifies the near-term outlook as 'Hold' (AltIndex, 23 July 2026).
TradersQuant (model-based forecast)
TradersQuant sets a 12-month base-case forecast of $1.64 for AMC Entertainment, with a bear case of $0.83 and a bull case of $2.79. Its base case was below the reference price at the time of capture, with the model balancing smart-money and short-interest signals against recent price volatility (TradersQuant, 20 July 2026).
MarketBeat (consensus estimates)
MarketBeat reports a consensus 12-month price target of $2.53 for AMC Entertainment across ten analysts, with a high target of $4 and a low of $1.20. The consensus target was above the reference price at the time of capture, while individual ratings ranged from strong buy to sell (MarketBeat, 21 July 2026).
Public.com (analyst consensus)
Public.com reports a price target of $2.34 for AMC Entertainment, alongside a consensus Hold rating from five covering analysts. The target was close to the prevailing share price when captured, although individual ratings ranged from strong buy to strong sell (Public.com, 22 July 2026).
Predictions and third-party forecasts are inherently uncertain, as they cannot fully account for unexpected market developments. Past performance is not a reliable indicator of future results.
AMC latest earnings and upcoming report
AMC Entertainment reported its second-quarter 2026 results before the market opened on 20 July 2026, after announcing the release date in a Business Wire statement on 15 July 2026 (Business Wire, 15 July 2026). The theatre chain posted quarterly revenue of $1.6bn, up 14.2% year on year, alongside adjusted earnings per share of $0.14, compared with a consensus forecast for a loss (MarketBeat, 21 July 2026). Adjusted EBITDA rose to $321.4m, with its margin expanding to 20.1%, while free cash flow reached $190.1m as AMC moved towards its full-year positive cash-flow objective (Public.com, 19 July 2026).
Shares rose 26.8% in the session following the announcement, closing at $2.46, before declining in subsequent sessions (Investing.com, 20 July 2026). By 23 July 2026, the stock was trading at $2.25, within the $2.15–$2.60 range recorded since the results (MarketChameleon, 22 July 2026).
AMC has not yet confirmed the date of its next quarterly report. Third-party earnings calendars provide differing estimates: MarketBeat indicates an announcement around 10 August 2026 (MarketBeat, 21 July 2026), Wall Street Horizon lists an unconfirmed date of 20 October 2026 (Wall Street Horizon, 22 July 2026), and Investing.com indicates a provisional date of 11 November 2026 (Public.com, 19 July 2026). These dates remain estimates based on historical reporting patterns rather than company guidance.
AMC stock price: technical overview
On the daily chart as of 23 July 2026 at 11:01am UTC, the AMC stock price is trading above its 20-day, 50-day, 100-day and 200-day simple moving averages (SMAs), which TradingView places at approximately $2.06, $1.91, $1.61 and $1.81, respectively. The 20-day SMA remains above the 50-day SMA, while the 200-day exponential moving average (EMA) stands slightly higher than the equivalent SMA, at about $1.99.
The 14-day relative strength index (RSI) is near 56, within upper-neutral territory, while the 14-day average directional index (ADX) reads 19. Together, these readings suggest moderate momentum but no firmly established trend.
The nearest classic resistance pivot above the latest price is R1 at $2.67, followed by R2 at $3.43. On the downside, the classic pivot point at $2.19 marks the first reference below the latest price, with the 100-day SMA near $1.61 providing a more distant technical reference.
According to TradingView data, a daily close above $2.67 could bring $3.43 into focus, while a close below $2.19 could shift attention towards the 100-day SMA near $1.61. The Hull moving average (9) stands at about $2.33, close to the latest price and providing a short-term reference alongside the broader SMA cluster (TradingView, 23 July 2026).
This is technical analysis for informational purposes only and does not constitute financial advice or a recommendation to buy or sell any instrument.
AMC Entertainment share price history (2024–2026)
AMC’s stock price began the period trading above $5 in late July 2024, but a sustained decline through the autumn and into 2025 took the shares below $4 by year-end. The stock closed 2024 at $3.98.
AMC reached $4.11 in early January 2025 before a prolonged decline took the stock as low as $1.29 by mid-May, amid ongoing concerns over debt and dilution. The shares briefly rebounded to $4 on 27 May before reversing those gains. By early 2026, they had fallen below $1 and reached a low of $0.95 on 27 March.
The stock then recovered through the spring, reaching $2.73 on 22 June before volatility increased during the summer. It rose to $2.61 on 21 July following AMC’s second-quarter results, but subsequently eased to $2.25 by 23 July 2026.
At that level, AMC was approximately 43% lower year on year, although it remained well above its March 2026 low.

Past performance is not a reliable indicator of future results. Share prices are indicative and may differ from live market prices.
AMC Entertainment (AMC): Capital.com analyst view
AMC Entertainment’s share price performance in 2026 has reflected the interplay between the cinema chain’s debt reduction efforts and changing expectations for the box-office recovery. The stock’s rebound from its March low of $0.95 to above $2 coincided with stronger theatrical attendance figures.
Retail investor activity may also have contributed to the move, potentially increasing price fluctuations in both directions. Recent quarterly results included a surprise adjusted profit, although a single-quarter earnings beat does not necessarily indicate a sustained turnaround given the company’s broader debt load.
Looking ahead, continued improvement in box-office receipts could support the share price. Conversely, dilution, refinancing costs and macroeconomic conditions could weigh on it. AMC’s volatility means that relatively limited news flow can produce sharp movements in either direction. Past performance is not a reliable indicator of future results.
Capital.com’s client sentiment for AMC Entertainment CFDs
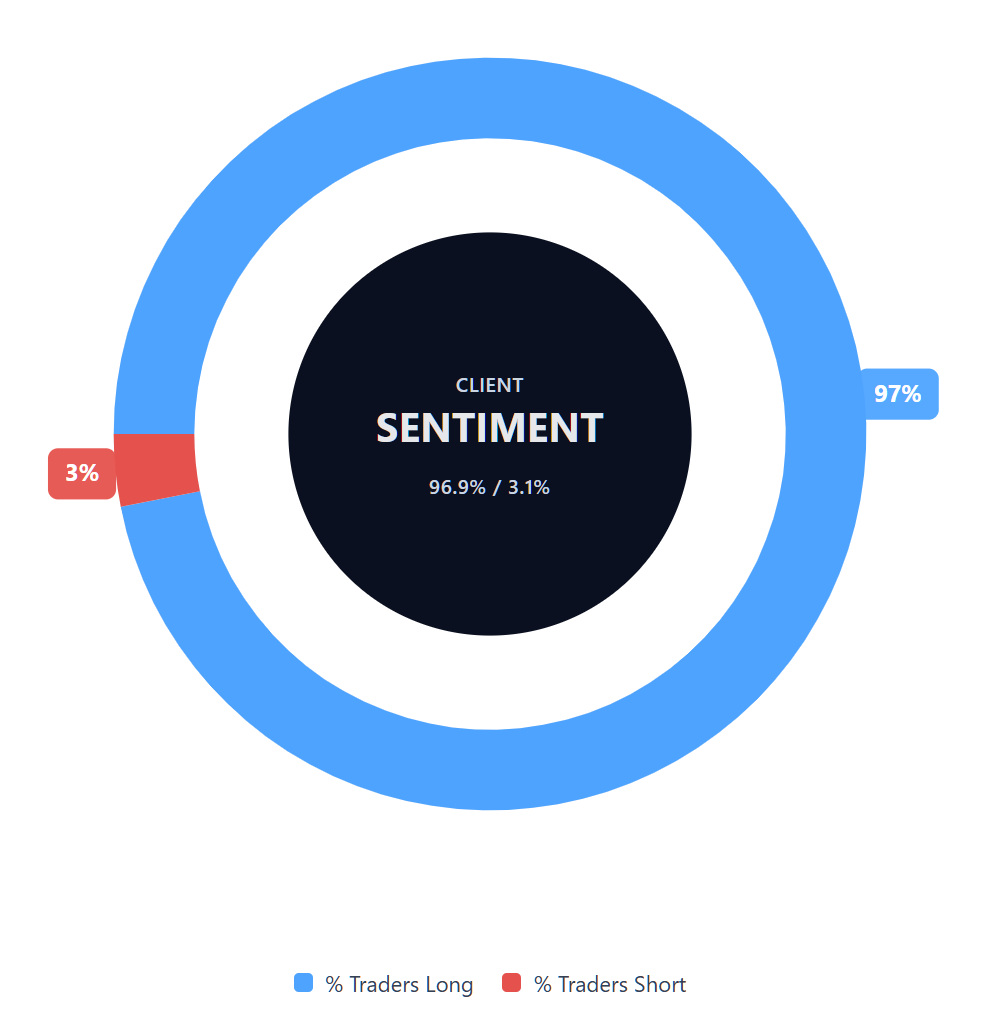
As of 23 July 2026, Capital.com client positioning in AMC Entertainment CFDs stood at 96.9% long and 3.1% short, a difference of 93.8 percentage points. This represents a heavily long-skewed snapshot of open positions held by Capital.com clients. Positioning can change over time.
Summary – AMC Entertainment 2026
- As of 11:01am UTC on 23 July 2026, AMC was trading near $2.25, well below its 2024 highs above $5 but above its March 2026 low of $0.95.
- Technical indicators showed the price holding above several moving averages, with the RSI in upper-neutral territory and the ADX suggesting that no trend was firmly established.
- The main factors affecting the outlook include the pace of the box-office recovery, debt refinancing, potential dilution and changes in retail investor sentiment.
- Recent attention has centred on AMC’s second-quarter earnings beat and summer box-office performance, while the range of third-party price targets reflects differing views on the durability of any recovery.
Past performance is not a reliable indicator of future results.
FAQ
Who owns the most AMC Entertainment stock?
Based on AMC’s latest disclosed beneficial-ownership filings available at the time of writing, Pentwater Capital Management reported beneficial ownership of 63,643,277 shares, equal to 9.99% of the class as of 31 March 2026. However, most of this figure related to shares issuable through convertible notes rather than shares held directly. Ownership can change between filings, so investors should consult the latest SEC disclosures for an up-to-date picture.
What is the five-year AMC Entertainment share price forecast?
The forecasts covered in this article extend mainly over six to 12 months, not five years. A five-year AMC stock forecast would involve considerable uncertainty because the outcome depends on box-office demand, debt refinancing, potential dilution, operating costs and broader market conditions. Long-term model projections can vary widely and may change as new financial information becomes available, so they shouldn’t be treated as reliable predictions of future performance.
Is AMC Entertainment a good stock to buy?
Whether AMC Entertainment is a suitable stock depends on an individual’s objectives, risk tolerance and assessment of the company. Potential supporting factors include improving box-office receipts and stronger recent earnings, while risks include its debt burden, refinancing costs, possible dilution and high share-price volatility. The third-party targets in this article vary substantially, highlighting the uncertainty around the outlook. This information doesn’t constitute a recommendation to buy AMC shares.
Could AMC Entertainment stock go up or down?
Yes. AMC’s share price could rise if box-office revenue, attendance, profitability or cash flow improve more than expected, or if refinancing reduces pressure on its balance sheet. It could fall if film demand weakens, costs increase, refinancing becomes more expensive or further share issuance dilutes existing holdings. Retail investor activity may also amplify moves in either direction. Technical levels can provide reference points, but they can’t predict future price movements with certainty.
Should I invest in AMC Entertainment stock?
That decision depends on your financial circumstances, investment horizon and tolerance for loss. Before considering AMC shares, you may want to review the company’s earnings, debt position, cash flow, dilution risk and exposure to box-office trends. It’s also important to compare the stock with other opportunities and consider portfolio concentration. Forecasts and analyst targets are uncertain, and past performance isn’t a reliable indicator of future results. This article doesn’t provide investment advice.
Can I trade AMC Entertainment CFDs on Capital.com?
Yes, you can trade AMC Entertainment CFDs on Capital.com. Trading share CFDs lets you speculate on price movements without owning the underlying asset and to take long or short positions. However, contracts for difference (CFDs) are traded on margin, and leverage amplifies both profits and losses. You should ensure you understand how CFD trading works, assess your risk tolerance, and recognise that losses can occur quickly.