

Michael Kramer: How to Analyse Palantir Before Earnings
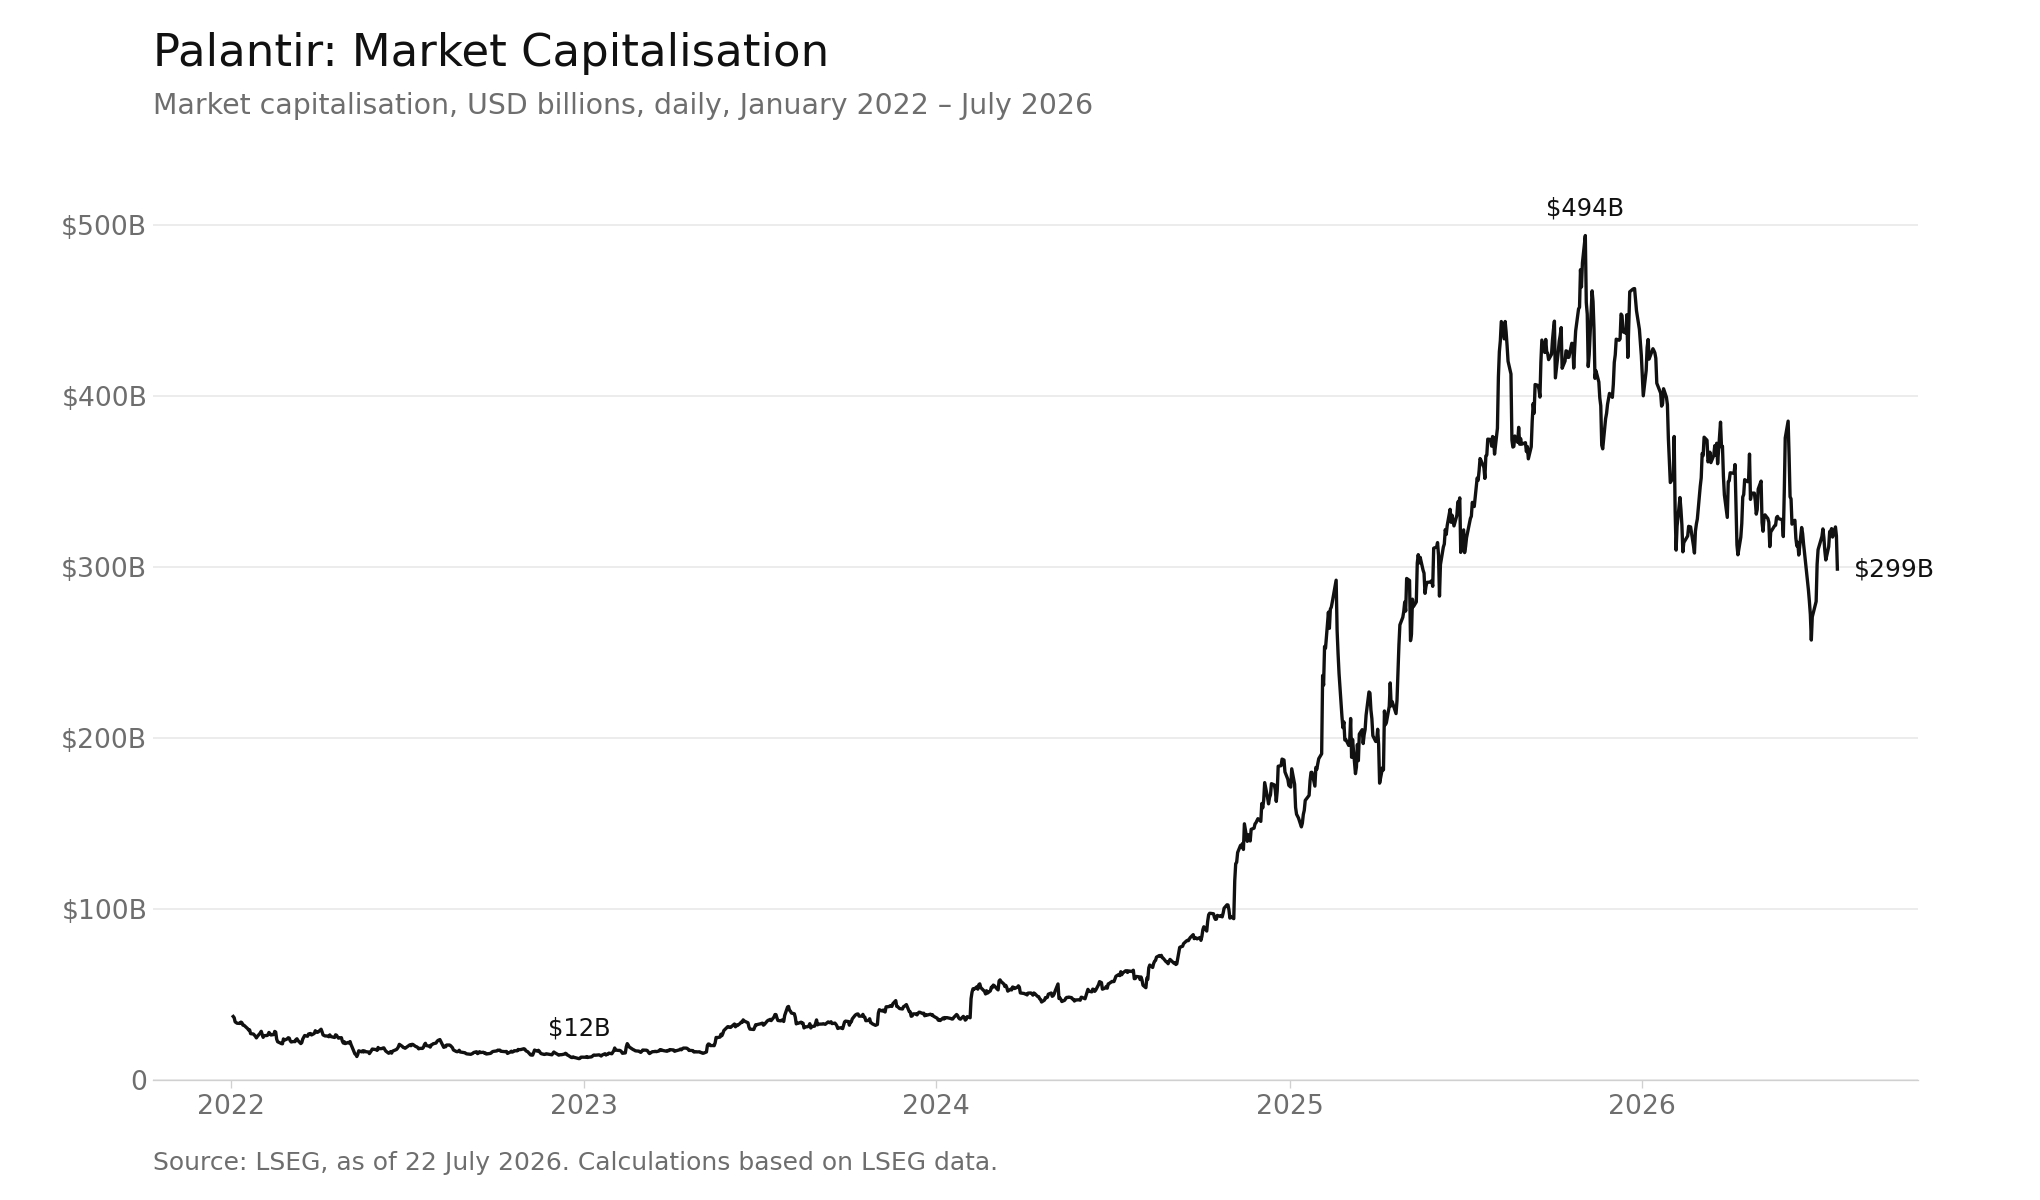
Palantir’s market cap has risen since 2022, climbing from $37 billion to a peak of just below $500 billion in late 2025; since then, it has fallen to $299 billion.
Palantir’s market cap has risen since 2022, climbing from $37 billion to a peak of just below $500 billion in late 2025; since then, it has fallen to $299 billion. Revenue is generated by its commercial and government operating segments.
(Source: LSEG, as of 22 July 2026. Calculations based on LSEG data)
(Past performance is not a reliable indicator of future results).
Earnings History
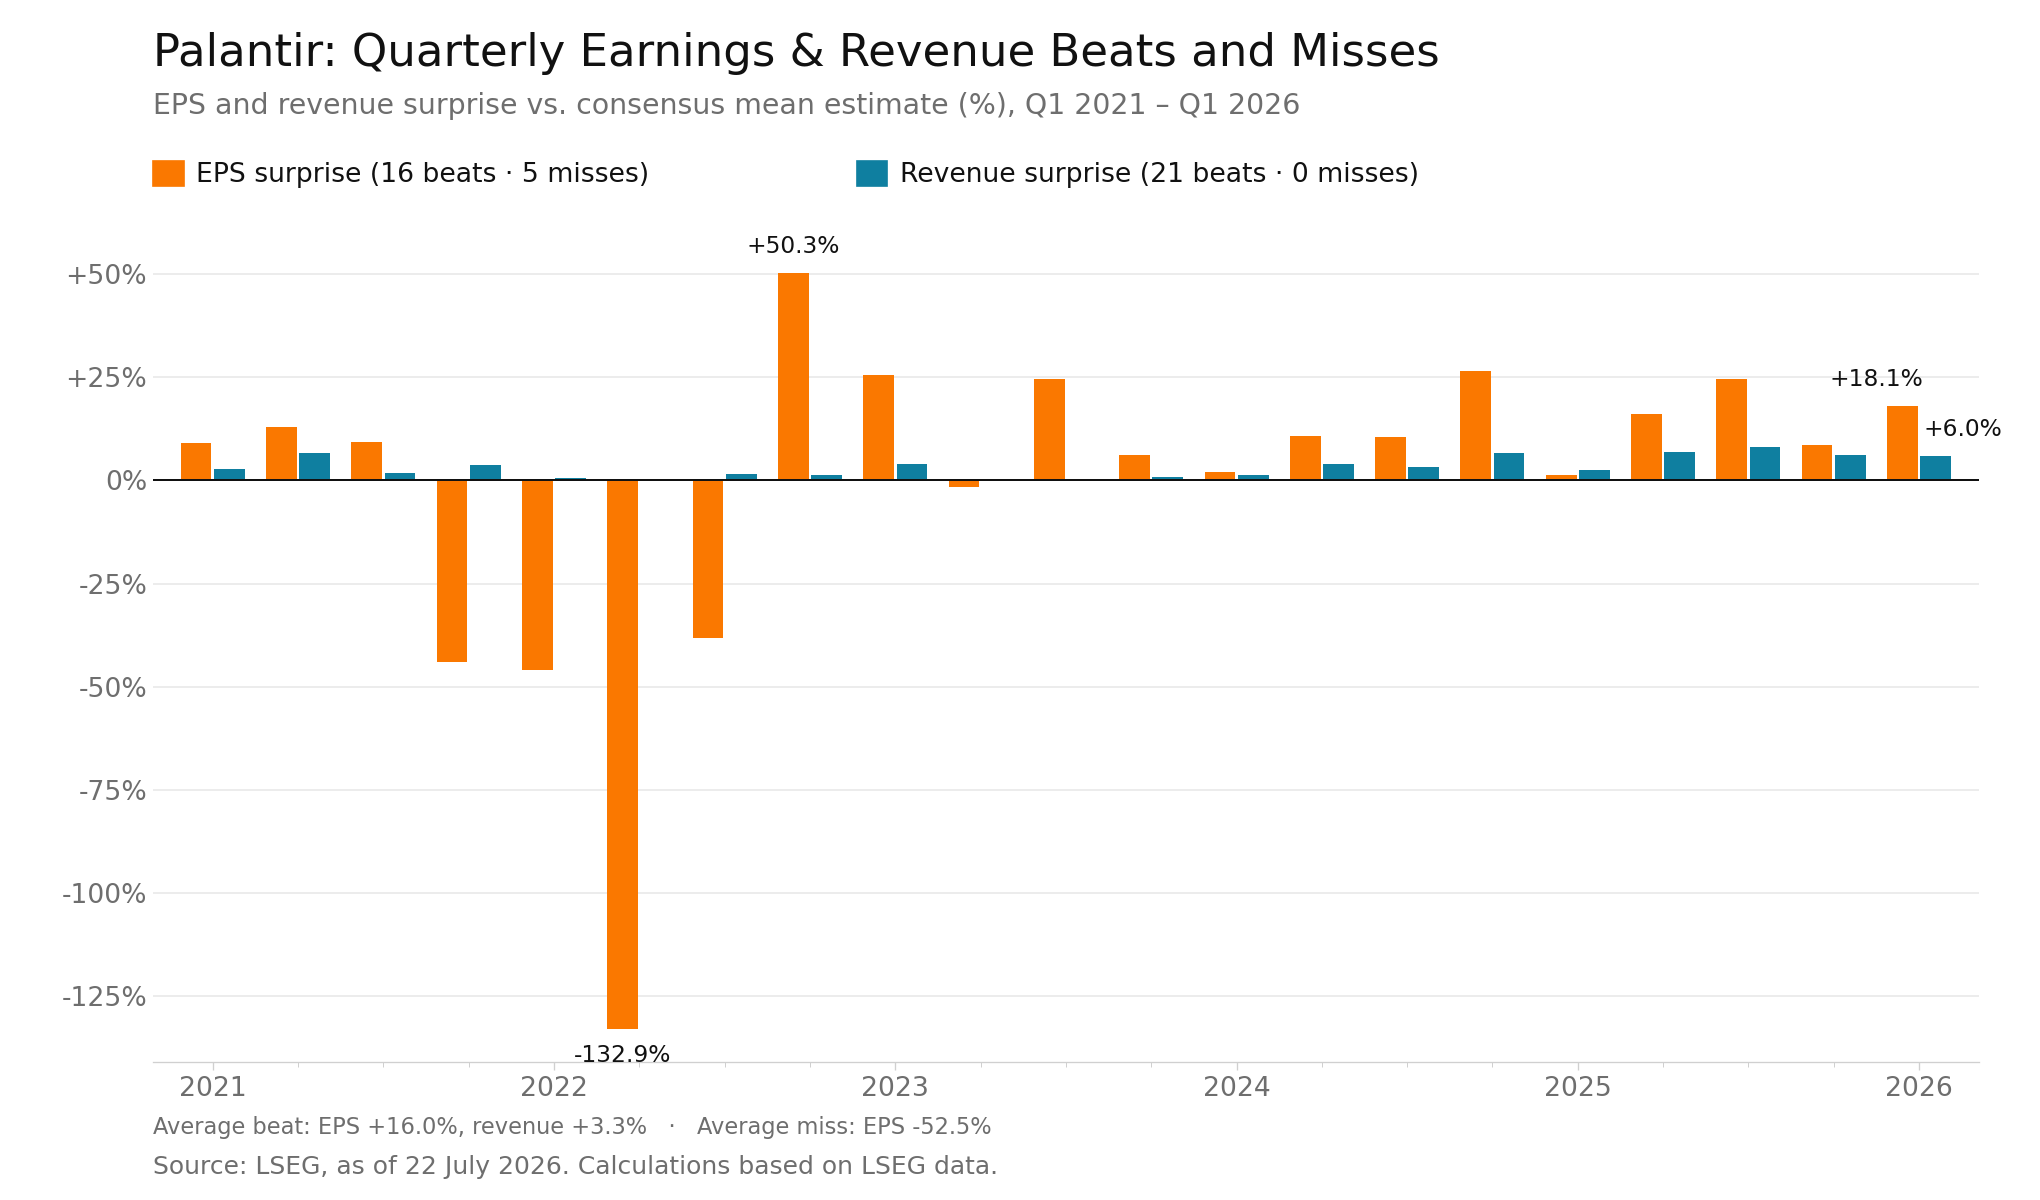
Across the 21 quarters shown, Palantir’s revenue exceeded analysts’ consensus estimates in every quarter, while EPS missed estimates five times. Among the positive surprises, EPS exceeded the consensus mean estimate by an average of 16.0%. Positive revenue surprises averaged 3.3%.
(Source: LSEG, as of 22 July 2026. Calculations based on LSEG data)
(Past performance is not a reliable indicator of future results).
Segment Growth
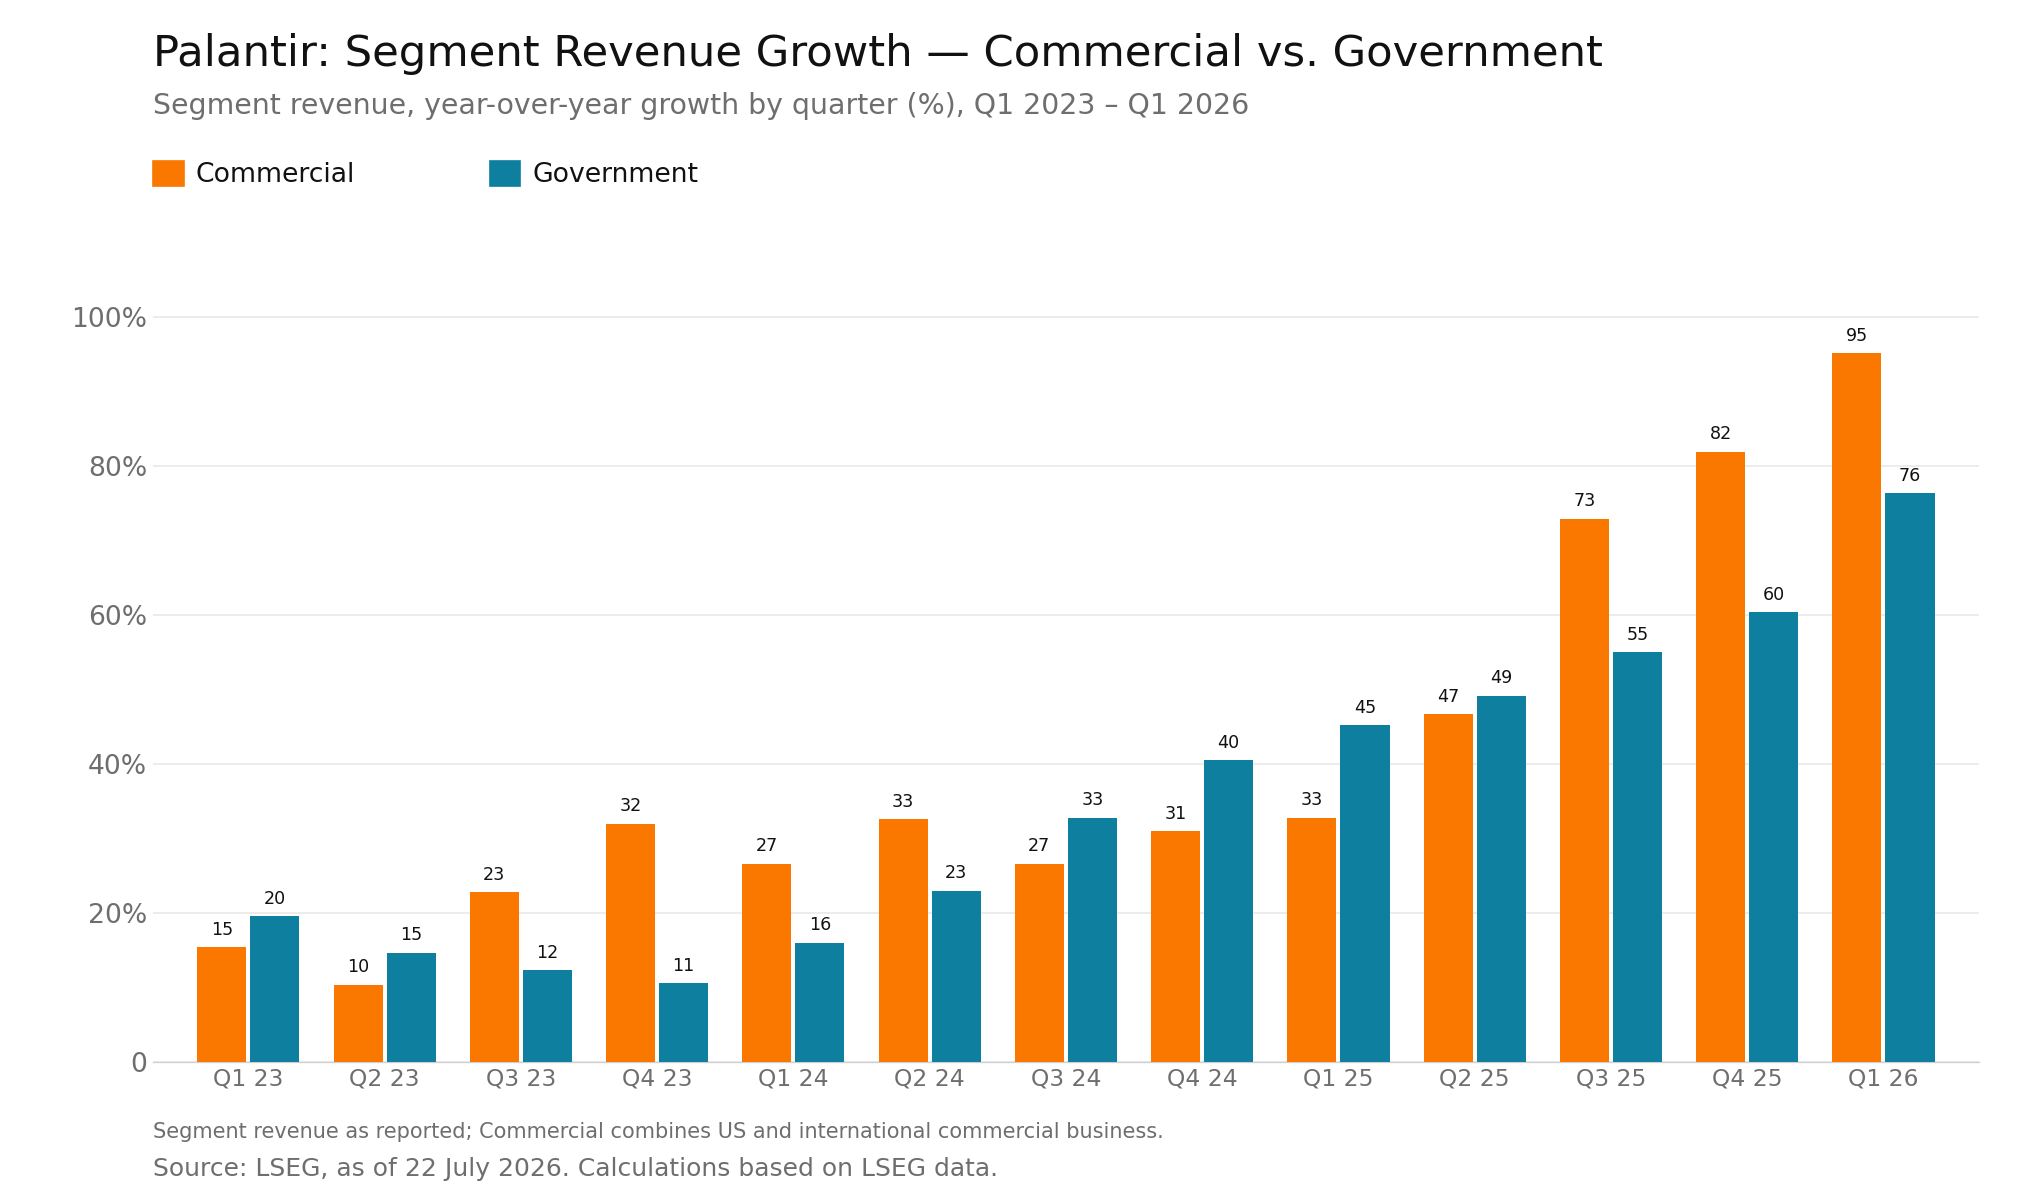
Palantir has two operating segments: commercial and government. In recent quarters, commercial revenue has grown faster than government revenue. In the first quarter of 2026, commercial revenue grew 95% year on year, while government revenue grew 76%. Both growth rates have risen since the first quarter of 2025.
(Source: LSEG, as of 22 July 2026. Calculations based on LSEG data)
(Past performance is not a reliable indicator of future results).
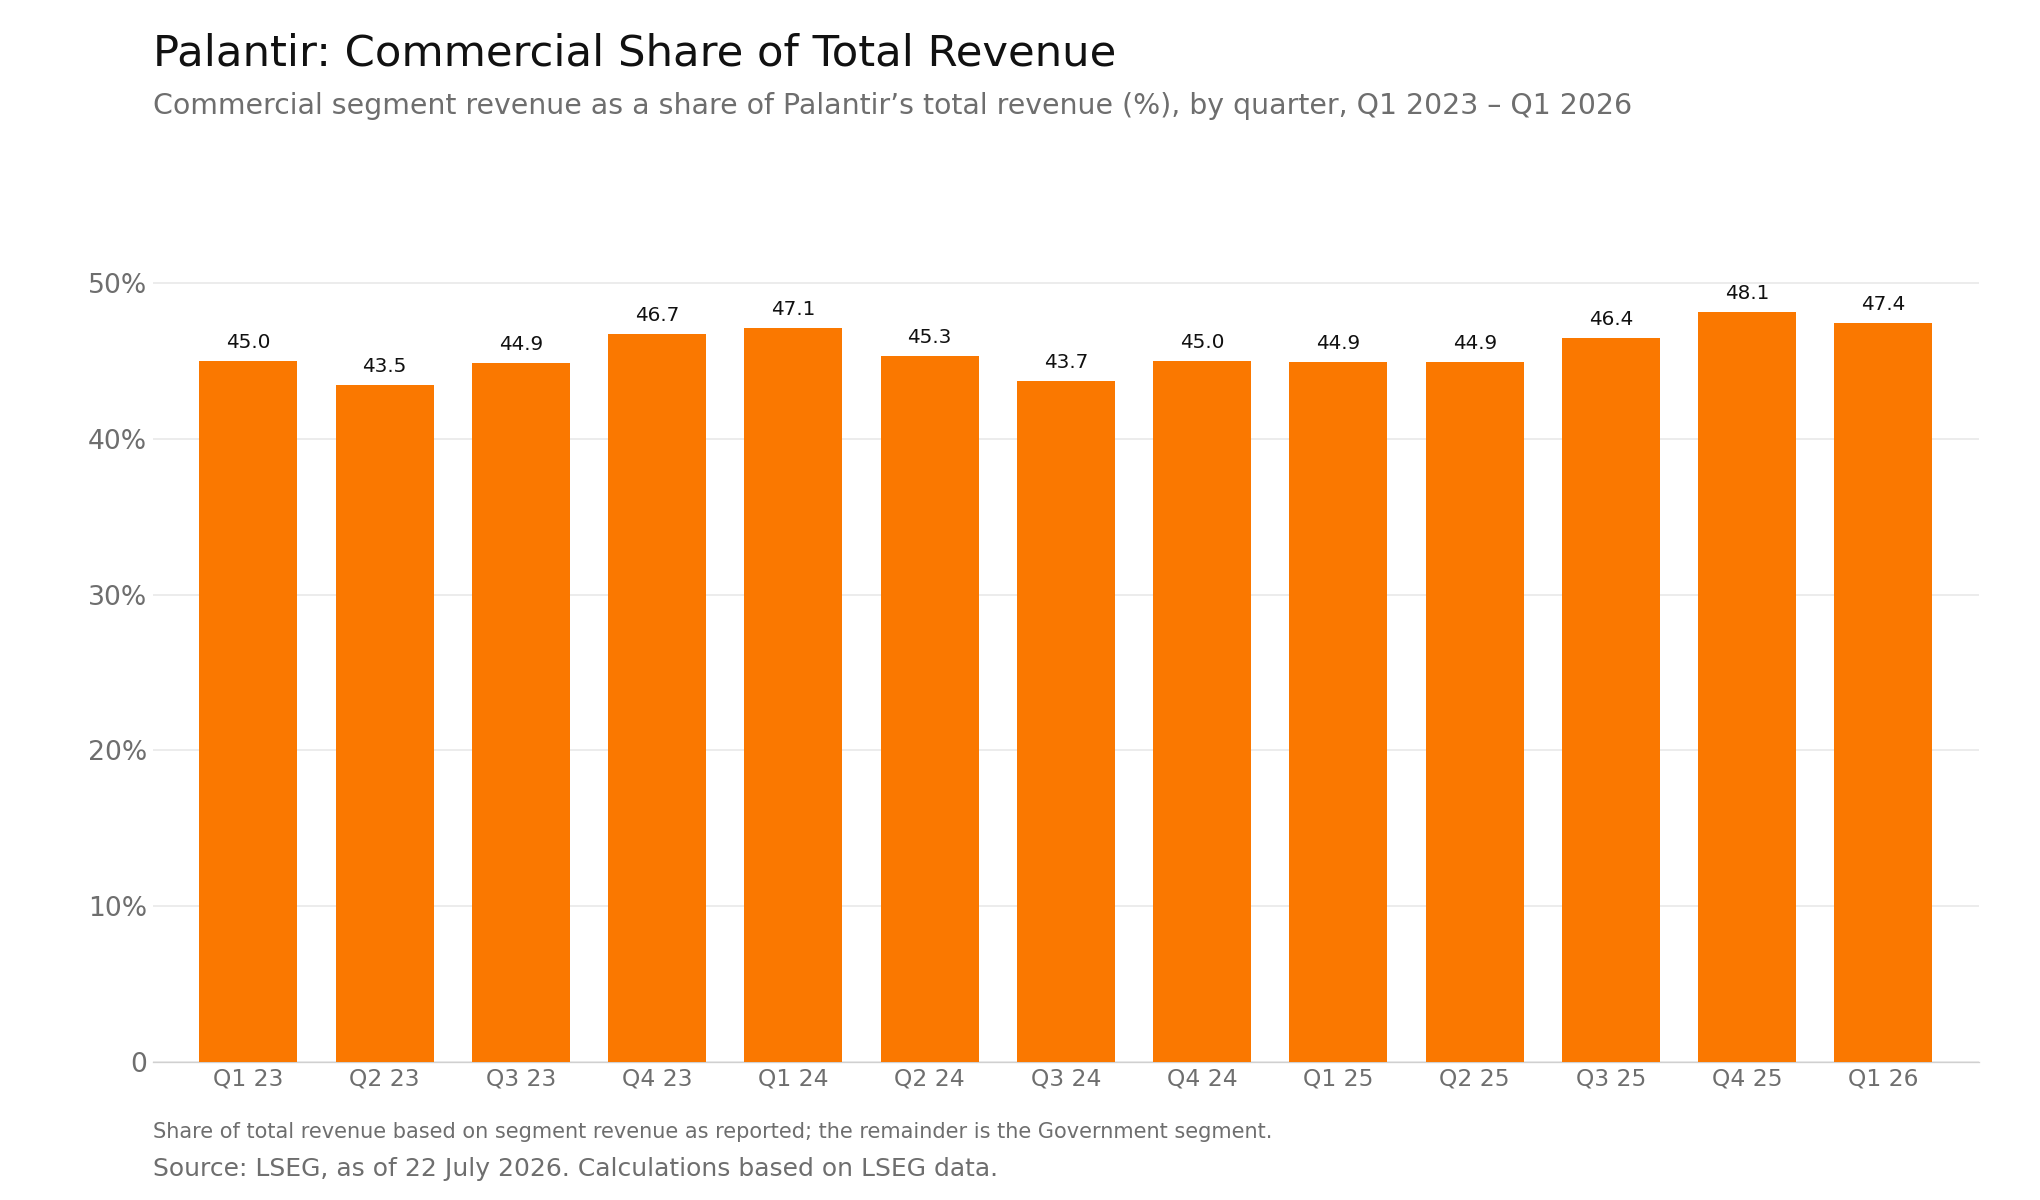
Commercial and government revenue each account for roughly half of the company’s total revenue. From the first quarter of 2023 to the first quarter of 2026, commercial revenue ranged from 43.5% to 48.1% of total revenue, with government revenue accounting for the balance.
(Source: LSEG, as of 22 July 2026. Calculations based on LSEG data)
(Past performance is not a reliable indicator of future results).
Free Cash Flow
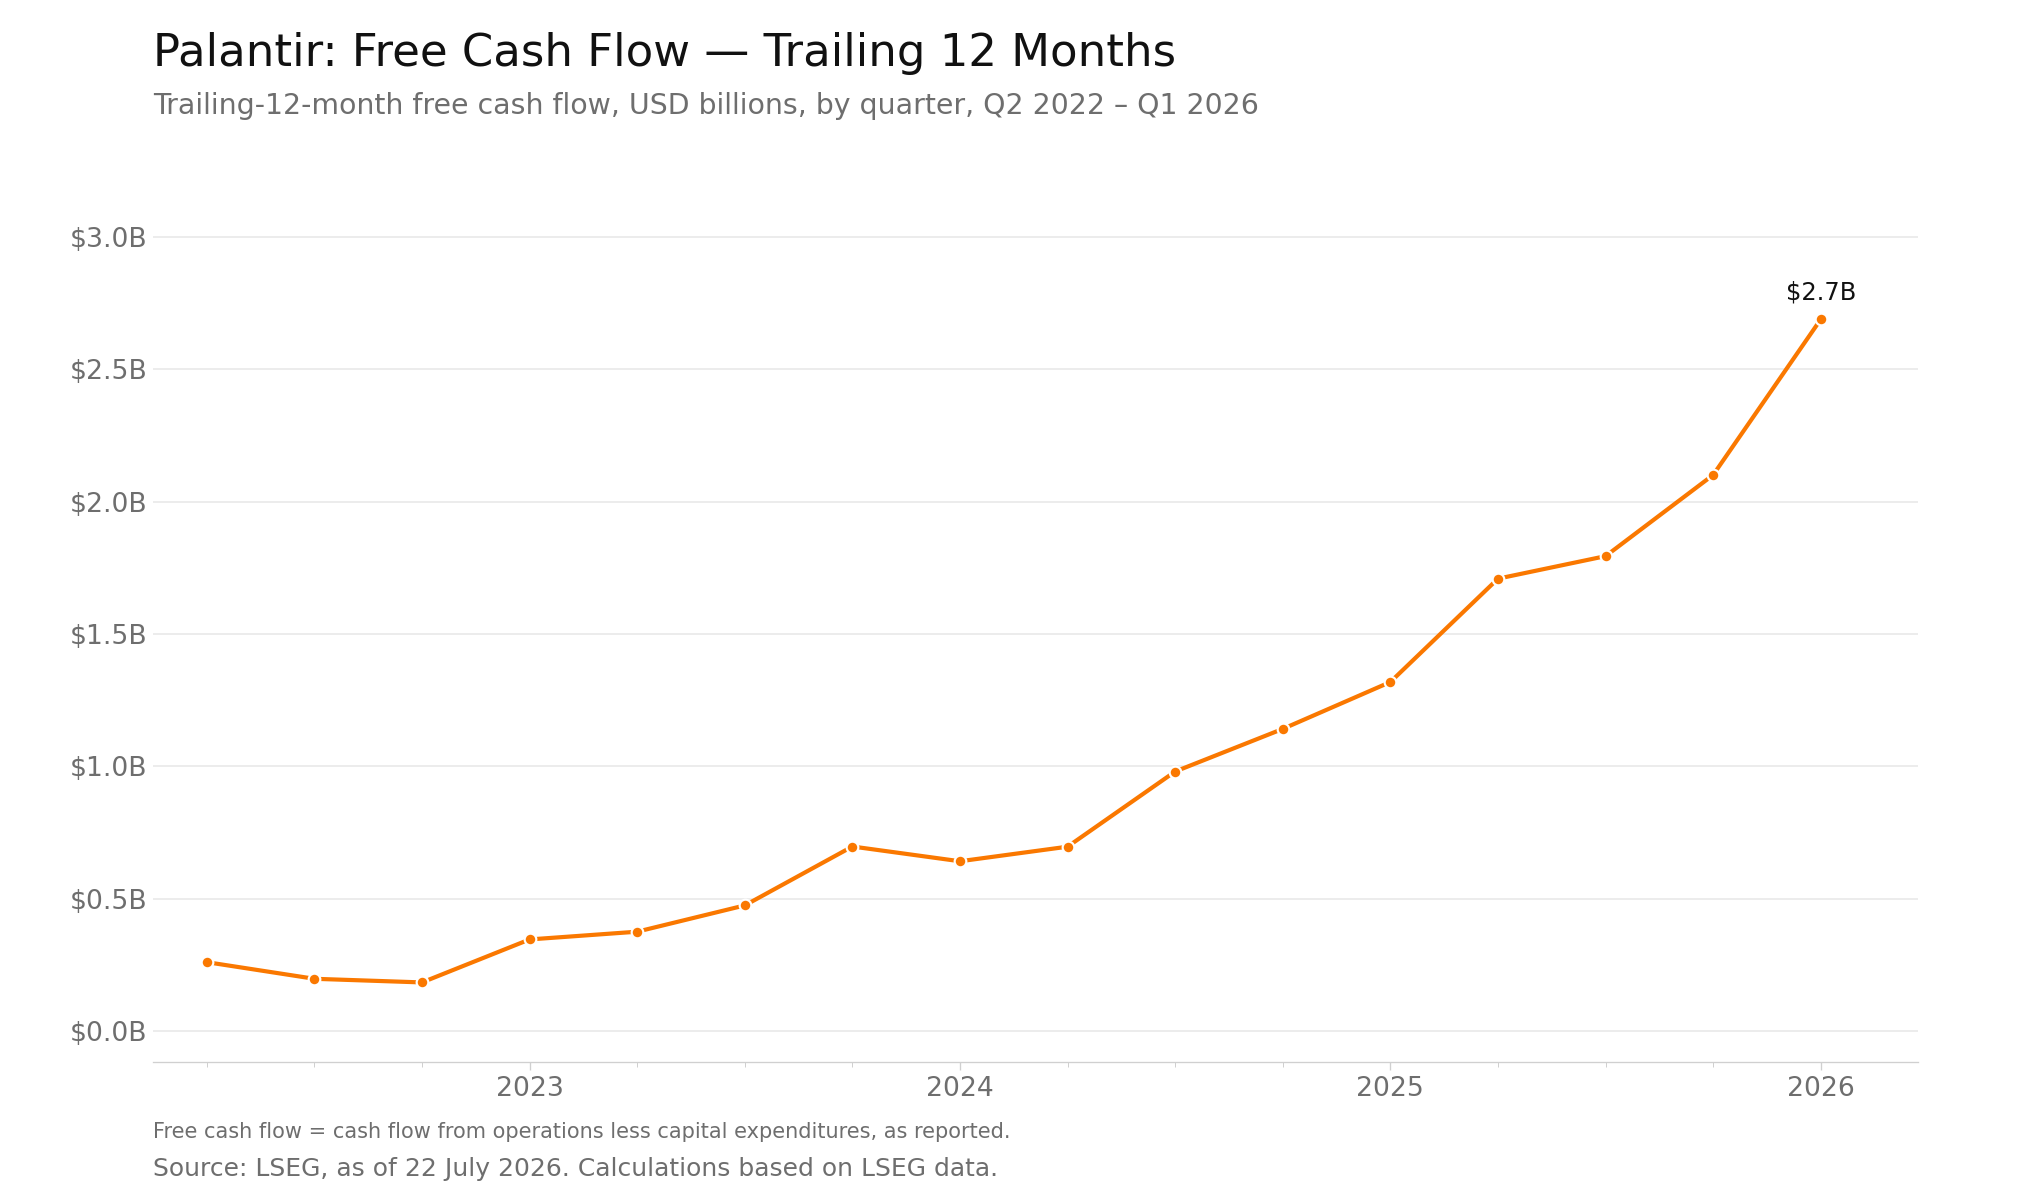
Palantir’s trailing-12-month free cash flow rose from less than $300 million in the second quarter of 2022 to nearly $2.7 billion in the first quarter of 2026. Free cash flow is defined here as cash flow from operations less capital expenditure, as reported.
(Source: LSEG, as of 22 July 2026. Calculations based on LSEG data)
(Past performance is not a reliable indicator of future results).
Options-Implied Earnings Range
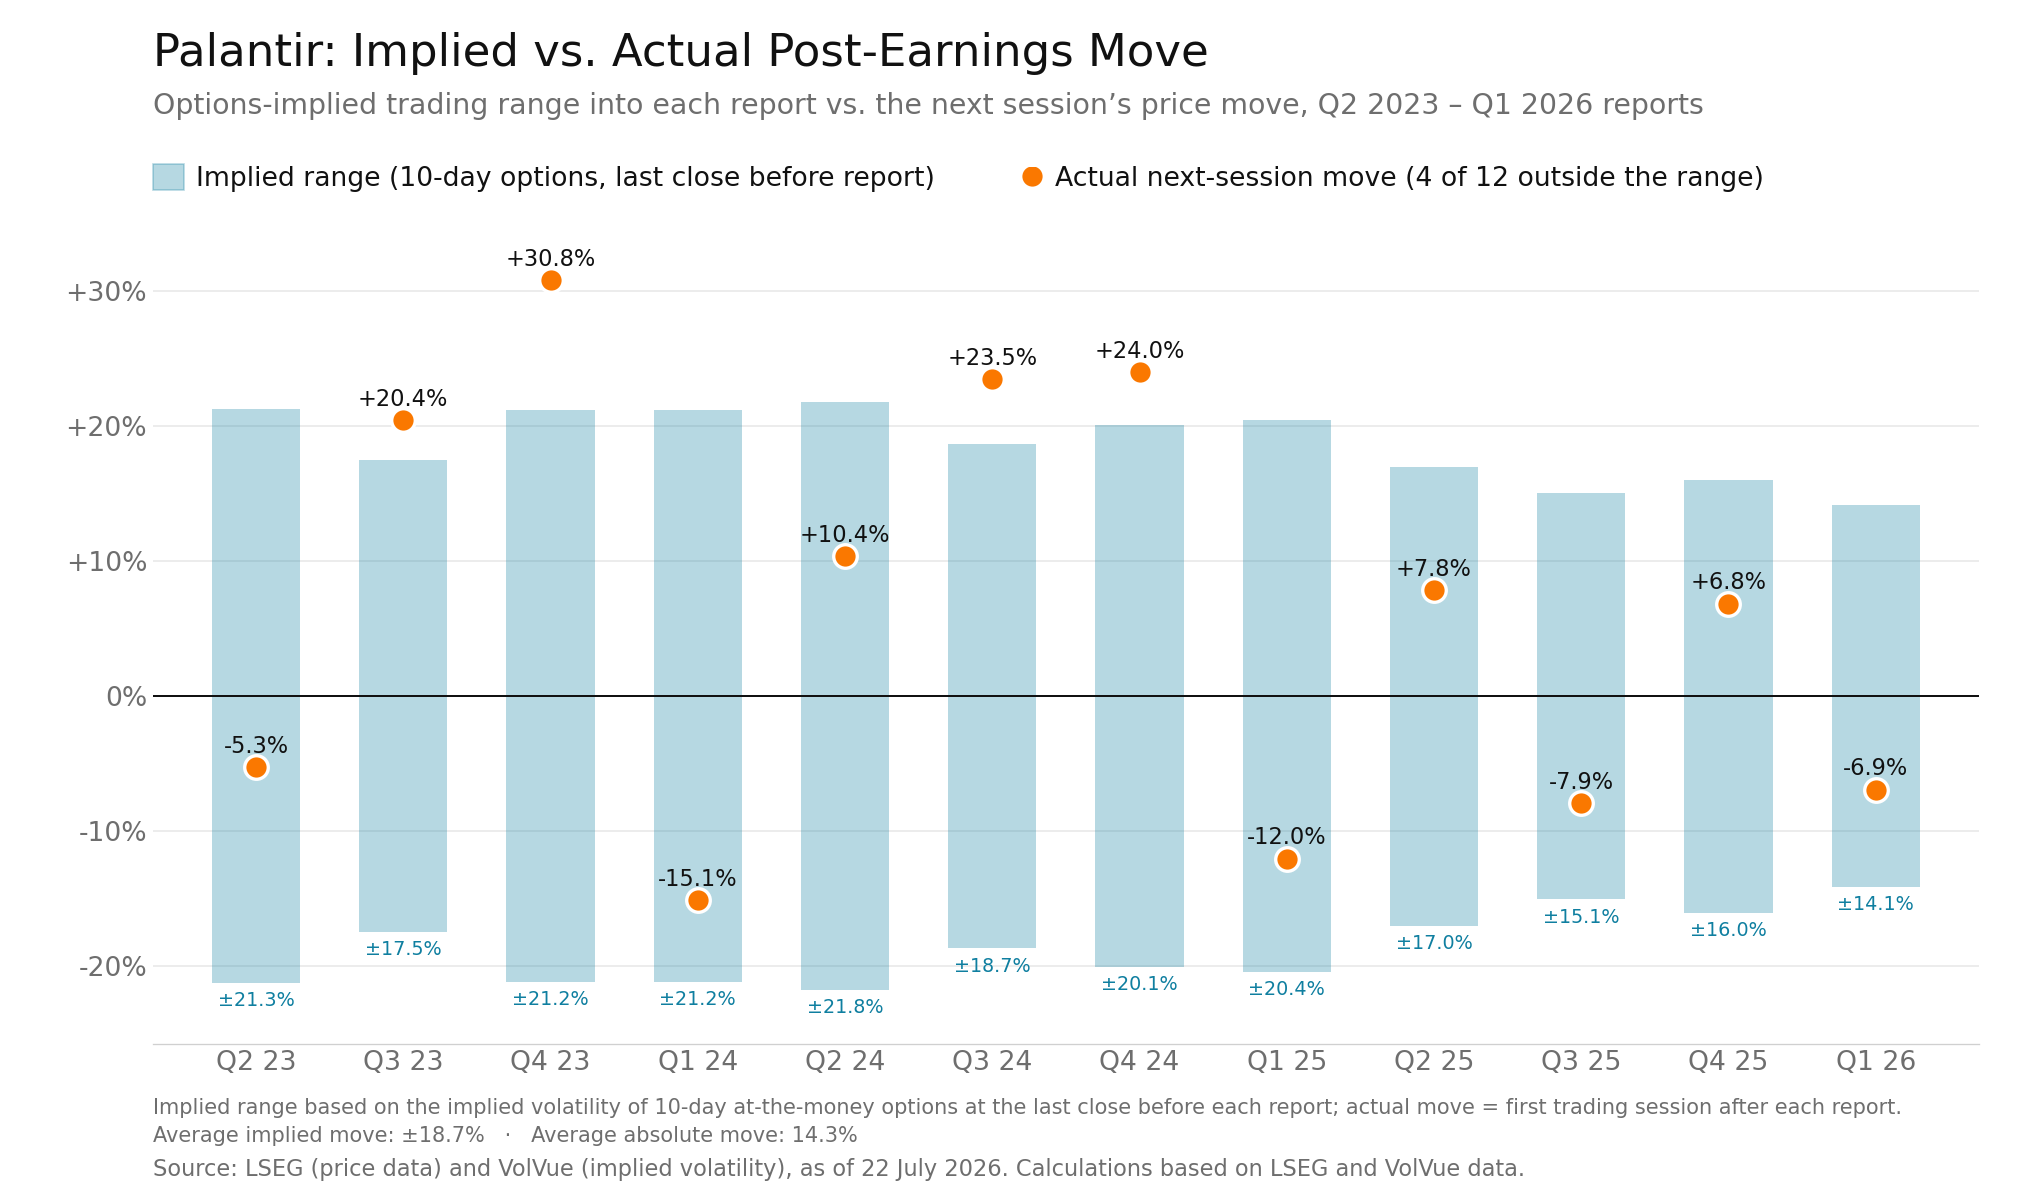
Option prices can be used to calculate an implied trading range around an earnings announcement. Across the 12 announcements shown, 10-day at-the-money options implied an average range of ±18.7%, compared with an average absolute realised next-session move of 14.3%. The next-session share-price move remained within the calculated range in eight cases and was outside it in four.
The implied range was estimated from the 10-day at-the-money implied volatility observed at the last close before each report, scaled to the option’s 10-day term using implied volatility × √(10/365) and applied to the share price. It does not constitute a forecast or indicate the direction of the share-price move.
(Source: LSEG (price data) and VolVue (implied volatility), as of 22 July 2026. Calculations based on LSEG and VolVue data)
(Past performance is not a reliable indicator of future results).
Valuation Metrics
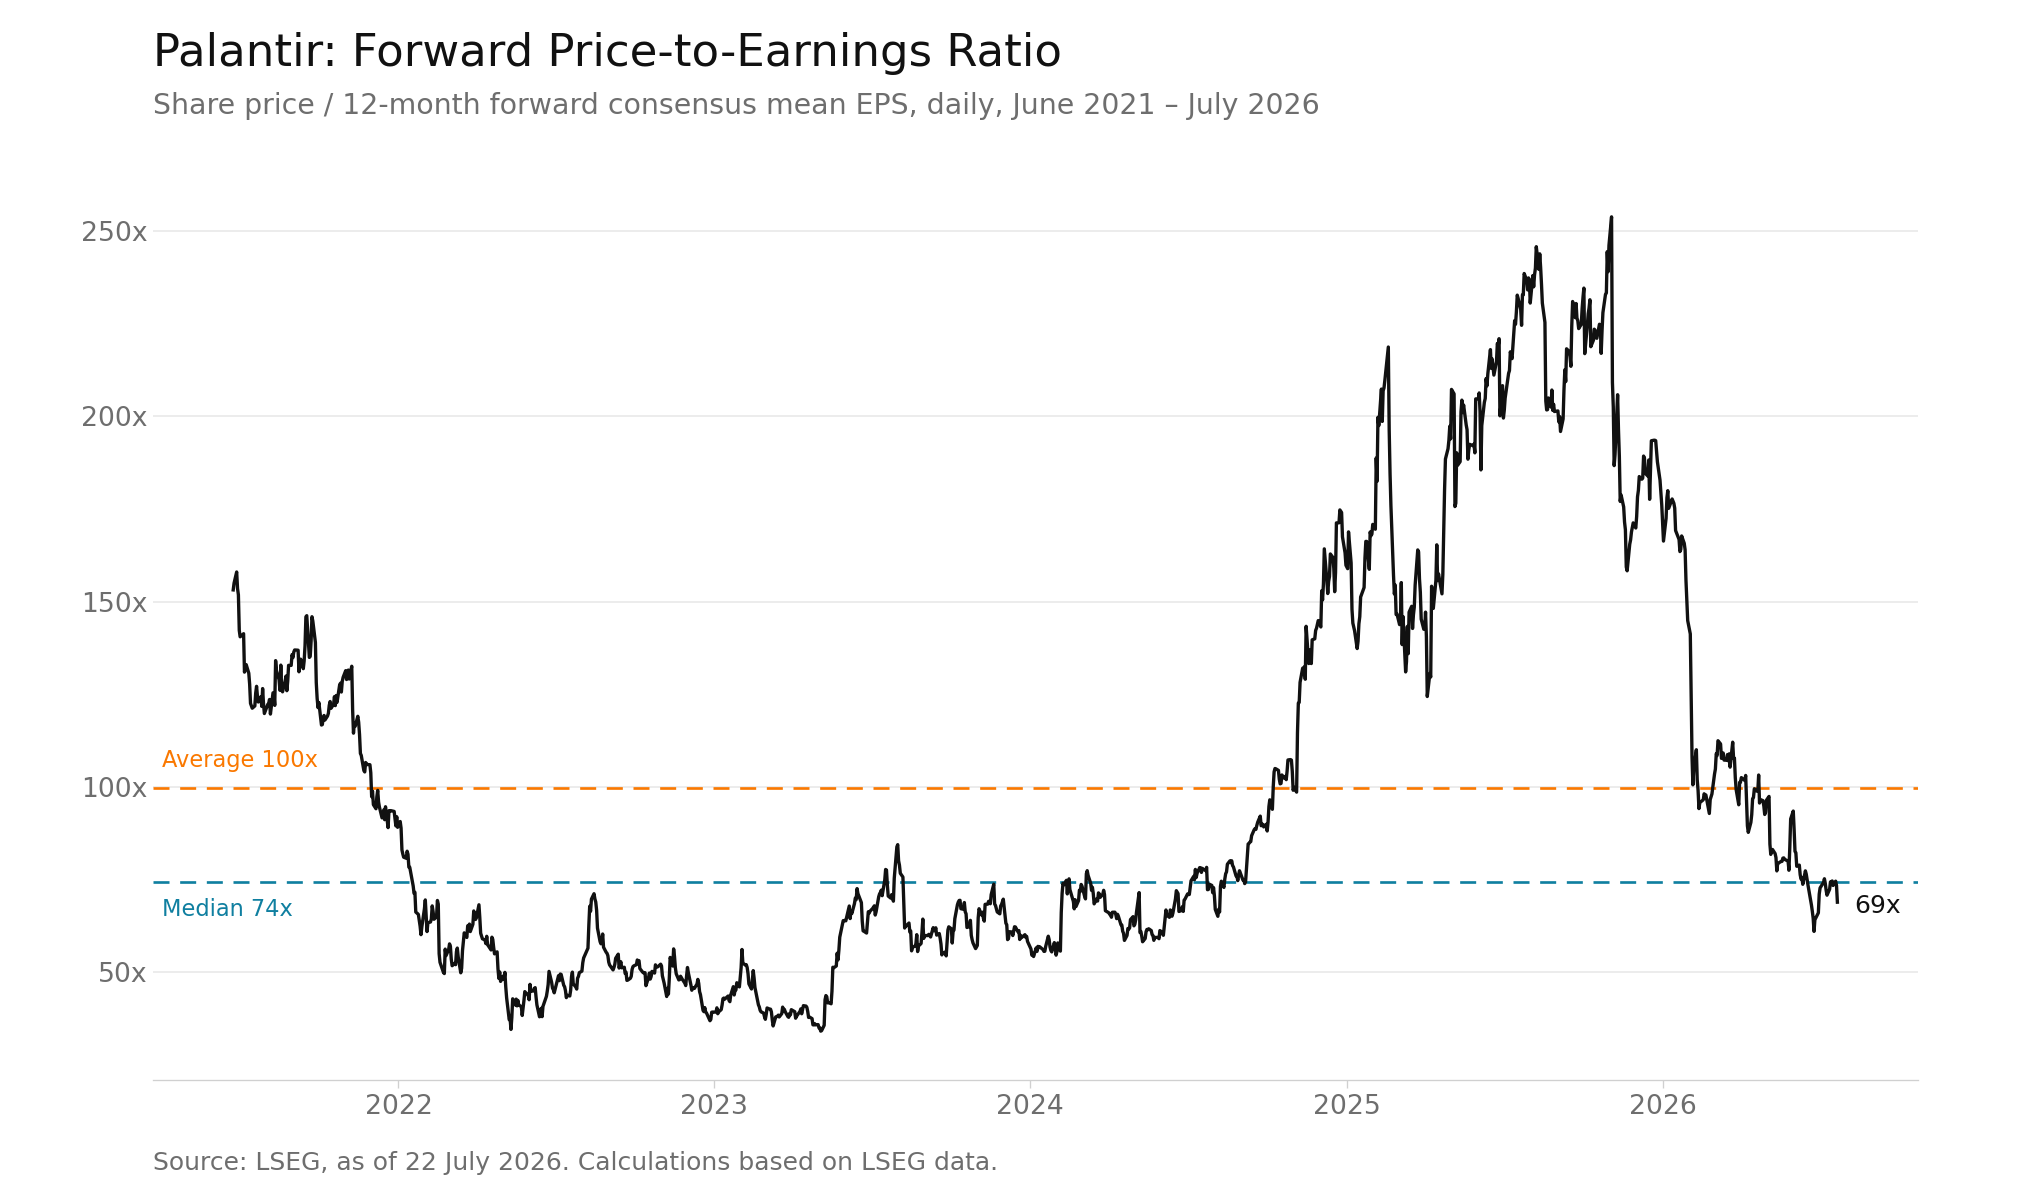
As of 22 July 2026, Palantir’s forward price-to-earnings ratio, based on analysts’ estimates for the next twelve months, is 69. From June 2021 to July 2026, Palantir’s average P/E was 100, and its median was 74, so its P/E is currently below both its historical average and median for the period.
Historical valuation multiples provide context for how the market has priced the company over time. These historical comparisons do not indicate whether the shares are currently overvalued or undervalued.
(Source: LSEG, as of 22 July 2026. Calculations based on LSEG data)
(Past performance is not a reliable indicator of future results).
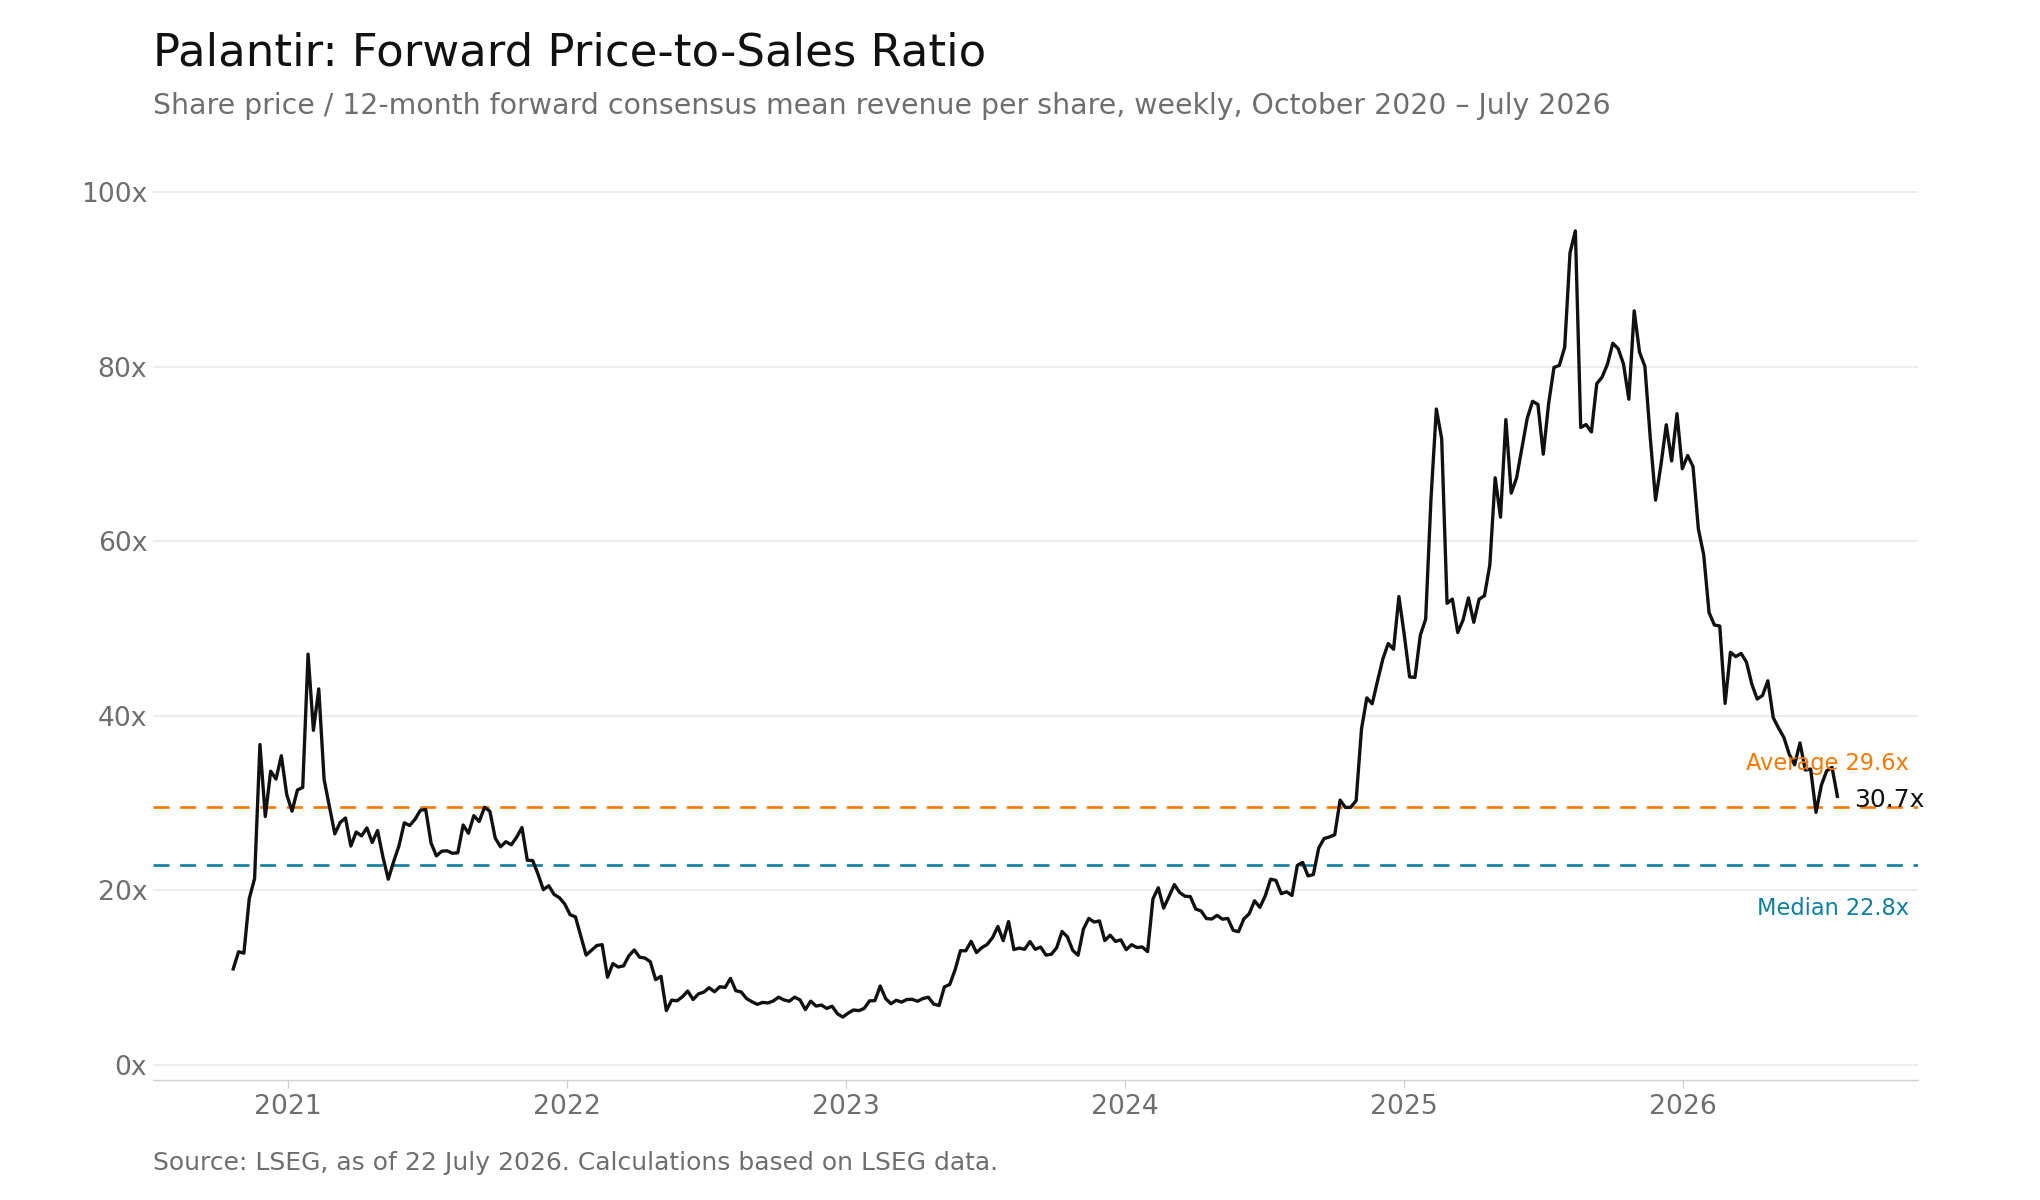
As of 22 July 2026, Palantir’s forward price-to-sales ratio, based on analysts’ consensus next-twelve-month revenue estimates, is 30.7. From October 2020 to July 2026, its average P/S ratio was 29.6, and its median was 22.8, so the ratio is currently above both the historical average and median for the period.
(Source: LSEG, as of 22 July 2026. Calculations based on LSEG data)
(Past performance is not a reliable indicator of future results).
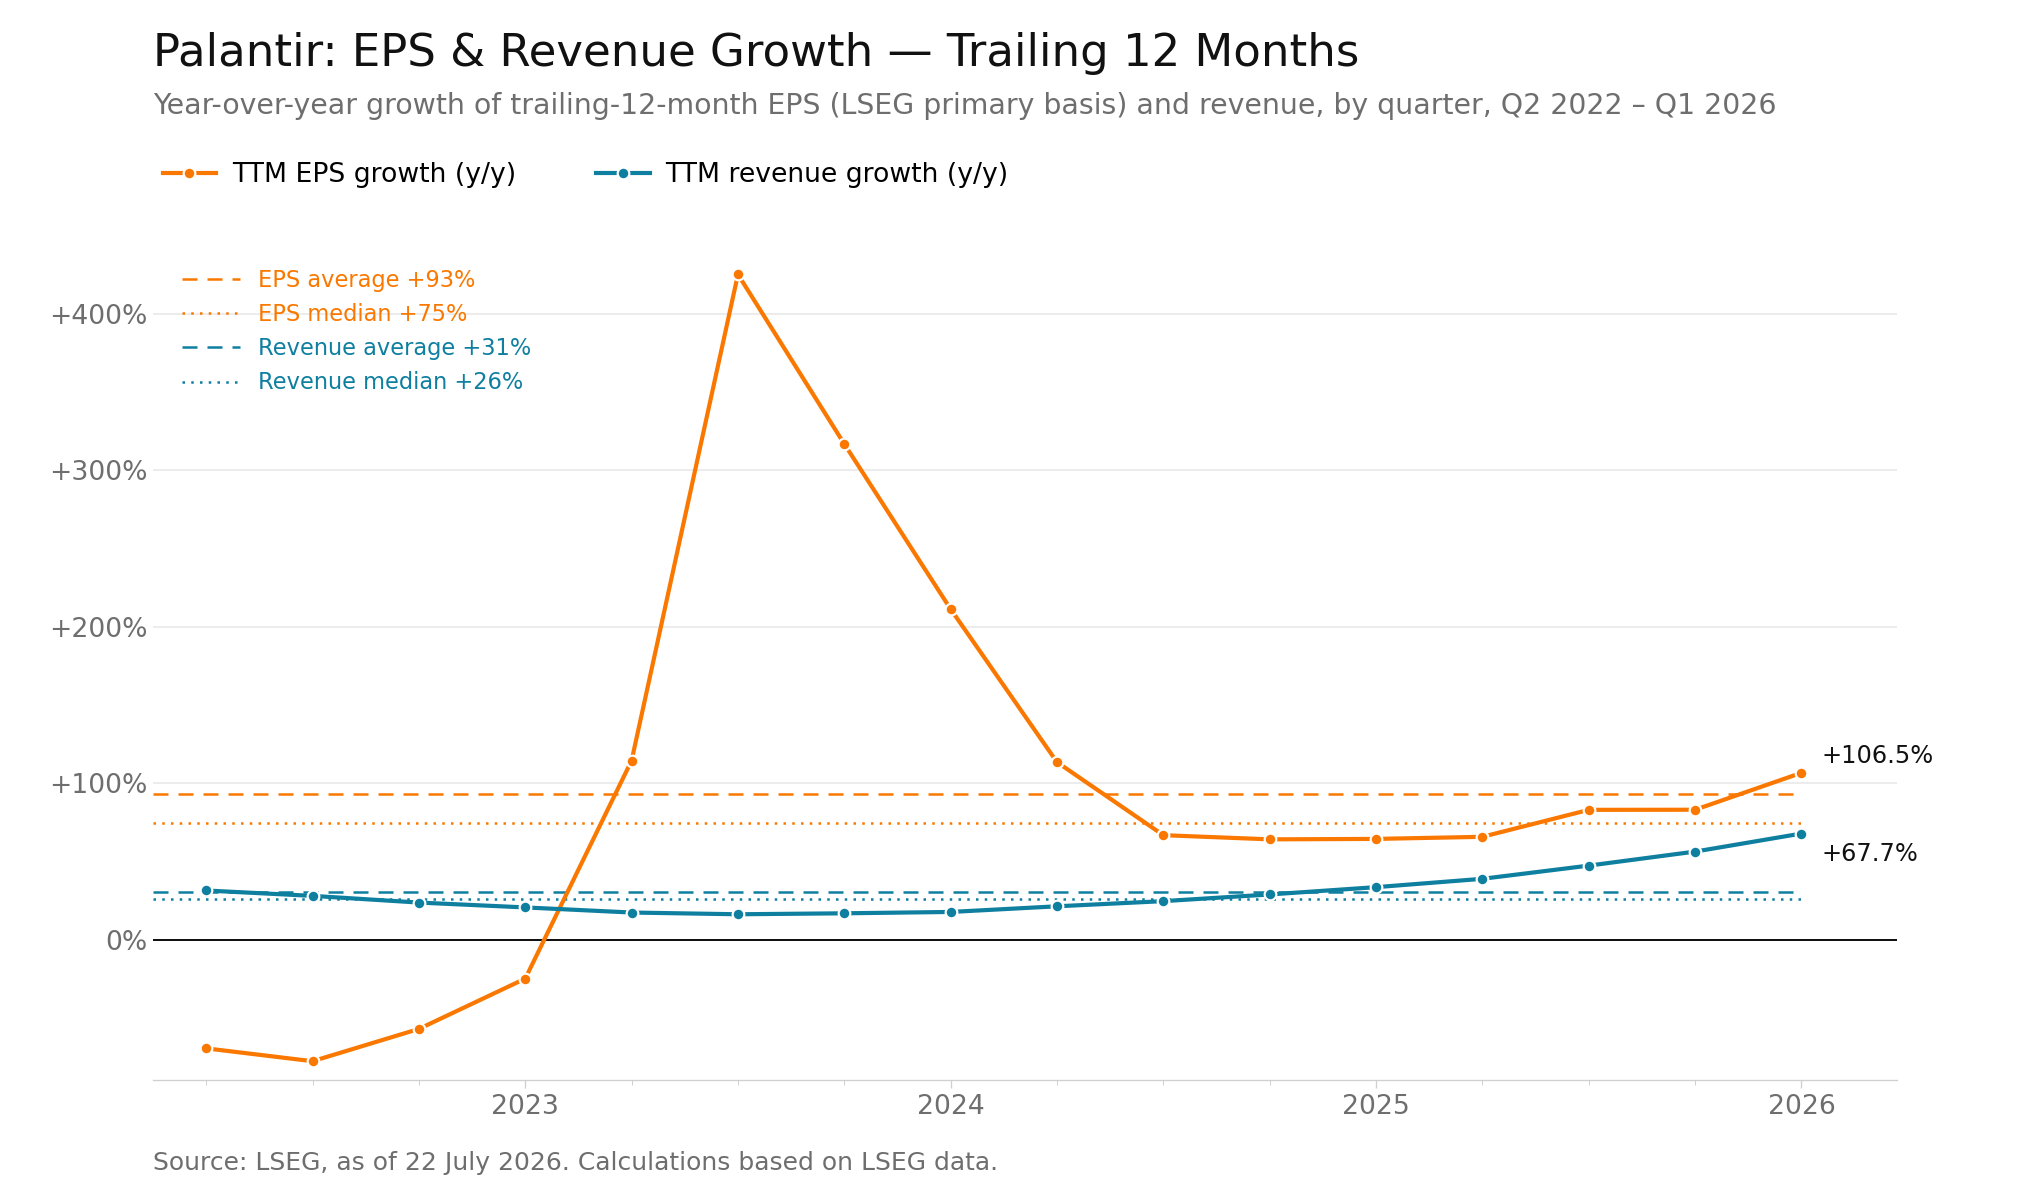
Over the period shown, Palantir’s trailing-12-month EPS recorded an average year-on-year growth rate of 93%, with a median of 75%. Revenue growth averaged 31%, with a median of 26%. In the first quarter of 2026, the corresponding figures were 106.5% for EPS growth and 67.7% for revenue growth, both above their historical averages and medians.
(Source: LSEG, as of 22 July 2026. Calculations based on LSEG data)
(Past performance is not a reliable indicator of future results).
The charts and data provide historical context for Palantir’s financial performance, free cash flow, segment growth and revenue mix. The stock’s forward P/E is below its historical average and median, while its forward P/S ratio is above its historical average and median. These observations do not indicate how Palantir’s forthcoming results or share price may perform. Past performance is not a reliable indicator of future results.