Bitcoin, Oil, and Costco Converge at Critical Resistance Zones
The S&P 500 increased by about 25 basis points on 2 December.
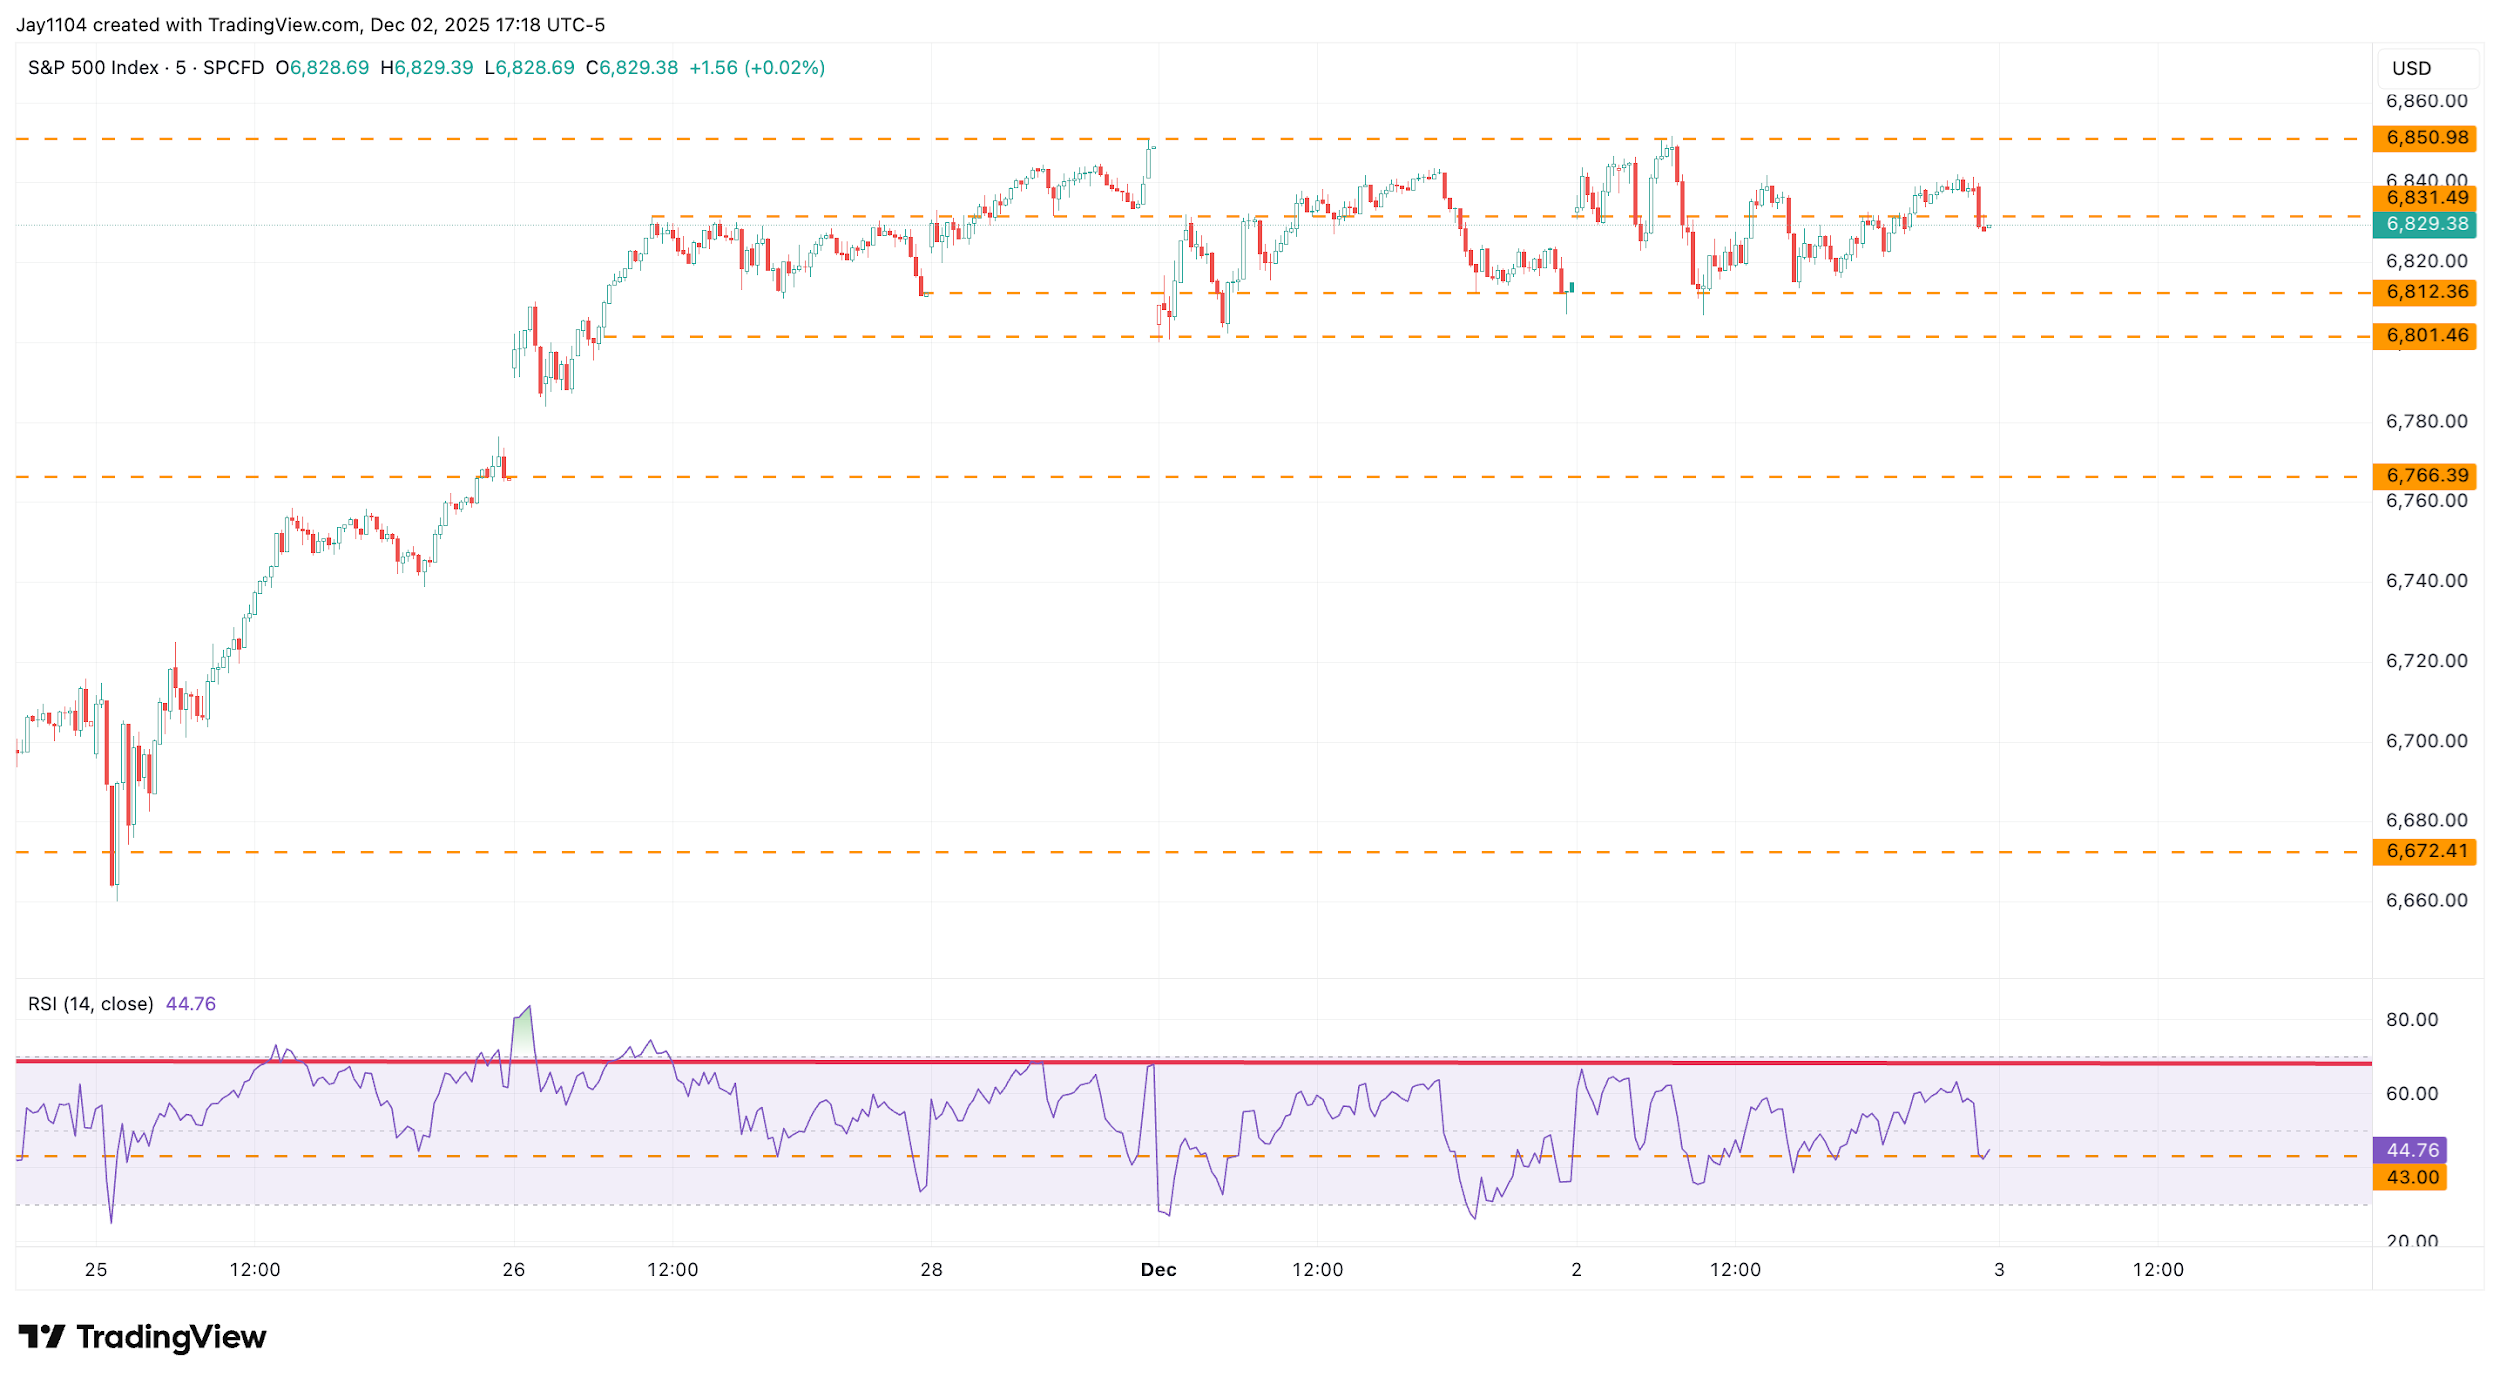
The index remained largely within the 6,800 to 6,850 range for most of the trading day, which has effectively been the range since Wednesday, 25 November. [CHART1] For now, the market might be waiting for further data amid a busy economic calendar on Wednesday, or it may have lost momentum over the past couple of days, given that the VIX and implied volatility measures seem to have stabilised.
With more economic data due later this week and a Fed meeting next week, it is possible that implied volatility begins to increase again as we approach these events. Therefore, although the market has held together reasonably well within this range, the risk is not necessarily that it falls on bad news, but rather that it trades lower as implied volatility rises in anticipation of the upcoming news.

That said, the index could just as easily jump higher from this point, surpass 6,850, and head towards new all-time highs again. This illustrates how finely balanced the market’s next move is, and for now, we simply have to wait and see what occurs.1
(Source: TradingView)
(Past performance is not a reliable indicator of future results)
[CHART1]
Bitcoin Surges Back to Resistance
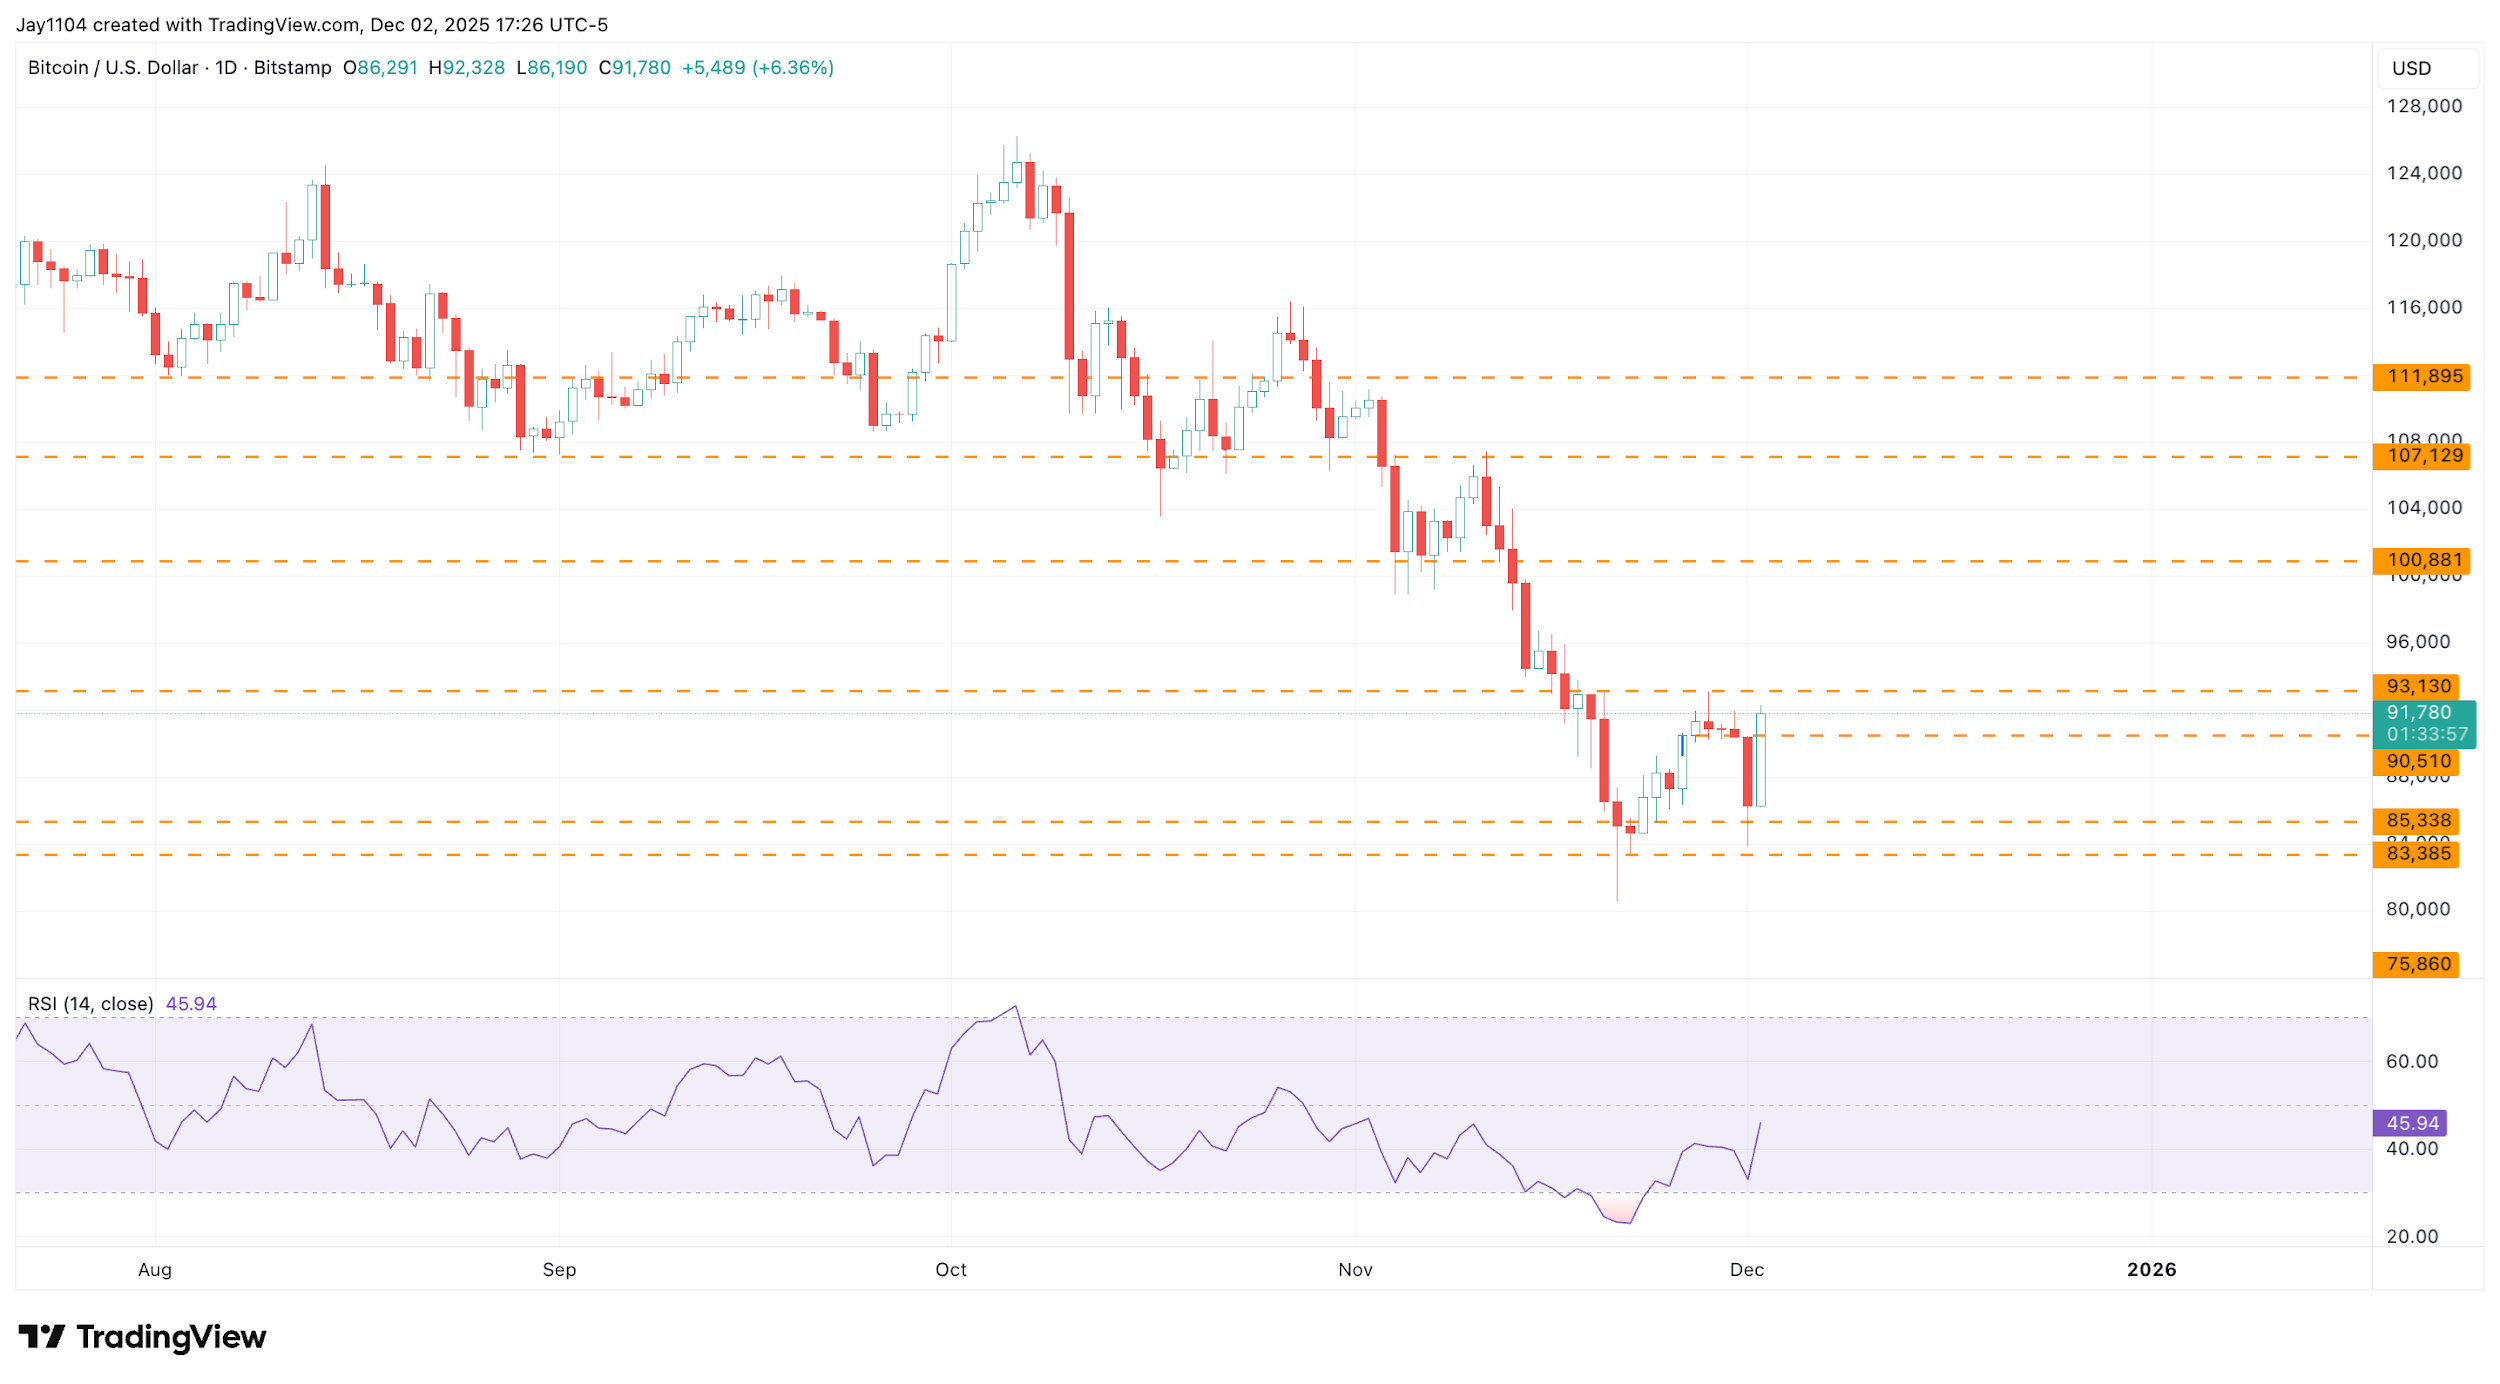
Bitcoin rose by more than 6% on 2 December, effectively erasing all the losses recorded on 1 December and returning to levels seen earlier on Sunday, 30 November. At this point, we are once again left wondering where the next major move in Bitcoin will originate. Resistance around $93,000 has been notably strong since mid-November. [CHART2]
(Source: TradingView)
(Past performance is not a reliable indicator of future results)
[CHART2]
Until Bitcoin can meaningfully break above $93,000, it seems we are simply in a holding pattern. Bitcoin has already had a significant move lower over a lengthy period. Without a more decisive push higher, the onus is on bulls to show that Bitcoin has further upside potential. However, a breakout above $93,000 could set the stage for a move back to $101,000, which would mark a sharp rise from current levels.2
Oil Stalls Out, Again
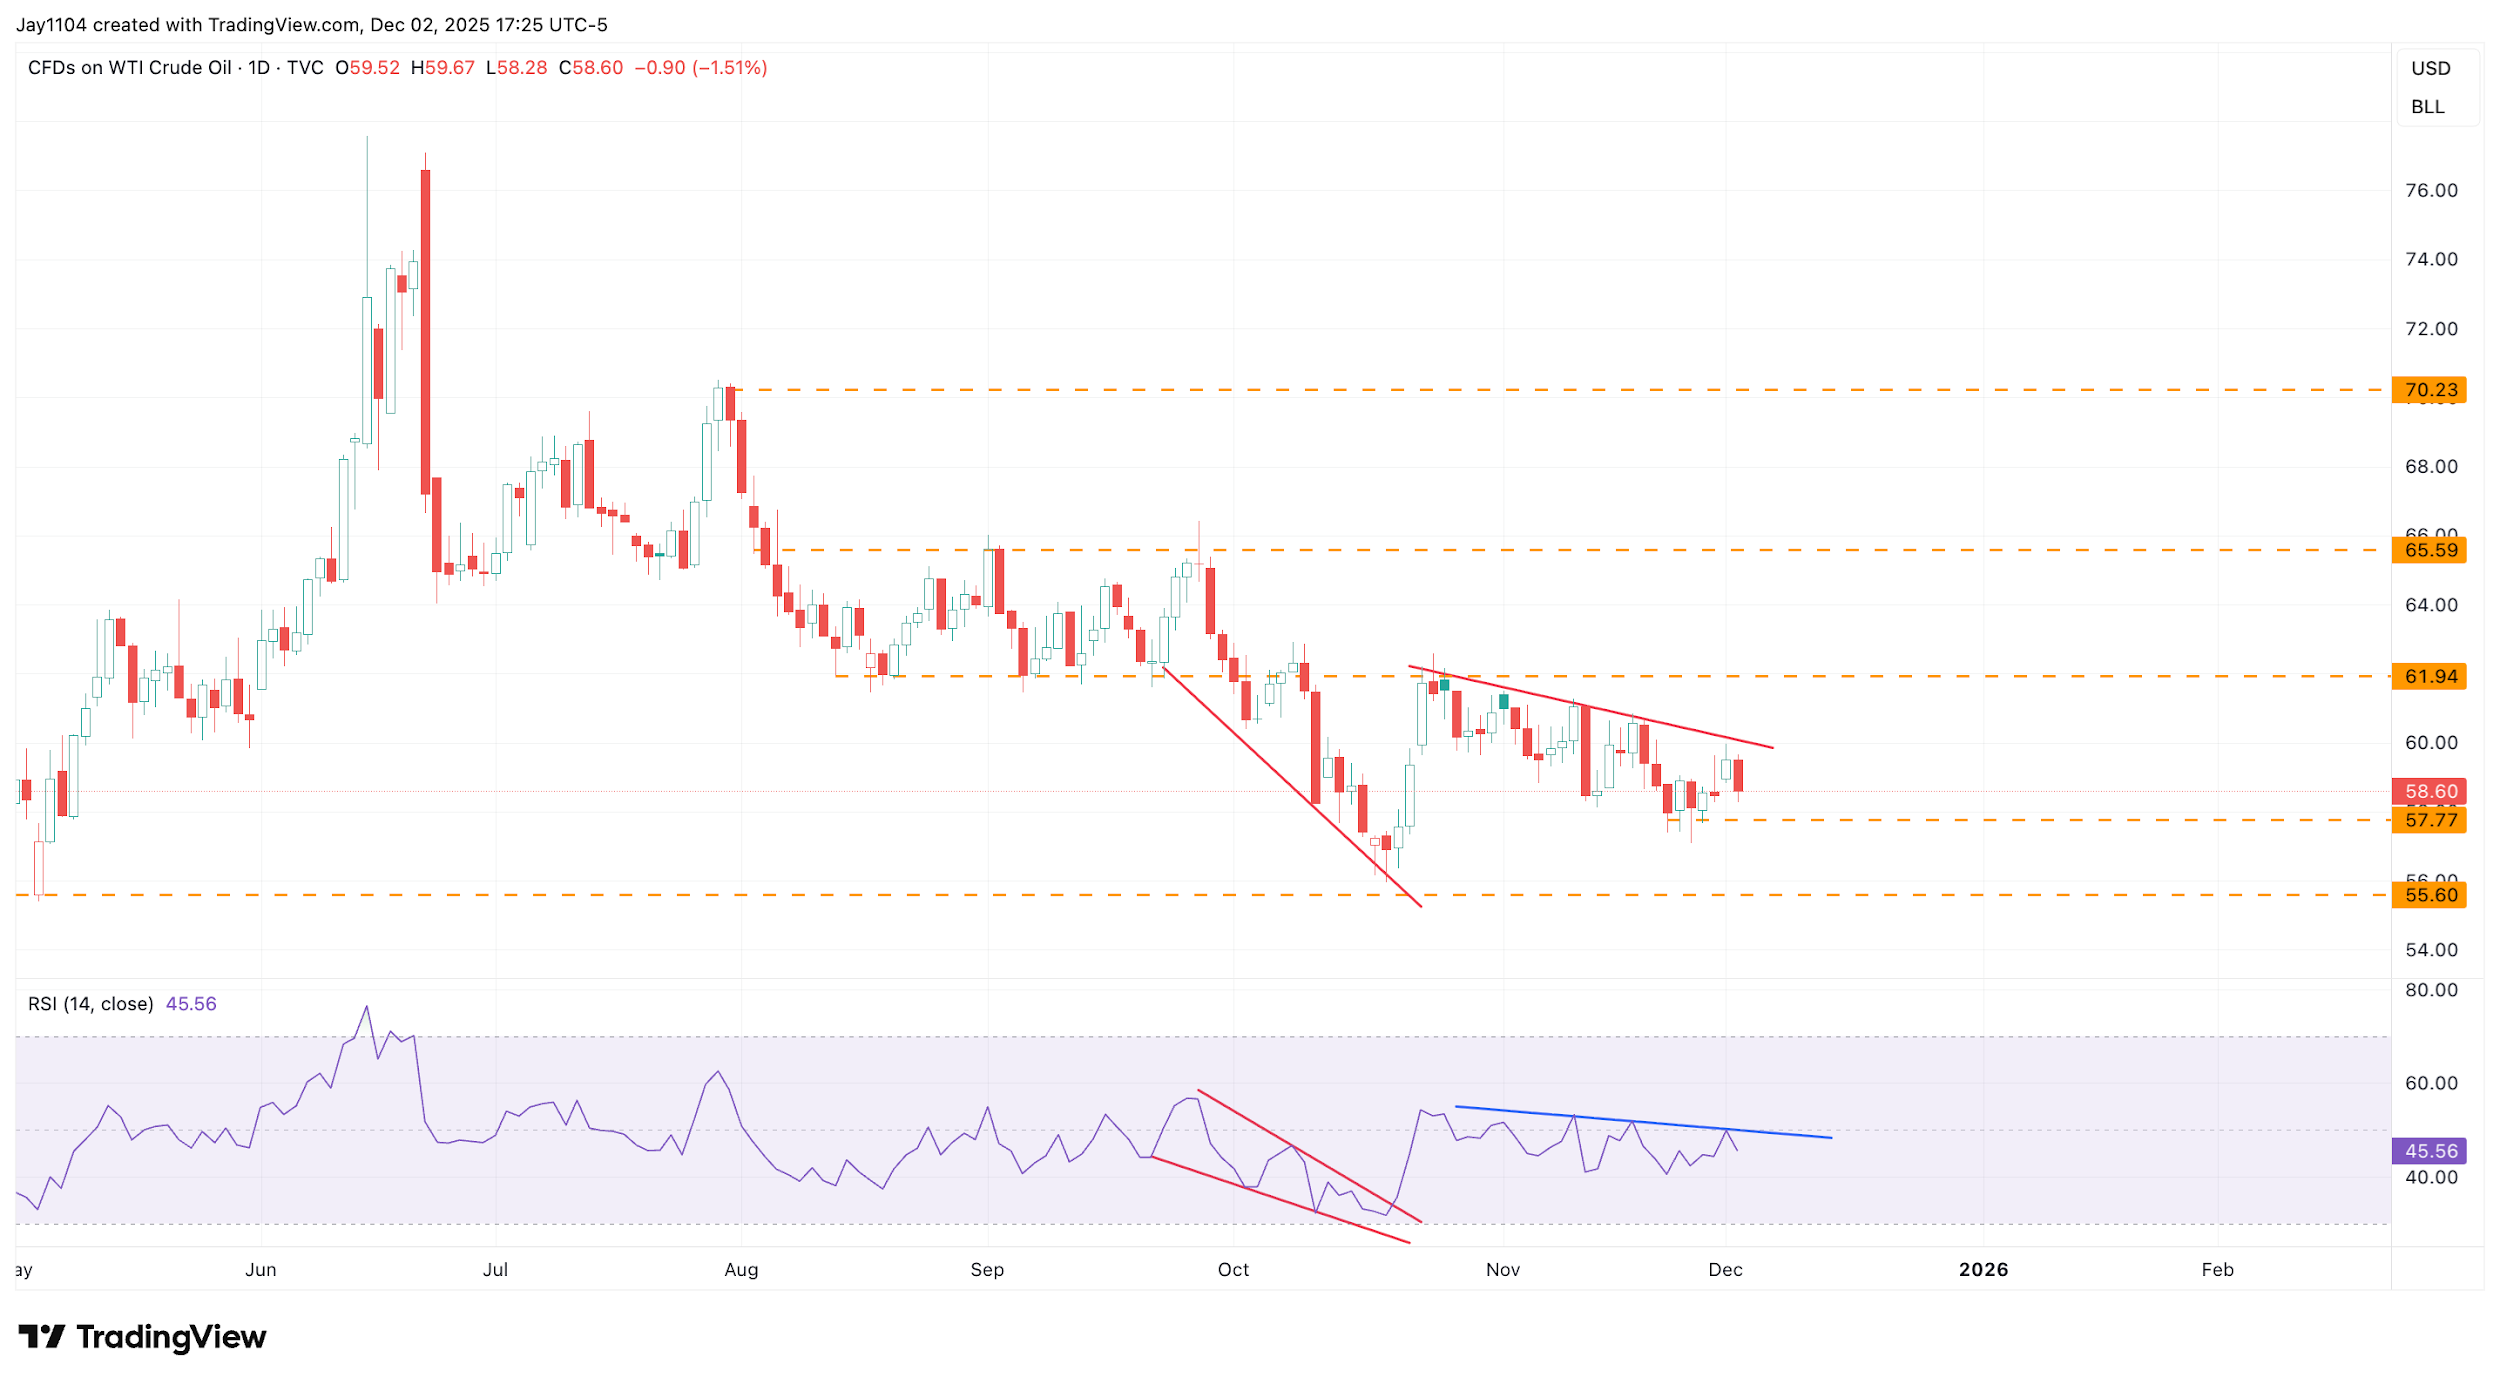
Oil prices dropped by about 1.5% on 2 December and continue to frustrate both bulls and bears. Each time oil approaches the trend line and seems ready to break out around $60, it then pulls back again, while it also keeps finding support near $58. Until we see a break below $58 or a move above $60, it appears that oil is simply consolidating in a lower-to-sideways pattern.
[CHART3]
At some point, oil will move either higher or lower. However, a clear concern is that momentum on the RSI continues to trend downward, indicating there is not yet any meaningful change in trend. It briefly appeared that such a shift might occur, but for now, we are still waiting. It may require a significant weakening of the dollar or a noticeable decline in interest rates to give oil a stronger boost — which is somewhat surprising, considering that commodities like gold and silver are thriving in the current environment, while oil remains unable to gain traction.
(Source: TradingView)
(Past performance is not a reliable indicator of future results)
[CHART3]
Costco At a Major Inflexion Point
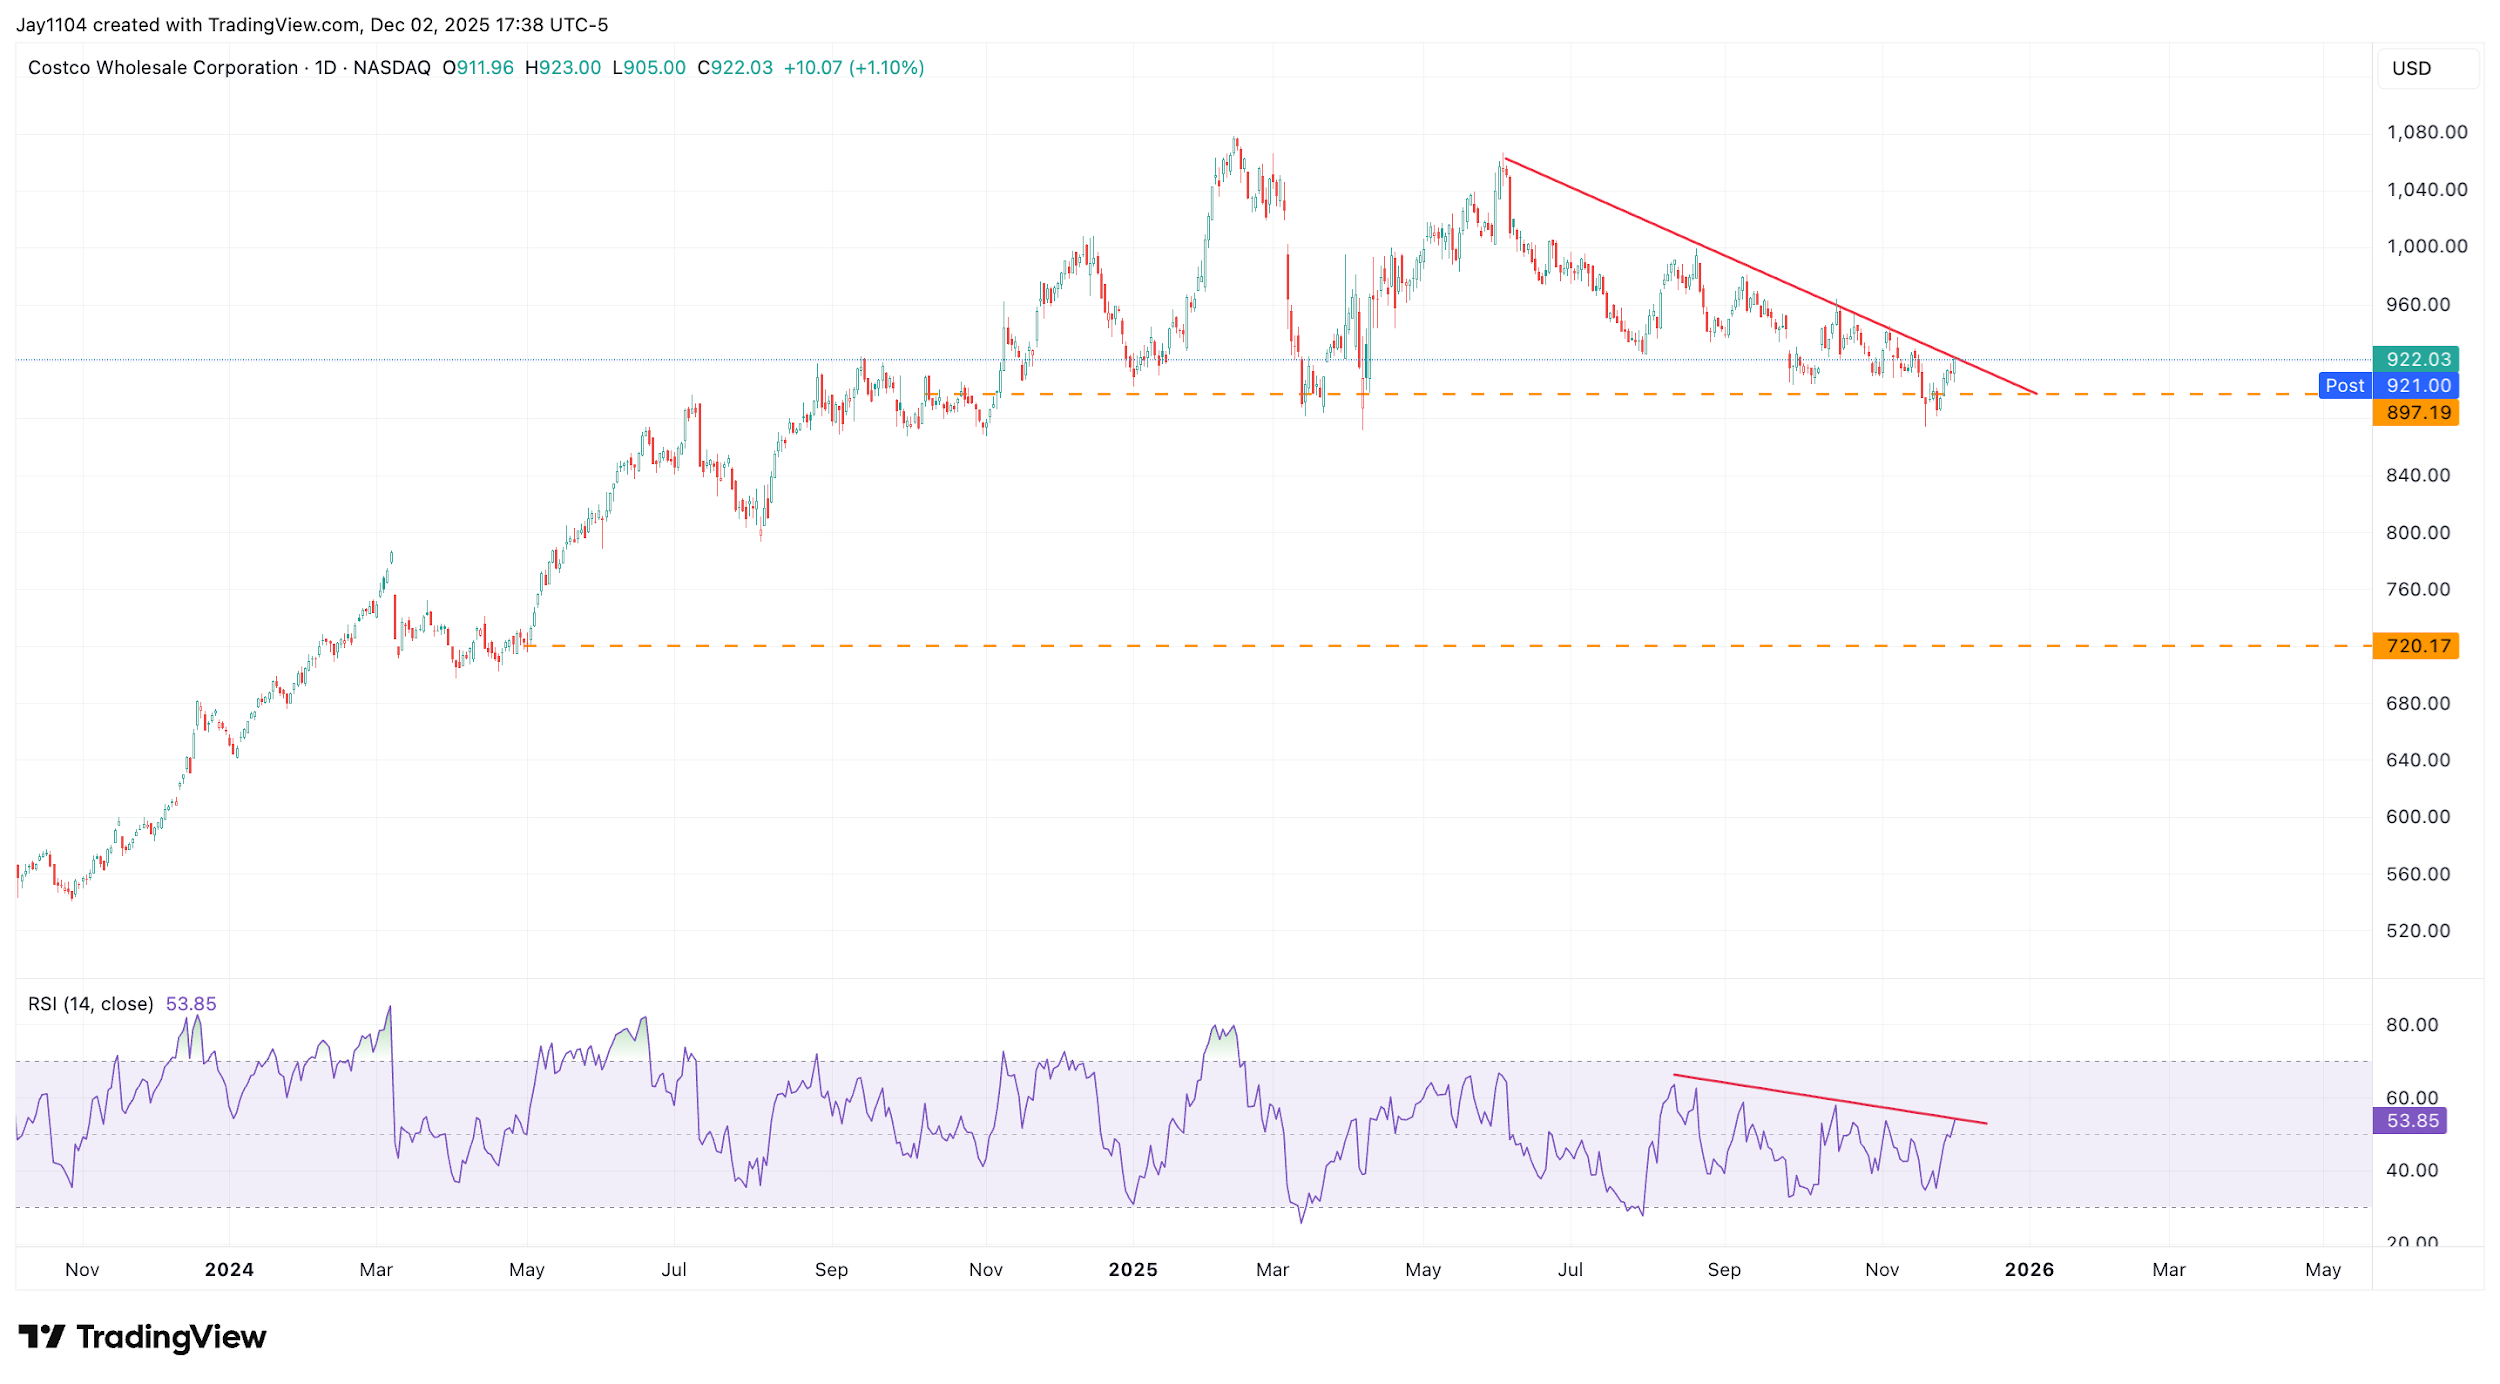
Costco (COST) seems to be at a crucial turning point, with the shares resting on a support level around $900. A drop below $900 would likely see the stock decline towards $800. However, Costco is also trading very close to a downtrend line, which indicates that a move above $930 could trigger a quite substantial rally in the coming weeks.3 [CHART4]
From a purely technical standpoint, the pattern resembles a descending triangle, which would usually indicate a downside break. However, the momentum indicator suggests a possible upward move, as the RSI nears a break of the downtrend. Essentially, Costco stands at a crucial point and could move in either direction.
(Source: TradingView)
(Past performance is not a reliable indicator of future results)
[CHART4]