Apple stock forecast: iPhone demand and services growth
Apple is a US technology company whose fiscal Q3 2026 results are due on 30 July, with focus on iPhone demand, services growth and its latest revenue outlook. Explore third-party AAPL price targets and technical analysis. Past performance is not a reliable indicator of future results.
Apple Inc (AAPL) is trading near $322.12 in early European trading on 24 July 2026, holding within the session’s $319.99–$325.84 range. Past performance is not a reliable indicator of future results.
Attention is focused on Apple's fiscal Q3 2026 earnings, scheduled for release on 30 July 2026 (9to5Mac, 2 July 2026). Market participants are awaiting further information on iPhone demand trends and services growth after the company reported strong fiscal Q2 results in April, with revenue up 17 percent year over year to $111.2 billion and diluted earnings per share of $2.01 (Apple Newsroom, 30 April 2026). The shares also recovered from a decline linked to product price adjustments earlier in July, after Apple's stock had earlier suffered its worst single-day loss in more than a year following price rises on several product lines (MacRumors, 25 June 2026), before rebounding as industry trackers maintained their unit-demand estimates for the year, with IDC projecting Apple would sell around 240 million units across 2026 (9to5Mac, 2 July 2026). Trading activity may remain elevated as investors adjust their positioning ahead of the report (Yahoo Finance, 17 July 2026).
Third-party Apple outlook: Q3 earnings put demand in focus
As of 24 July 2026, third-party Apple stock predictions point to a projected 12-month range of approximately $321 to $364 (Benzinga, 23 July 2026). Views on iPhone demand, AI monetisation and valuation account for much of this variation. The following forecasts summarise projections published by brokers and data aggregators during the period.
Stockinvest.us (short-term model forecast)
Stockinvest.us forecast an opening price of $321.44 for Apple on 24 July 2026, implying a modest gain from the previous session. The model based this near-term projection on short-term technical trend indicators (Stockinvest.us, 24 July 2026).
MarketBeat (consensus overview)
MarketBeat reported an average 12-month analyst price target of $326.83 for Apple, based on 35 analysts, with individual targets ranging from $200 to $400. The range reflects differing views on Apple's AI roadmap and services growth (MarketBeat, 17 July 2026).
TipRanks (consensus overview)
TipRanks reported an average 12-month price target of $329.62 for Apple, based on coverage from 24 analysts, with a high forecast of $400 and a low forecast of $250. The projection draws on individual valuation models from analysts tracked during the preceding three months (TipRanks, 21 July 2026).
Morgan Stanley (house view)
Morgan Stanley set a 12-month price target of $364 for Apple and maintained its 'overweight' rating. The projection followed the firm's latest review of Apple's product cycle and the potential contribution of AI-related revenue (24/7 Wall St., 23 July 2026).
Predictions and third-party forecasts are inherently uncertain, as they cannot fully account for unexpected market developments. Past performance is not a reliable indicator of future results.
Apple upcoming earnings: what to expect
Apple has confirmed that it will release its fiscal third-quarter 2026 results on Thursday, 30 July 2026, with a conference call scheduled for 2pm PT and 5pm ET on the same day (Apple, 17 June 2026).
During its previous earnings call, Apple guided for year-on-year total revenue growth of 14%–17% in the fiscal third quarter, alongside a gross margin of 47.5%–48.5% (Apple Newsroom, 30 April 2026).
In the preceding quarter, which ended on 28 March 2026, Apple reported revenue of $111.2bn, up 17% year on year, and diluted EPS of $2.01, up 22% year on year (Apple Newsroom, 30 April 2026; corroborated by StockWireX, 1 May 2026). The results exceeded the upper end of the company's guidance, despite reported supply constraints affecting its iPhone and Mac product lines (Apple Newsroom, 30 April 2026).
AAPL stock price: technical overview
As of 9.14am UTC on 24 July 2026, the AAPL stock price remained above its key moving averages, with the 20-, 50-, 100- and 200-day moving averages at approximately $311, $305, $284 and $276, respectively. This positioning indicates that the price remains above its broader multi-month trend measures. The 20-day moving average also remains above the 50-day moving average, while the short-term Hull moving average sits near $326, above the current price.
The 14-day relative strength index (RSI) stands at 58.11, placing it within an upper-neutral range. On its own, this does not indicate overbought or oversold conditions. The 14-day average directional index (ADX) stands at 26.41, slightly above the level of 25 that some technical analysts associate with an established trend. However, the indicator does not confirm the direction of that trend when viewed in isolation.
Within the cited classic pivot framework, R1 stands near $313 and R2 near $337. The central pivot is near $294, while the 200-day simple moving average (SMA) sits near $276. S1, at approximately $277, provides another downside reference level within the same data set (TradingView, 24 July 2026).
This technical analysis is for informational purposes only and does not constitute financial advice or a recommendation to buy or sell any instrument.
Apple share price history (2024–2026)
AAPL’s stock price began the period at approximately $217 in late July 2024 and traded unevenly throughout the remainder of 2024 and much of 2025. Its performance coincided with changing interest-rate expectations and periodic shifts in sentiment towards the AI sector. The stock reached a two-year low of $168.15 on 9 April 2025 during a broad market sell-off before recovering through the summer.
By late 2025, Apple had moved back above $270. The rally then accelerated into 2026 as market attention turned to the company’s AI roadmap ahead of its June developer event. Shares rose from approximately $259 in mid-January 2026 to a high of $337.03 on 17 July 2026, the highest price recorded during the two-year period.
The stock subsequently declined to close at $322.15 on 24 July 2026. This left it approximately 4.4% below its July peak but more than 48% above its $217.94 closing price two years earlier. The move from the July high also shows how quickly prices can reverse, even within a broader upward trend.
Past performance is not a reliable indicator of future results. Share prices are indicative and may differ from live market prices.
Apple (AAPL): Capital.com analyst view
Apple’s share price moved through several pronounced swings during the past two years rather than following a steady trajectory. The stock fell to a two-year low near $168 in April 2025 before recovering to a high above $337 in July 2026.
The recovery coincided with increased investor attention on Apple’s AI roadmap and services growth, alongside broader factors such as changing interest-rate expectations. However, uncertainty remains around the timing and scale of AI monetisation. Delays, changes to product plans or weaker-than-expected adoption could affect market expectations, while stronger execution could provide support.
Apple’s decline from its July 2026 peak to $322.15 on 24 July 2026 shows that prices can retrace even during a broader upward move. Analysts have cited valuation concerns and mixed expectations for iPhone demand as potential counterweights to optimism around AI and services.
Analyst price targets range from approximately $250–$400, indicating a wide spread of views rather than a clear consensus. These targets reflect third-party forecasts and may change as new financial, operational and market information becomes available. Past or simulated performance is not a reliable indicator of future results.
Capital.com’s client sentiment for Apple CFDs
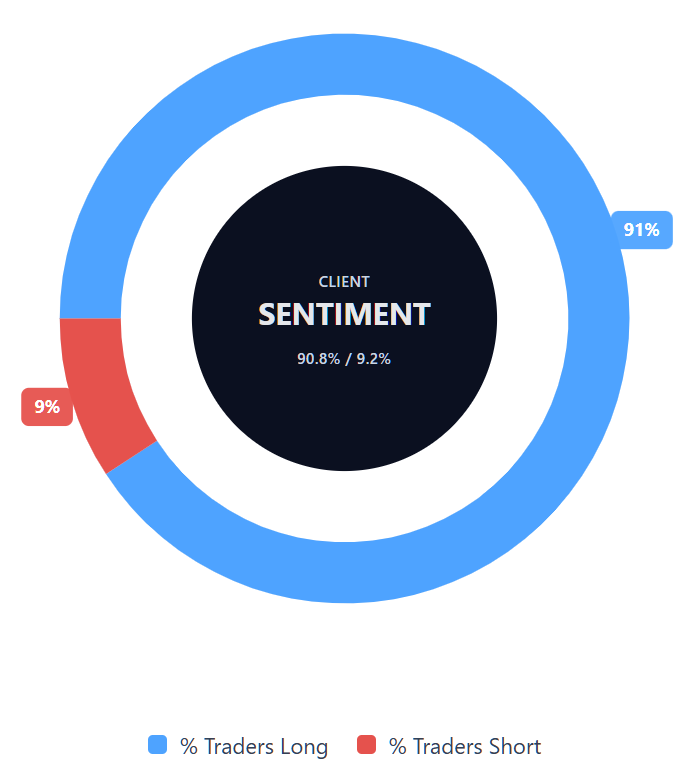
As of 24 July 2026, Capital.com client positioning in Apple CFDs stands at 90.8% buyers and 9.2% sellers, putting buyers ahead by 81.6 percentage points. This means long positions account for most open Apple positions held by Capital.com clients at the time of measurement. Client sentiment reflects open positions on Capital.com and can change. It should not be interpreted as an indicator of future price movements.
Summary – Apple 2026
- Apple traded near $322.15 at 9.14am UTC on 24 July 2026, more than 48% above its closing price two years earlier but below its July peak of $337.03.
- Technical indicators showed the shares trading above most of the cited moving averages, while the RSI stood at 58.11 and did not indicate overbought or oversold conditions on its own.
- Key factors cited by analysts include the potential monetisation of AI-related products and services, iPhone demand trends and valuation. Published price targets varied widely, ranging from $250–$400.
- Market attention was focused on Apple’s fiscal Q3 2026 earnings, scheduled for 30 July 2026, following a series of analyst rating and price-target updates published during July.
Past performance is not a reliable indicator of future results.
FAQ
Who owns the most Apple stock?
The article doesn’t identify Apple’s largest shareholder or provide an ownership breakdown. Share ownership can also change as institutional investors adjust their holdings and companies repurchase stock. Investors looking for current ownership data should consult Apple’s latest regulatory filings and recent disclosures from major shareholders. These sources can provide more up-to-date information on institutional, insider and public ownership than historical summaries or third-party estimates.
What is the five-year Apple share price forecast?
The article doesn’t provide a five-year AAPL stock forecast. The forecasts cited cover a 12-month period and range from $250–$400, reflecting different assumptions about iPhone demand, AI monetisation, services growth and valuation. Longer-term forecasts involve greater uncertainty because Apple’s earnings, product strategy, competitive position and wider market conditions may change. Any five-year projection should therefore be treated as speculative rather than as a reliable indication of future performance.
Is Apple a good stock to buy?
Whether Apple is suitable depends on an individual’s objectives, financial circumstances and risk tolerance. The article highlights both supportive and limiting factors, including services growth, Apple’s AI roadmap, iPhone demand and valuation concerns. It also notes that analyst price targets vary widely, indicating no clear consensus. This information may help readers understand the factors influencing the stock, but it doesn’t determine whether Apple is a good buy or replace independent financial advice.
Could Apple stock go up or down?
Apple’s share price could move in either direction. Stronger-than-expected earnings, resilient iPhone demand, growth in services or progress in AI monetisation could support the price. Conversely, weaker demand, delays to product plans, slower adoption of new features or valuation concerns could weigh on it. The stock’s retreat from $337.03 to $322.15 in July 2026 also shows that prices can reverse over short periods, even during a broader upward trend.
Should I invest in Apple stock?
The article doesn’t recommend investing in Apple or any other asset. It presents historical performance, technical indicators and third-party forecasts to explain the main factors that may affect the share price. Before making a decision, investors should consider their objectives, time horizon, financial circumstances and ability to absorb losses. They may also wish to seek independent financial advice, as past performance and analyst forecasts aren’t reliable indicators of future results.
Can I trade Apple CFDs on Capital.com?
Yes, you can trade Apple CFDs on Capital.com. Trading share CFDs lets you speculate on price movements without owning the underlying asset and to take long or short positions. However, contracts for difference (CFDs) are traded on margin, and leverage amplifies both profits and losses. You should ensure you understand how CFD trading works, assess your risk tolerance, and recognise that losses can occur quickly.