CFDs are complex instruments and come with a high risk of losing money rapidly due to leverage. 76% of retail investor accounts lose money when trading CFDs with this provider. You should consider whether you understand how CFDs work and whether you can afford to take the high risk of losing your money.
US English
123.52
0.13%
Market Trading Hours* (UTC) Opens on Thursday at 07:00

Mon - Fri: 07:00 - 15:30

  • Summary
  • Historical Data
  • Events
  • Income Statement
  • Balance Sheet
  • Cash Flow
  • Ownership
Trading Conditions
Spread 0.38
Long position overnight fee

Long position overnight fee


Margin. Your investment $1,000.00
Overnight fee -0.021388 %
Charges from full value of position ($-4.06)
Trade size with leverage ~ $20,000.00
Money from leverage ~ $19,000.00

Go to platform
-0.021388%
Short position overnight fee

Short position overnight fee


Margin. Your investment $1,000.00
Overnight fee -0.000834 %
Charges from full value of position ($-0.16)
Trade size with leverage ~ $20,000.00
Money from leverage ~ $19,000.00

Go to platform
-0.000834%
Overnight fee time 21:00 (UTC)
Min traded quantity 1
Currency EUR
Margin 5%
Stock exchange France
Commission on trade 0%

*Information provided by Capital.com

Airbus SE ESG Risk Ratings

High Medium Low Negligible

‘B’ score indicates good relative ESG performance and above average degree of transparency in reporting material ESG data publicly.

More ESG coverage

Key Stats
Prev. Close* 123.68
Open* 123.1
1-Year Change* 34.68%
Day's Range* 122.79 - 123.92
52 wk Range 86.52-138.76
Average Volume (10 days) 703.77K
Average Volume (3 months) 18.25M
Market Cap 107.83B
P/E Ratio 27.77
Shares Outstanding 789.18M
Revenue 61.62B
EPS 4.91
Dividend (Yield %) 1.12154
Beta 1.68
Next Earnings Date Nov 8, 2023

All data is provided by Refinitiv, except for data marked with an asterisk, which is *data provided by Capital.com

  • Last Week
  • Last Month
  • Last Year
  • Last two Years
  • Max
  • Daily
  • Weekly
  • Monthly
Date Close Change Change (%) Open High Low
Sep 26, 2023 123.68 1.23 1.00% 122.45 124.74 121.73
Sep 25, 2023 122.71 -0.75 -0.61% 123.46 124.48 121.97
Sep 22, 2023 123.76 -0.84 -0.67% 124.60 125.00 123.44
Sep 21, 2023 125.36 -2.14 -1.68% 127.50 128.10 125.34
Sep 20, 2023 129.38 0.18 0.14% 129.20 130.22 128.62
Sep 19, 2023 129.14 0.06 0.05% 129.08 130.14 128.84
Sep 18, 2023 129.82 -1.19 -0.91% 131.01 131.19 129.54
Sep 15, 2023 131.07 0.08 0.06% 130.99 132.09 130.30
Sep 14, 2023 130.40 0.56 0.43% 129.84 130.48 128.84
Sep 13, 2023 130.46 0.28 0.22% 130.18 130.93 128.66
Sep 12, 2023 130.12 -3.41 -2.55% 133.53 133.65 129.82
Sep 11, 2023 133.03 -2.58 -1.90% 135.61 135.77 132.27
Sep 8, 2023 135.35 -0.94 -0.69% 136.29 136.41 133.47
Sep 7, 2023 135.87 2.36 1.77% 133.51 136.95 133.29
Sep 6, 2023 133.89 1.58 1.19% 132.31 134.63 132.31
Sep 5, 2023 133.67 0.92 0.69% 132.75 134.65 132.31
Sep 4, 2023 133.79 0.30 0.22% 133.49 135.35 133.49
Sep 1, 2023 133.73 -0.84 -0.62% 134.57 135.41 133.55
Aug 31, 2023 135.57 1.64 1.22% 133.93 135.97 133.93
Aug 30, 2023 133.73 1.72 1.30% 132.01 134.01 131.37

Airbus Events

Time (UTC) Country Event
Monday, February 12, 2024

Time (UTC)

05:30

Country

NL

Event

Full Year 2023 Airbus SE Earnings Release

Forecast

-

Previous

-
View all events
  • Annual
  • Quarterly
2022 2021 2020 2019 2018
Total revenue 58763 52149 49912 70478 63707
Revenue 58763 52149 49912 70478 63707
Cost of Revenue, Total 48192 42518 44250 59973 54920
Gross Profit 10571 9631 5662 10505 8787
Total Operating Expense 53438 46807 50422 69139 58659
Selling/General/Admin. Expenses, Total 2240 2052 2140 6125 2435
Research & Development 3079 2746 2858 3358 3217
Interest Expense (Income) - Net Operating -134 -40 -39 -299 -330
Unusual Expense (Income) -122 1202 -57 -159
Other Operating Expenses, Total 61 -347 11 39 -1424
Operating Income 5325 5342 -510 1339 5048
Interest Income (Expense), Net Non-Operating -677 -563 -188 -224 -810
Other, Net 427 248 -432 -51 47
Net Income Before Taxes 5075 5027 -1130 1064 4285
Net Income After Taxes 4136 4174 -1169 -1325 3011
Minority Interest 111 39 36 -37 43
Net Income Before Extra. Items 4247 4213 -1133 -1362 3054
Net Income 4247 4213 -1133 -1362 3054
Income Available to Common Excl. Extra. Items 4247 4213 -1133 -1362 3054
Income Available to Common Incl. Extra. Items 4247 4213 -1133 -1362 3054
Diluted Net Income 4247 4213 -1133 -1362 3054
Diluted Weighted Average Shares 787.753 785.902 783.178 777.04 780.943
Diluted EPS Excluding Extraordinary Items 5.39128 5.36072 -1.44667 -1.75281 3.91066
Dividends per Share - Common Stock Primary Issue 1.53 1.275 0 0 1.4025
Diluted Normalized EPS 5.39128 5.23182 0.3925 2.93749 4.41724
Dilution Adjustment
Jun 2023 Mar 2023 Dec 2022 Sep 2022 Jun 2022
Total revenue 15900 11763 20644 13309 12810
Revenue 15900 11763 20644 13309 12810
Cost of Revenue, Total 13043 10103 17139 11162 10431
Gross Profit 2857 1660 3505 2147 2379
Total Operating Expense 14403 11373 18871 12336 11660
Selling/General/Admin. Expenses, Total 663 587 620 531 578
Research & Development 748 683 1114 709 670
Interest Expense (Income) - Net Operating -71 -9 -117 -34 -4
Other Operating Expenses, Total 20 9 115 -32 -15
Operating Income 1497 390 1773 973 1150
Interest Income (Expense), Net Non-Operating -25 -33 -66 -30 -60
Other, Net -22 182 122 -383 1
Net Income Before Taxes 1450 539 1829 560 1091
Net Income After Taxes 1014 438 1658 634 651
Minority Interest 46 28 21 33 31
Net Income Before Extra. Items 1060 466 1679 667 682
Net Income 1060 466 1679 667 682
Income Available to Common Excl. Extra. Items 1060 466 1679 667 682
Income Available to Common Incl. Extra. Items 1060 466 1679 667 682
Diluted Net Income 1060 466 1679 667 682
Diluted Weighted Average Shares 791.045 787.792 787.824 784.706 783.908
Diluted EPS Excluding Extraordinary Items 1.34 0.59153 2.13119 0.85 0.87
Dividends per Share - Common Stock Primary Issue 0 0 1.53 0 0
Diluted Normalized EPS 1.34 0.59153 2.13119 0.85 0.87
  • Annual
  • Quarterly
2022 2021 2020 2019 2018
Total Current Assets 63002 55694 58400 56723 58300
Cash and Short Term Investments 18547 16733 16826 12533 12477
Cash & Equivalents 12136 12608 10266 7665 7551
Short Term Investments 2724 2161 2387 3219 3064
Total Receivables, Net 9994 8872 9009 11025 12655
Accounts Receivable - Trade, Net 6454 6334 6206 6841 6867
Total Inventory 32202 28538 30401 31550 31891
Prepaid Expenses 161 392 191 147 121
Other Current Assets, Total 2098 1159 1973 1468 1156
Total Assets 115944 107047 110095 114409 115198
Property/Plant/Equipment, Total - Net 16505 16536 16674 17294 16773
Property/Plant/Equipment, Total - Gross 41269 42270 41852 41312 38249
Accumulated Depreciation, Total -24764 -25734 -25178 -24018 -21476
Goodwill, Net 13165 13028 12999 13019 13039
Intangibles, Net 3603 3339 3200 3572 3687
Long Term Investments 12335 12535 10817 17184 16246
Other Long Term Assets, Total 7308 5888 7957 6526 7088
Total Current Liabilities 52595 47807 49771 62374 60354
Accounts Payable 13261 9693 8722 14808 16237
Notes Payable/Short Term Debt 0 0 0 0 0
Current Port. of LT Debt/Capital Leases 2282 2077 3213 2511 1807
Other Current Liabilities, Total 37052 36037 37836 45055 42310
Total Liabilities 102994 97581 103650 108434 105474
Total Long Term Debt 14348 16824 17794 11914 11696
Long Term Debt 12856 15333 16256 10616 11389
Capital Lease Obligations 1492 1491 1538 1298 307
Deferred Income Tax 164 116 451 398 1318
Minority Interest 32 20 11 15 -5
Other Liabilities, Total 35855 32814 35623 33733 32111
Total Equity 12950 9466 6445 5975 9724
Common Stock 789 787 785 784 777
Additional Paid-In Capital 3837 3712 3599 3555 2941
Retained Earnings (Accumulated Deficit) 13408 6834 250 2241 5923
Treasury Stock - Common -68 -45 -42 -82 -51
Unrealized Gain (Loss) -635 456 648 819 492
Other Equity, Total -4381 -2278 1205 -1342 -358
Total Liabilities & Shareholders’ Equity 115944 107047 110095 114409 115198
Total Common Shares Outstanding 787.557 785.629 783.716 782.31 775.731
Cash 3687 1964 4173 1649 1862
Note Receivable - Long Term 26 27 48 91 65
Mar 2023 Dec 2022 Sep 2022 Jun 2022 Mar 2022
Total Current Assets 64789 63002 65234 60774 59138
Cash and Short Term Investments 17301 18547 17017 16259 17236
Cash 5676 3687 6766 7677 7607
Cash & Equivalents 8836 12136 7749 6468 7438
Short Term Investments 2789 2724 2502 2114 2191
Total Receivables, Net 9815 9994 10035 9298 9909
Accounts Receivable - Trade, Net 6125 6454 6621 6354 7016
Total Inventory 35165 32202 34764 32478 30211
Prepaid Expenses 370 161 317 439 421
Other Current Assets, Total 2138 2098 3101 2300 1361
Total Assets 118060 115944 121338 113644 110157
Property/Plant/Equipment, Total - Net 16345 16505 16636 16488 16336
Goodwill, Net 13158 13165 13154 13052 13033
Intangibles, Net 3660 3603 3646 3491 3366
Long Term Investments 13079 12335 12222 12152 12643
Note Receivable - Long Term 30 26 51 26 25
Other Long Term Assets, Total 6999 7308 10395 7661 5616
Total Current Liabilities 54975 52595 60361 55249 50425
Accounts Payable 13800 13261 13860 11692 10296
Notes Payable/Short Term Debt 0 0 0 0 0
Current Port. of LT Debt/Capital Leases 2232 2282 2126 2183 2176
Other Current Liabilities, Total 38943 37052 44375 40697 37087
Total Liabilities 103527 102994 114976 104965 99287
Total Long Term Debt 14359 14348 14782 15016 16269
Long Term Debt 12933 12856 13185 13454 14776
Capital Lease Obligations 1426 1492 1597 1562 1493
Deferred Income Tax 205 164 180 117 119
Minority Interest 35 32 29 27 25
Other Liabilities, Total 33953 35855 39624 34556 32449
Total Equity 14533 12950 6362 8679 10870
Common Stock 791 789 789 789 789
Additional Paid-In Capital 3991 3837 3833 3833 3846
Retained Earnings (Accumulated Deficit) 14034 13408 11438 10441 8883
Treasury Stock - Common -151 -68 -68 -68 -81
Other Equity, Total -4132 -5016 -9630 -6316 -2567
Total Liabilities & Shareholders’ Equity 118060 115944 121338 113644 110157
Total Common Shares Outstanding 789.063 787.557 787.488 787.488 787.355
Accrued Expenses 677 866
  • Annual
  • Quarterly
2022 2021 2020 2019 2018
Net income/Starting Line 4247 4213 -1133 -1362 3054
Cash From Operating Activities 6288 4639 -5420 3753 2318
Cash From Operating Activities 2716 2325 2831 2927 2444
Non-Cash Items -1234 -2426 1163 1484 -1544
Cash Taxes Paid 790 321 -79 1476 897
Cash Interest Paid 322 330 205 187 292
Changes in Working Capital 559 527 -8281 704 -1636
Cash From Investing Activities -3113 -2719 4126 -2864 -1635
Capital Expenditures -2464 -1928 -1759 -2340 -2285
Other Investing Cash Flow Items, Total -649 -791 5885 -524 650
Cash From Financing Activities -2115 -2179 6833 -958 -3222
Financing Cash Flow Items 134 0 91 319 179
Total Cash Dividends Paid -1181 0 0 -1280 -1161
Issuance (Retirement) of Stock, Net 109 116 85 163 68
Issuance (Retirement) of Debt, Net -1177 -2295 6657 -160 -2308
Foreign Exchange Effects 191 392 -414 -45 -54
Net Change in Cash 1251 133 5125 -114 -2593
Mar 2023 Dec 2022 Sep 2022 Jun 2022 Mar 2022
Net income/Starting Line 466 4247 2568 1901 1219
Cash From Operating Activities -479 6288 3365 1943 488
Cash From Operating Activities 495 2716 1640 1156 585
Deferred Taxes 70 -480 119 58
Non-Cash Items -773 -2096 -441 -1556 -712
Changes in Working Capital -737 1421 78 323 -662
Cash From Investing Activities -711 -3113 -1935 -604 -361
Capital Expenditures -497 -2464 -1307 -749 -337
Other Investing Cash Flow Items, Total -214 -649 -628 145 -24
Cash From Financing Activities 42 -2115 -2194 -2182 265
Financing Cash Flow Items 138 133 135 135 134
Issuance (Retirement) of Stock, Net 57 109 104 104 103
Issuance (Retirement) of Debt, Net -153 -1176 -1252 -1240 28
Foreign Exchange Effects -155 191 707 416 81
Net Change in Cash -1303 1251 -57 -427 473
Total Cash Dividends Paid -1181 -1181 -1181
Investor Name Investor Type Percent Outstanding Shares Held Shares change Holdings Date Turnover Rating
Government of France Government Agency 10.9 86153122 317597 2023-06-30 LOW
German Government Government Agency 10.8 85362726 -315158 2023-06-30 LOW
Capital Research Global Investors Investment Advisor 7.2097 56985274 33319875 2023-07-31 LOW
Sociedad Estatal de Participaciones Industriales Government Agency 4.1 32406220 89815 2023-06-30 LOW
BlackRock Institutional Trust Company, N.A. Investment Advisor 3.336 26367706 -1552783 2023-05-31 LOW
TCI Fund Management Limited Hedge Fund 3.0092 23784697 23784697 2022-07-05 LOW
The Vanguard Group, Inc. Investment Advisor/Hedge Fund 2.1026 16618484 73190 2023-07-31 LOW
Capital World Investors Investment Advisor 1.8066 14279368 6360 2023-07-31 LOW
Fidelity Management & Research Company LLC Investment Advisor 1.2079 9546975 198710 2023-06-30 LOW
Amundi Asset Management, SAS Investment Advisor/Hedge Fund 0.9972 7881759 -323553 2023-07-31 LOW
Invesco Advisers, Inc. Investment Advisor 0.8939 7065695 -50826 2023-06-30 LOW
PRIMECAP Management Company Investment Advisor 0.846 6686620 -720731 2023-06-30 LOW
Wellington Management Company, LLP Investment Advisor/Hedge Fund 0.8229 6504441 -358447 2023-07-31 LOW
CPP Investment Board Pension Fund 0.6449 5097000 2224000 2023-03-31 LOW
Deka Investment GmbH Investment Advisor/Hedge Fund 0.6268 4954320 -14447 2023-07-31 LOW
BlackRock Asset Management Deutschland AG Investment Advisor 0.5821 4600516 -41619 2023-07-31 LOW
Nuveen LLC Pension Fund 0.5417 4281486 13600 2023-07-31 LOW
BlackRock Advisors (UK) Limited Investment Advisor/Hedge Fund 0.4921 3889348 2505 2023-07-31 LOW
T. Rowe Price Associates, Inc. Investment Advisor 0.4746 3751384 -1980380 2023-06-30 LOW
Geode Capital Management, L.L.C. Investment Advisor/Hedge Fund 0.4279 3381723 68948 2023-06-30 LOW

Trading calculator

Calculate your hypothetical P&L if you had opened a CFD trade on a certain date (select a date) and closed on a different date (select a date).

Trade commission
0
  • 1:1
Leverage
1:1
  • 20
  • 100
  • 500
  • 1000
  • 10000
Investment
Trade size (Leverage x Investement):
Open

Close

Short Long

For the avoidance of doubt, this calculation does not include the costs of holding a position overnight (for which there will be additional charges)

Airbus Company profile

View the Airbus share price live to spot the best points to enter a trade.

Airbus is a European international aerospace company that designs, manufactures and delivers commercial aircraft and helicopters, plus space and defence solutions and products.

The French, German and Spanish governments currently hold a combined 26.4 per cent of its shares through state holding companies and the remaining 73.6 per cent of shares are freely floated.

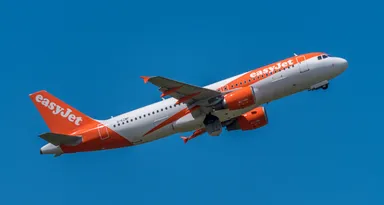
The UK was a founding member of the Airbus consortium and the company is the largest commercial aerospace firm in Britain.

Each year Airbus spends more than £5bn on deals with UK suppliers. Airbus’ UK supply chain comprises more than 4,000 companies, from Rolls-Royce and GKN to hundreds of small-to-medium-sized suppliers, making it a key player in Britain.

Although Airbus is better known for its commercial aircraft, it’s also a global leader in the defence sector. It’s the biggest defence contractor in Europe and among the top 10 defence companies worldwide.

It is also the biggest supplier of large aircraft to the Royal Air Force. Airbus is the number-three company worldwide in secure communication platforms, delivering innovative digital services for defence and cybersecurity applications.

Airbus Industrie started in 1970 as a consortium of European aviation companies – the aim being to compete with US giants such as Boeing, Lockheed and McDonnell Douglas. Various complex corporate restructurings took place over the ensuing decades.

One key trend was discernible over the first 20 years of its existence: whereas in the early years of Airbus the governments of the founding countries provided financial aid for the research and development of new aircraft. By 1989 Airbus projects were financed entirely by internally generated cash flow and external commercial sources.

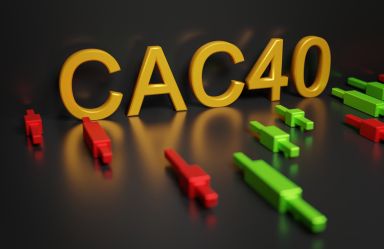
Today, Airbus shares are traded on the Euronext Paris, the Madrid and Frankfurt Stock Exchanges under the ticker symbol AIR. Airbus is a component of the CAC 40 and Euro Stoxx 50 indices.

In February 2020 the company announced heavy net losses resulting from its operations in 2019. The price of its shares nosedived and hasn’t fully recovered ever since. The AIR stock price plunged from its peak of €138 to as low as €48 on March 18, which is an accumulated loss of 65 per cent during one month.

Commenting on the company’s half-year (H1) results ended June 2020, Airbus chief executive officer Guillaume Faury said: “The impact of the Covid-19 pandemic on our financials is now very visible in the second quarter, with H1 commercial aircraft deliveries halving compared to a year ago.”

Airbus's consolidated revenues declined to €18.9bn from €30.9bn in 2019, driven by the difficult market environment with 50 per cent fewer deliveries year-to-year.

Looking at the Airbus stock price today, you can see that in a one-year period the Airbus share value has been fluctuating within a range of €48-€140. Since the large sell-off in March 2020, the Airbus stock quote grew from  €48 to €84 on June 9, 2020, a growth of 75 per cent.

Keep an eye on the Airbus share price today to spot the best points to enter and exit a trade. Explore the Airbus stock chart in real time at Capital.com and trade AIR shares with CFDs.

Industry: Commercial Aircraft Manufacturing

Mendelweg 30
LEIDEN
ZUID-HOLLAND 2333 CS
NL

Income Statement

  • Annual
  • Quarterly

News

How to Trade The Triple Top

Welcome to Part 5 of our 7-part Power Patterns series. In this series, we'll be equipping you with the skills to trade some of the most indicative price patterns which occur on any timeframe in every market.

14:13, 27 September 2023
USA flag on the background of stock charts. Financial system in USA

Q4 lookahead: US indices starting to show signs of trouble?

US indices start to draw attention as traders focus on the outlook for Q4.

07:20, 27 September 2023

USD/JPY Climbs Towards Key Highs

USDJPY’s powerful long-term uptrend has been reignited after last week’s sharply contrasting policy statements from the Federal Reserve and Bank of Japan.

11:32, 26 September 2023

EUR/USD tests key support

EUR/USD is currently testing a key support level after the Federal Reserve indicated a potential extension of higher interest rates.

14:32, 21 September 2023
Bank of England building

BoE leaves rates unchanged, GBP drops further as investors look for more clarity

The Bank of England has left rates unchanged at 5.25% with a 5-4 vote split after CPI dropped more than expected in August

11:45, 21 September 2023
British banknotes and coins photographed directly above. The coins are in a stack, placed on top of the banknotes.

GBP softer after CPI surprise, JPY focused on any further hints from Ueda

GBP drops after a softer CPI reading scares investors about the BoE intentions. JPY on the lookout for further policy tweaks from Governor Ueda.

12:42, 20 September 2023

How to Trade The Break & Retest

In this week's instalment, we delve into the Break & Retest pattern—a strategic approach to navigating breakout trades. If you've wrestled with the frustration of false breakouts, incorporating this pattern into your trading toolkit may help you overcome this challenge and put you on the path to becoming a more confident and consistent trader.

11:59, 20 September 2023

People also watch

ETH/USD

1,603.27 Price
+0.870% 1D Chg, %
Long position overnight fee -0.0616%
Short position overnight fee 0.0137%
Overnight fee time 21:00 (UTC)
Spread 5.40

US100

14,628.50 Price
+0.450% 1D Chg, %
Long position overnight fee -0.0262%
Short position overnight fee 0.0039%
Overnight fee time 21:00 (UTC)
Spread 1.8

Oil - Crude

94.10 Price
+4.330% 1D Chg, %
Long position overnight fee 0.0587%
Short position overnight fee -0.0806%
Overnight fee time 21:00 (UTC)
Spread 0.030

XRP/USD

0.51 Price
-0.410% 1D Chg, %
Long position overnight fee -0.0753%
Short position overnight fee 0.0069%
Overnight fee time 21:00 (UTC)
Spread 0.01192

Still looking for a broker you can trust?

Join the 555.000+ traders worldwide that chose to trade with Capital.com

1. Create & verify your account 2. Make your first deposit 3. You’re all set. Start trading