DXY forecast | Fed rate hold, trade deficit widens
The US Dollar Index reflects the dollar’s value against major currencies, with recent moves shaped by Fed policy, trade data and US-Iran tensions. Explore third-party DXY price targets and technical analysis. Past performance is not a reliable indicator of future results.
US dollar (DXY) is trading at 100.63 as of 1.39pm UTC on 13 July 2026, within an intraday range of 100.27–100.86.
The dollar's recent performance reflects the Federal Reserve's 17 June decision to hold its benchmark rate at 3.50%–3.75%, with an updated dot plot showing policymakers leaning towards a possible rate rise rather than a cut before year-end, ahead of the next FOMC meeting on 29 July (Cambridge Currencies, 19 June 2026). The index also traded lower earlier in the period as US-Iran tensions eased, with the dollar giving back much of the war premium built up earlier in the conflict as a fragile ceasefire revived appetite for riskier currencies (Reuters, 15 April 2026), while markets positioned ahead of an upcoming US CPI report following May's reading, which showed annual inflation at 4.2%, its highest since April 2023, driven largely by a 3.9% monthly rise in energy prices (CNBC, 10 June 2026). Separately, the Commerce Department reported that the US trade deficit widened to $77.60bn in May 2026, from a revised $54.60bn in April, broadly in line with market expectations (Trading Economics, 6 July 2026). Past or simulated performance is not a reliable indicator of future results, and this content does not constitute investment advice.
Third-party DXY outlook: Fed signals and Middle East risks
As of 13 July 2026, third-party USD forecasts outline a range of possible future levels for the index, shaped by Federal Reserve policy expectations, US inflation trends and geopolitical developments. The following summaries present each forecaster's methodology and price targets in ascending order of projected level.
Natixis (year-end index forecast)
Natixis projects that DXY will retreat towards 98 by the end of 2026, as of 11 July 2026, judging that the recent dollar rally is losing momentum. The bank cites fading support from short-term rate differentials and expects the US dollar's advance to fade into year-end (Exchange Rates UK, 11 July 2026).
MTFX Group (monthly currency-pair forecast)
MTFX Group forecasts USD/CAD at 1.43, USD/JPY at 165 and USD/CHF at 0.83 through July 2026, framing the dollar as firm but less one-sided than in prior months. The firm points to sticky inflation and a Federal Reserve that remains cautious on rate cuts as the factors keeping US rates supportive of the currency (MTFX Group, 2 July 2026).
Vantage Markets (weekly technical chart)
Vantage Markets forecasts the US Dollar Index CFD (USDX) consolidating near the 50-day moving average at 101.20, having traded near 101.15. The chart flags the level as a pivot for the week ahead, contingent on incoming US manufacturing data surprises in either direction (Vantage Markets, 29 June 2026).
AhaSignals (evidence-led rate model)
AhaSignals models a Wall Street-implied DXY reference near 99.20 against a US-Germany yield spread of 139 basis points, versus an actual DXY reference of 101.17, as of 29 June 2026. The model treats the gap between the implied and actual index levels as a signal of rate-differential dispersion rather than a fixed point forecast (AhaSignals, 29 June 2026).
Long Forecast (monthly index projection)
Long Forecast projects the Dollar Index opening July 2026 at 101.16 points, reaching a high of 102.68 and a low of 98.84 during the month, with a monthly average of 100.96, as of 13 July 2026. The model attributes the projected range to seasonal volatility patterns layered onto the current rate environment (Long Forecast, 13 July 2026).
Predictions and third-party forecasts are inherently uncertain, as they cannot fully account for unexpected market developments. Past performance is not a reliable indicator of future results.
US Dollar Index: latest macro and market context
DXY was trading near 101, broadly unchanged, on 13 July 2026 after touching an intraday high of 101.22 during the Asian session, as renewed Iran-related tensions supported demand for assets perceived as havens, including the dollar . Oil prices rose after the US and Iran exchanged fresh missile strikes over the weekend, with Iran claiming to have closed the Strait of Hormuz, a move the US disputed . Iran also carried out drone and missile attacks against US allies including Bahrain, Kuwait and Qatar . The dollar strengthened against all its G10 peers on 13 July 2026 as higher oil prices fuelled speculation that the Federal Reserve could raise rates to counter inflationary pressure, with US 2-year Treasury yields rising to a 15-month high (Saxo Bank, 13 July 2026).
Attention this week turns to US inflation data and testimony from Federal Reserve Chair Kevin Warsh, who is scheduled to appear before the House Financial Services Committee on 14 July 2026, ahead of June CPI figures (MarketWatch, 13 July 2026). A Senate committee hearing is scheduled for 15 July 2026, shortly after the release of Producer Price Index data (Bureau of Labor Statistics, 17 February 2026). Warsh reiterated at a recent Sintra appearance that price risks had eased in recent weeks, while maintaining the Fed's commitment to returning inflation to its 2% target (CNBC, 1 July 2026). Separately, annual US inflation rose to 4.20% in May 2026, its highest reading since April 2023, driven largely by an energy shock tied to the Iran conflict (CNBC, 10 June 2026). The Conference Board's next US Leading Economic Index release is scheduled for 20 July 2026 (The Conference Board, 18 June 2026).
US dollar: Technical overview
The US Dollar Index (DXY) trades near 100.63 as of 1.39pm UTC on 13 July 2026, holding above its 20/50/100/200-day simple moving averages, clustered at roughly 101 / 100 / 99 / 99. The shorter-tenor 20-day SMA sits above the 50-day, keeping a 20-over-50 alignment intact, according to TradingView data. Momentum reads neutral to moderately firm, with the 14-day relative strength index near 56.8, while the average directional index sits at 34.1, consistent with an established trend rather than a range-bound market, per TradingView and Yahoo Finance.
On the upside, the nearest classic pivot resistance sits at 102.34. A daily close above that level would put the second resistance near 103.51 back in view, based on TradingView's classic pivot set. On pullbacks, the classic pivot point near 100.63 marks initial support, with the classic first support near 99.46 below that. The 200-day simple moving average near 99 stands as the closest longer-term shelf, according to TradingView and Yahoo Finance.
The Hull moving average (9) reads near 100.97, broadly in line with the shorter EMAs, while the Ichimoku base line sits near 100.59, close to current levels (TradingView, 13 July 2026).
This is technical analysis for informational purposes only and does not constitute financial advice or a recommendation to buy or sell any instrument.
This technical analysis is provided for informational purposes only and does not constitute financial advice or a recommendation to buy or sell any instrument.
US dollar index history
The US Dollar Index has shifted materially over the past two years, starting July 2024 near 103.90 before drifting through a volatile summer that saw the index dip below 100 by late September.
By November 2024, momentum had strengthened, with DXY moving above 107 in the days following the US presidential election. That strength carried into early 2025, peaking at 109.19 on 2 February 2025, before a reversal took the index to 100.68 by 11 April 2025, as tariff-related uncertainty weighed on the greenback.
From there, DXY spent much of the second half of 2025 moving lower, bottoming near 95.91 on 29 January 2026, its weakest level of the two-year period. A recovery took hold through spring, lifting the index back above 100 by mid-June, before Middle East tensions and shifting Fed rate expectations pushed it to a 13-month high near 101.60 in late June 2026.
DXY closed at 100.70 on 13 July 2026, around 3% lower year to date, but broadly flat year on year.
Past performance is not a reliable indicator of future results. Prices are indicative and may differ from live market prices.
Capital.com analyst view: US dollar
DXY's performance across the past two years has been marked by notable swings, moving from levels above 108 in early 2025 down towards a two-year low near 95.90 in January 2026, before recovering above 100 through the first half of 2026. This pattern has coincided with shifting Federal Reserve rate expectations, evolving US trade policy, and periods of safe-haven demand tied to geopolitical developments in the Middle East. Some analysts point to sticky US inflation and a resilient rate advantage as supportive factors for the dollar, while others highlight persistent fiscal deficit concerns and diverging global growth expectations as potential headwinds for the index.
The index's recent climb towards a 13-month high near 101.60 in late June 2026 reflected, according to third-party commentary, markets pricing in a more hawkish Fed policy path amid an energy-driven inflation shock. Conversely, some forecasters caution that this strength could prove short-lived if inflation eases or if the Fed resumes an interest-rate cutting cycle later in the year. Given these opposing dynamics, the dollar's near-term path remains contingent on incoming data and policy signals, rather than a single dominant driver.
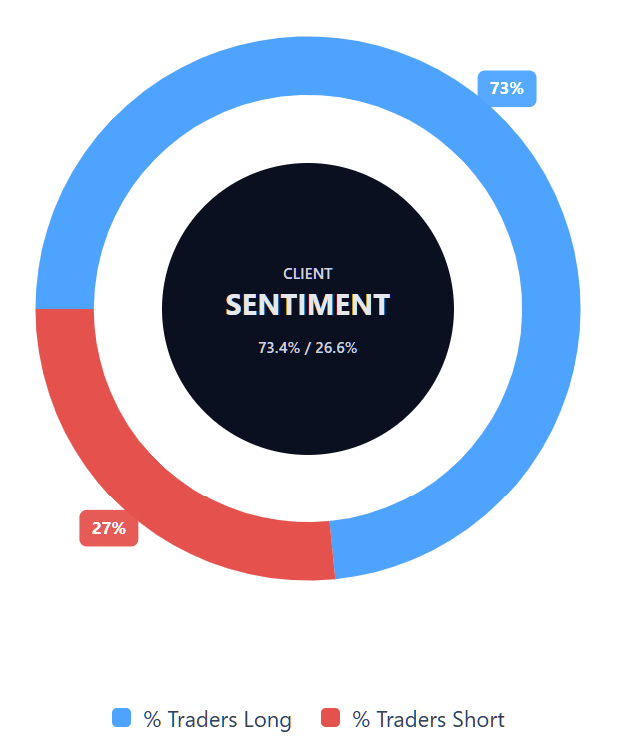
Capital.com’s client sentiment for US dollar CFDs
As of 13 July 2026, Capital.com client positioning in US dollar index CFDs shows 73.4% long versus 26.6% short. That puts long positions ahead by 46.80 percentage points and keeps positioning in long-biased territory. This snapshot reflects open positions on Capital.com and can change as market conditions evolve.
Summary – US dollar index 2026
- As of 1.39pm UTC on 13 July 2026, DXY traded near 100.63 points, well below its 108-plus early-2025 peak but above January 2026's 95.90 low.
- According to TradingView data, technicals show DXY holding above its 20/50/100/200-day moving averages, with RSI near 56.8 and ADX above 25, consistent with an established trend.
- Key drivers include Federal Reserve rate expectations, US inflation trends, geopolitical tensions in the Middle East, and shifting oil-driven inflation risks.
- Recent focus centres on US-Iran missile exchanges, upcoming CPI data, Fed Chair Kevin Warsh's congressional testimony, and diverging analyst forecasts for year-end levels.
Past performance is not a reliable indicator of future results.
FAQ
What is the US dollar forecast?
What influences US dollar index movements?
Could the US dollar index go up or down?
How can traders access US dollar exposure using CFDs on Capital.com?
Can I trade US Dollar Index CFDs on Capital.com?
You can access exposure to US dollar index CFDs on Capital.com, which lets you take long or short positions without owning the underlying currencies. Alternatively, you may wish to trade CFDs on forex pairs that include the US dollar – such as EUR/USD, GBP/USD, AUD/USD, or USD/JPY.*
*Contracts for difference (CFDs) are traded on margin, and leverage amplifies both profits and losses.