CFDs are complex instruments and come with a high risk of losing money rapidly due to leverage. 82.12% of retail investor accounts lose money when trading CFDs. You should consider whether you understand how CFDs work and whether you can afford to take the high risk of losing your money
3.8950
1.14%
Market Trading Hours* (UTC) Open now
Closes on Tuesday at 21:00

Mon - Thu: 00:00 - 21:00 22:00 - 00:00

Fri: 00:00 - 21:00

Sun: 22:00 - 00:00

  • Summary
  • Historical Data
Trading сonditions
Spread 0.0050
Long position overnight fee

Long position overnight funding adjustment


Margin. Your investment $1,000.00
Overnight funding adjustment -0.144691 %
Charges from full value of position ($-144.69)
Trade size with leverage ~ $100,000.00
Money from leverage ~ $99,000.00

Go to platform
-0.144691%
Short position overnight fee

Short position overnight funding adjustment


Margin. Your investment $1,000.00
Overnight funding adjustment 0.122771 %
Charges from full value of position ($122.77)
Trade size with leverage ~ $100,000.00
Money from leverage ~ $99,000.00

Go to platform
0.122771%
Overnight fee time 21:00 (UTC)
Min traded quantity 10
Currency USD
Margin 1.00%
Commission on trade 0%

  • Last Week
  • Last Month
  • Last Year
  • Last two Years
  • Max
  • Daily
  • Weekly
  • Monthly
Date Close Change Change (%) Open High Low
Mar 25, 2025 3.9660 0.0200 0.51% 3.9460 3.9720 3.9260
Mar 24, 2025 3.9450 0.0090 0.23% 3.9360 4.0510 3.9340
Mar 23, 2025 3.9340 0.0125 0.32% 3.9215 3.9430 3.9190
Mar 21, 2025 3.9940 0.0080 0.20% 3.9860 4.0820 3.9210
Mar 20, 2025 3.9850 -0.2560 -6.04% 4.2410 4.3000 3.9770
Mar 19, 2025 4.2430 0.1440 3.51% 4.0990 4.3080 4.0880
Mar 18, 2025 4.1000 0.0440 1.08% 4.0560 4.1700 4.0230
Mar 17, 2025 4.0550 -0.1080 -2.59% 4.1630 4.2600 4.0270
Mar 16, 2025 4.1640 0.0045 0.11% 4.1595 4.1800 4.1480
Mar 14, 2025 4.1310 0.0650 1.60% 4.0660 4.1810 4.0070
Mar 13, 2025 4.0640 0.0100 0.25% 4.0540 4.2340 3.9930
Mar 12, 2025 4.0560 -0.3150 -7.21% 4.3710 4.4110 4.0360
Mar 11, 2025 4.3720 -0.0870 -1.95% 4.4590 4.6120 4.3590
Mar 10, 2025 4.4580 -0.2065 -4.43% 4.6645 4.6940 4.4560
Mar 9, 2025 4.6650 0.1320 2.91% 4.5330 4.9205 4.5325
Mar 7, 2025 4.4200 0.1290 3.01% 4.2910 4.4450 4.1540
Mar 6, 2025 4.2890 -0.1720 -3.86% 4.4610 4.4870 4.2740
Mar 5, 2025 4.4600 0.1480 3.43% 4.3120 4.5300 4.2460
Mar 4, 2025 4.3130 0.1600 3.85% 4.1530 4.5600 4.0730
Mar 3, 2025 4.1540 0.3810 10.10% 3.7730 4.1830 3.7660

Trading calculator

Calculate your hypothetical P&L if you had opened a CFD trade on a certain date (select a date) and closed on a different date (select a date).

Trade commission
0
  • 1:1
  • 5:1
  • 10:1
  • 20:1
  • 50:1
  • 100:1
Leverage
100:1
  • 20
  • 100
  • 500
  • 1000
  • 10000
Investment
Trade size (Leverage x Investement):
Open

Close

Short Long

For the avoidance of doubt, this calculation does not include the costs of holding a position overnight (for which there will be additional charges)

Natural Gas

Discover US Natural Gas price in real-time with our live chart.

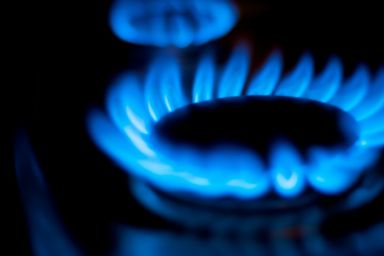
Natural gas is a vital fuel, it currently supplies 22 per cent of the world's energy. Widely used for both commercial and industrial purposes, it is often chosen as an investment option by international investors seeking true asset class diversification in their portfolio.

According to the historical natural gas price chart, the commodity reached a record low of $1.04 in January 1992 and a record high of $15.78 in December 2005.

You can stay on top of the latest natural gas price with Capital.com.

Today, natural gas is considered one of the cleanest and safest fossil fuels available. It’s certainly a much more environmentally-friendly option than coal or petroleum. In the age of environmentalism, these unique properties of the commodity make it a popular energy choice. Consequently, investment in natural gas has increased in recent years.

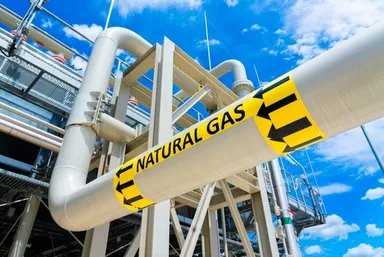
Natural gas is used across the globe as an effective and inexpensive fuel for a variety of applications, from heating to cooking and in the generation of electricity. Every year, the world’s largest countries extract billions of cubic metres of the commodity.

Since the 2008 shale boom the United States has dominated the market as the world’s largest producer of natural gas. Today, the country operates over 900 public gas systems. Other major producers include Iran, Canada, Qatar, China and Russia, which supplies gas to Germany and the majority of Eastern Europe.

Natural gas is unique among commodities as its supply often does not meet the demand. Known as “seasonal mismatch”, demand is the highest and typically exceeds supply during the winter, while in summer months, demand is lower than the available supply.

Even small changes in the demand or supply of natural gas can cause significant price fluctuations. The price highly depends on the production process, weather conditions, economic growth, storage supplies and substitutes, such as hydroelectric, wind and solar power.

Discover the latest natural gas price today and trace the historical value of the commodity over the years with Capital.com’s natural gas chart.

People also watch

BTC/USD

87,995.75 Price
+0.110% 1D Chg, %
Long position overnight fee -0.0616%
Short position overnight fee 0.0137%
Overnight fee time 21:00 (UTC)
Spread 50.00

US100

20,218.10 Price
+0.320% 1D Chg, %
Long position overnight fee -0.0234%
Short position overnight fee 0.0012%
Overnight fee time 21:00 (UTC)
Spread 1.8

Gold

3,022.32 Price
+0.300% 1D Chg, %
Long position overnight fee -0.0155%
Short position overnight fee 0.0073%
Overnight fee time 21:00 (UTC)
Spread 0.30

ETH/USD

2,077.37 Price
-0.470% 1D Chg, %
Long position overnight fee -0.0616%
Short position overnight fee 0.0137%
Overnight fee time 21:00 (UTC)
Spread 1.75
video

Still looking for a broker you can trust?

Join the 710,000+ traders worldwide that chose to trade with Capital.com

1. Create & verify your account 2. Make your first deposit 3. You’re all set. Start trading