Trading the Complex Pullback
The pullback remains a valuable structure for those looking to engage with existing trends at favourable levels of risk and potential reward. Yet, in live markets, these formations rarely appear in their simplest form. Recognising the difference between the ideal and the complex pullback can help traders refine their approach and manage trades more effectively.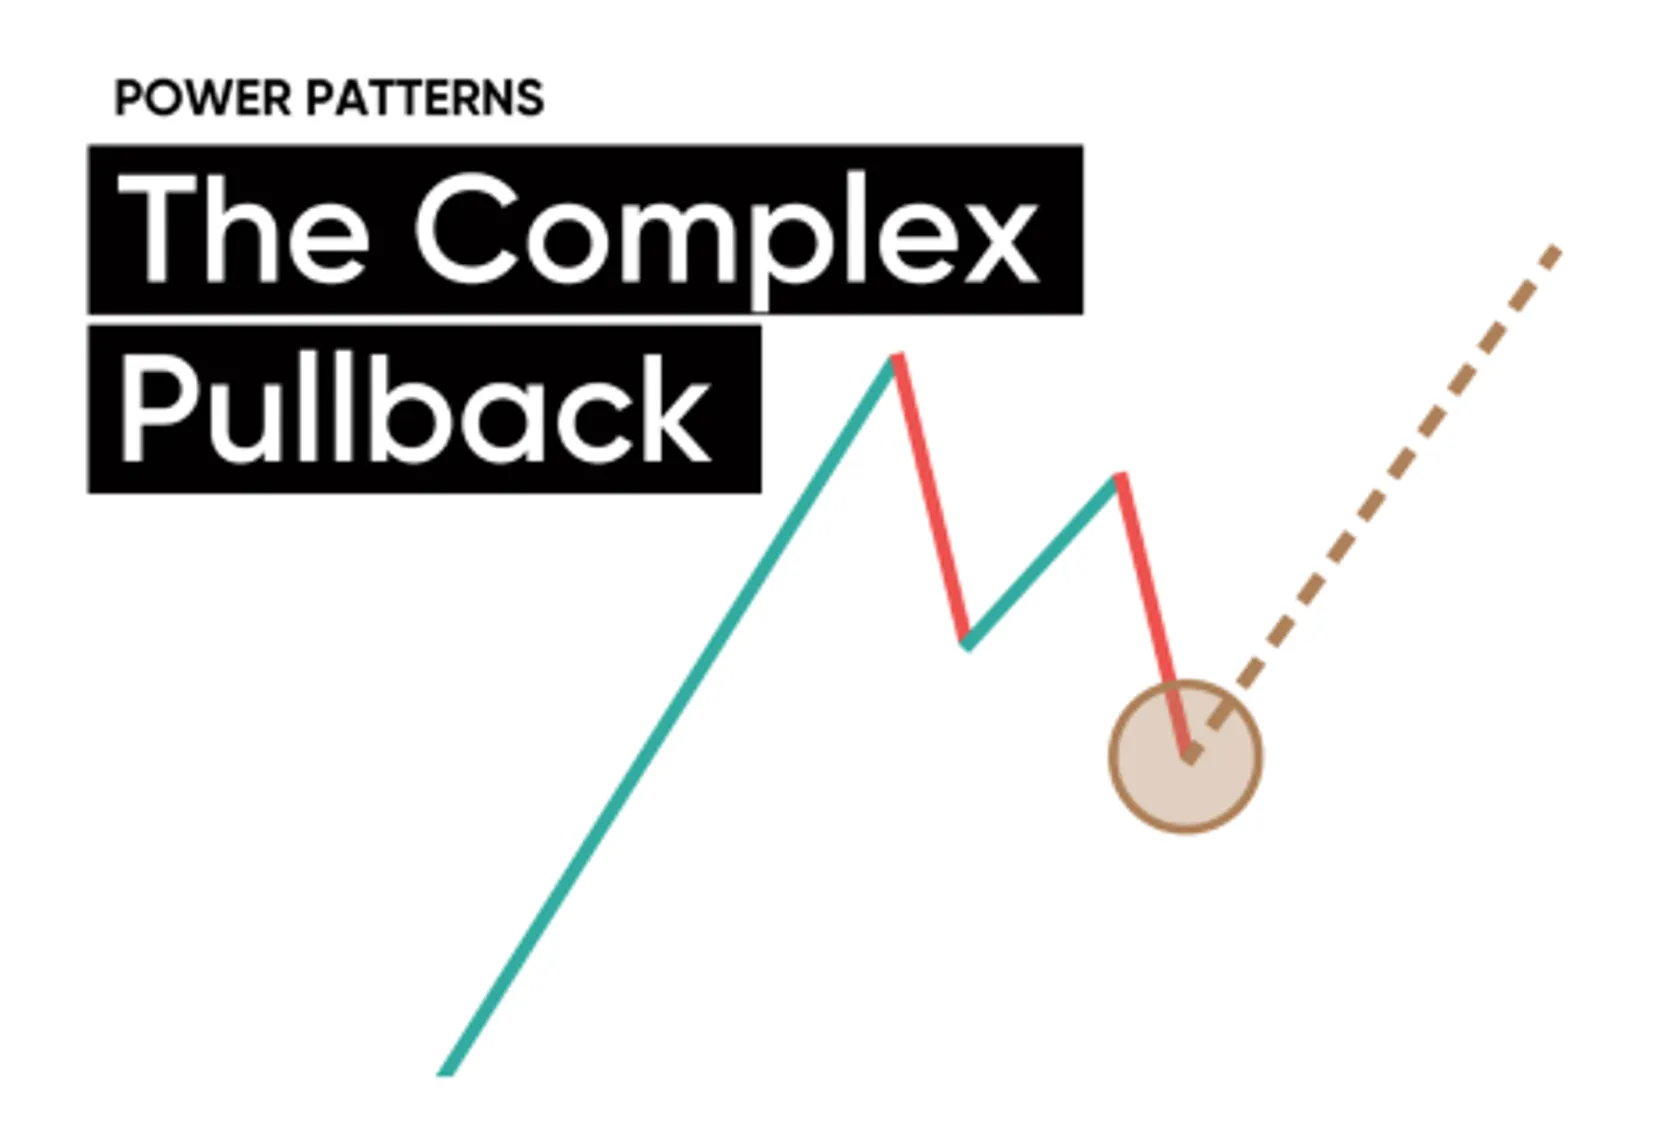
The pullback is one of the most valuable trading patterns, offering an opportunity to join established trends at favourable risk–reward levels. However, in real-world trading scenarios, simplicity often gives way to complexity. Understanding how pullbacks deviate from the ideal pattern is essential. The complex pullback provides traders with a clear framework for analysing and trading pullbacks in practical market conditions.
You’ll learn:
- How to recognise a complex pullback
- Which indicator can make complex pullbacks easier to interpret
- A structured technique to achieve greater consistency in entry, stop placement and trade management
Key characteristics of the complex pullback
A complex pullback pattern forms within a trending market and typically unfolds in several stages:
- Initial trend move: The market shows a clear directional move, characterised by sustained price action in one direction.
- Pause or consolidation: After this move, the market pauses or consolidates, often moving briefly against the prevailing trend.
- Failed resumption: The market then attempts to continue the trend, but the move fails to gather momentum, leading to a deeper pullback.
- Multiple countertrend legs: What sets the complex pullback apart is the presence of several countertrend swings within the overall structure. These can make the pattern more intricate and difficult to interpret.
Keltner channels and complex pullbacks
The correct application of Keltner channels can make analysing complex pullbacks more straightforward.
Keltner channels are created by placing a multiple of the Average True Range (ATR) around a moving average. In this case, a 2.5 ATR is plotted around a 20-day exponential moving average (20 EMA). The upper channel is set 2.5 ATR above the 20 EMA, while the lower channel sits 2.5 ATR below it.
Price typically needs to show strong relative momentum to reach or exceed either boundary of the Keltner channel. As such, Keltner channels can help define the initial trend move that precedes the formation of a complex pullback.
The 20 EMA also serves as a useful reference point for identifying when a complex pullback may be nearing completion.
When Keltner channels are applied to a chart, a bullish pattern often shows price moving into the upper channel before retracing towards the 20 EMA. In contrast, a bearish pattern tends to see price reaching the lower channel before rebounding towards the moving average.
Using Keltner channels to observe complex pullbacks can reduce subjectivity and help establish a more structured and consistent approach to analysis.
How to trade the complex pullback
Entry: Enter on a fakeout at the pullback extremes. In Part 1 of our Power Patterns series, we introduced the fakeout pattern, which occurs when the market breaks below support and then closes back above it (or breaks above resistance and then closes back below it). Using the fakeout pattern to identify potential entries within complex pullbacks is an advanced technique that requires practice and discipline. It can, however, provide defined levels of risk and potential reward.
Stop: Stops may be placed below the fakeout low in a bullish setup or above the fakeout high in a bearish setup. Another approach is to base the stop on a multiple of the ATR, allowing flexibility relative to market volatility.
Price target: Initial price targets are typically the swing highs or lows formed before the complex pullback. These levels can act as reference points for partial profit-taking or stop adjustments. Secondary targets may be identified using Keltner channels, as illustrated in the examples below.
Managing risks and pitfalls
Risk management: Alongside stop placement, it is essential to apply robust risk management practices, including appropriate position sizing, reviewing the economic calendar, and maintaining a diversified trading portfolio.
Additional analysis: Avoid relying solely on the complex pullback pattern when assessing the market. Combine technical observations with broader context, such as fundamental analysis and market sentiment, to develop a well-rounded perspective.
FAQ
What is a complex pullback?
A complex pullback is a multi-legged price correction that develops within an existing market trend. Unlike a simple pullback, it features several countertrend movements before the trend resumes. Understanding this structure can help traders interpret market rhythm and distinguish temporary pauses from potential reversals.
What role does the fakeout pattern play in complex pullbacks?
A fakeout pattern occurs when price briefly breaks through support or resistance but then closes back within its previous range. Within complex pullbacks, this pattern can help signal potential exhaustion or continuation, depending on broader market context.
Why is risk management important when analysing complex pullbacks?
Effective risk management supports consistency and control in varying market conditions. Applying methods such as measured position sizing, strategic stop placement, and monitoring key economic events can help manage exposure to volatility.
What are the main pitfalls when interpreting complex pullbacks?
Common challenges include mistaking consolidation for a reversal, entering before confirmation, or relying solely on technical indicators without considering broader market influences. Combining technical analysis with contextual understanding and disciplined risk management can support a more structured approach.