Ripple price prediction: Third-party outlook
Ripple (XRP) is a cryptocurrency linked to the Ripple network, often analysed through market forecasts, technical indicators and broader crypto trends. Explore third-party XRP price targets and technical analysis.
Ripple (XRP) is trading around $1.74 as of 11:30am (UTC) on 30 January 2026, within an intraday range between $1.73 and $1.91 on Capital.com’s platform. Past performance is not a reliable indicator of future results.
Price action is unfolding amid renewed cryptocurrency market focus on XRP following early-January gains, which some analysts have linked to spot XRP exchange-traded fund (ETF) inflows reported to exceed $1bn, alongside lower on-exchange token balances (Forbes, 8 January 2026). The backdrop also includes greater regulatory clarity after the resolution of Ripple’s legal dispute with the US Securities and Exchange Commission in 2025, while XRP remains sensitive to shifts in overall crypto risk appetite (Reuters, 8 August 2025).
Ripple price prediction 2026-2030: Analyst price target view
As of 30 January 2026, third-party XRP price predictions show a broad dispersion of potential outcomes for 2026, reflecting differing assumptions around institutional adoption, exchange-traded product flows, and the wider crypto risk environment. The summaries below outline selected third-party forecasts and their stated assumptions; all figures represent forward-looking estimates rather than guarantees.
Changelly (crypto exchange research)
Changelly’s XRP outlook indicates that its model assumes a minimum price around $3.18, an average near $3.26, and a maximum close to $3.49 for 2026. The methodology is described as drawing on historical price patterns and technical signals, alongside an assumption of continued participation across major altcoins (Changelly, 28 January 2026).
Finance Magnates (market commentary)
A Finance Magnates article cites CoinCodex as forecasting that XRP could dip toward around $1.87, compared with spot levels near $1.89 at the time of writing. This scenario is presented as one of several potential downside paths, discussed in the context of support levels, macro risk appetite, and technical indicators (Finance Magnates, 26 January 2026).
Crypto.news (macro and technical scenario analysis)
Crypto.news reviews possible XRP price paths following a Federal Reserve decision. It notes that one CoinCodex model projected near-term trading in the high-$1 range, with a broader 2026 range extending toward the low-$3 area. The analysis highlights shifting expectations for US interest rates, overall crypto sentiment, and key technical levels as factors shaping these scenarios (Crypto News, 28 January 2026).
Predictions and third-party forecasts are inherently uncertain, as they cannot fully account for unexpected market developments. Past performance is not a reliable indicator of future results.
XRP price: Technical overview
On the daily chart, XRP/USD is trading around $1.74 as of 11:30am (UTC) on 30 January 2026, holding below a declining cluster of simple moving averages, with the 20-, 50-, 100- and 200-day SMAs near 1.97, 1.97, 2.11, and 2.53, respectively. The 14-day RSI sits in the low-30s, pointing to subdued momentum within the lower-neutral range, while the ADX, in the high-20s, suggests an established but not extreme directional trend.
On the upside, the first level to monitor is the classic R1 pivot around 2.12, with R2 near 2.39 coming into focus only after a sustained daily close above the initial resistance zone. On pullbacks, the classic pivot near 1.94 marks initial support, followed by the 100-day SMA around 2.11 as the next moving-average reference. A decisive break below this area could expose the S1 region near 1.67 (TradingView, 30 January 2026).
This technical analysis is provided for informational purposes only and does not constitute financial advice or a recommendation to buy or sell any instrument.
Ripple price history (2024–2026)
XRP’s price spent much of 2024 trading below $1, before closing the year at approximately $2.08 on 31 December 2024, following a sharp rally from sub-$0.80 levels in November and early December. Through 2025, the token extended that rebound, moving above $3 in March and reaching closing levels just over $3.08 in mid-September, before easing back to finish the year near $1.84 on 31 December 2025. By 30 January 2026, XRP had retreated further from its 2025 highs, ending the session around $1.75, as volatility picked up again during January trading.
Past performance is not a reliable indicator of future results. Share prices are indicative and may differ from live market prices.
Capital.com analyst view: Ripple
Ripple (XRP) has undergone a marked shift in trading profile over the past two years, moving from sub-$1 levels in late 2024 to testing prices above $3 during parts of 2025, before retreating toward the mid-$1 area by late January 2026. This trajectory illustrates how XRP has tended to respond rapidly to changes in the broader digital-asset environment, with phases of optimism around regulated products and regulatory developments often followed by periods of profit-taking and wider risk aversion.
From a fundamental perspective, XRP sits at the intersection of payments technology and crypto markets. Ripple’s network is positioned for fast, low-cost cross-border transfers and continues to work with banks and payment providers, while remaining exposed to regulatory developments, competition from alternative payment rails, and shifts in speculative interest. For CFD traders, XRP’s history of large percentage moves over relatively short periods can present both opportunity and heightened downside risk, particularly when leverage is involved. Any potential benefit from volatility therefore needs to be weighed against the possibility of rapid losses if market conditions change.
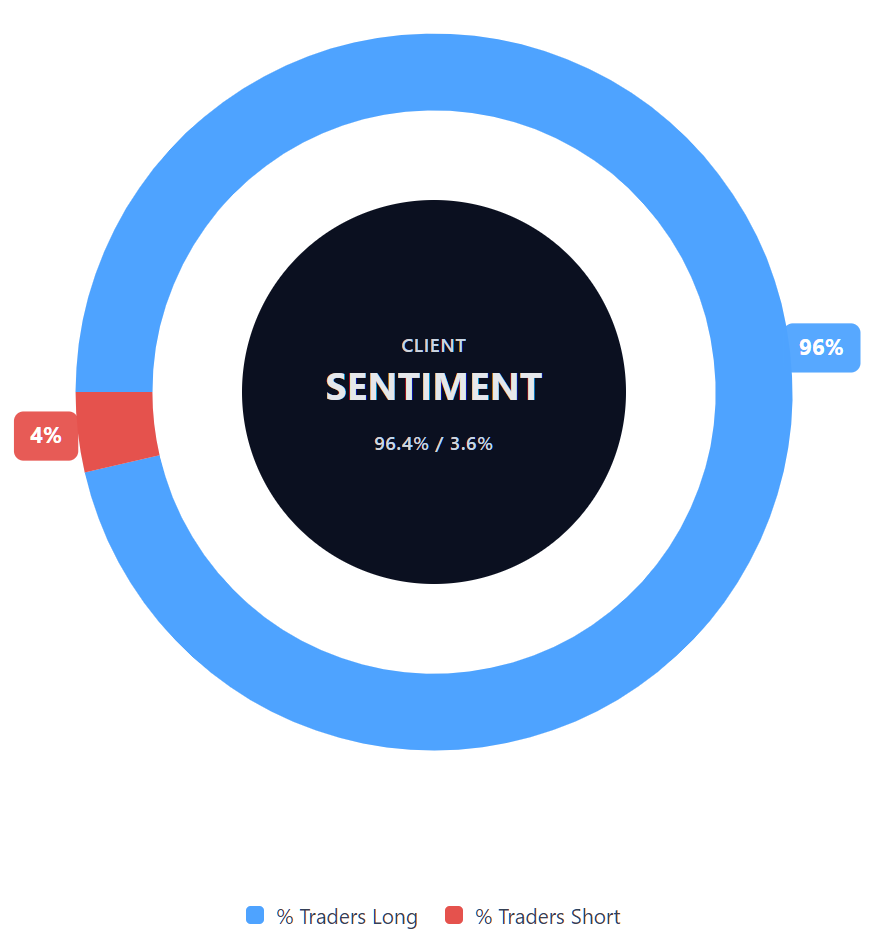
Capital.com’s client sentiment for Ripple CFDs
As of 30 January 2026, Capital.com client positioning in Ripple CFDs remains heavily skewed toward long positions, with buyers accounting for 96.4% and sellers 3.6%, leaving buyers ahead by roughly 93 percentage points. This snapshot reflects open positions on Capital.com at the time and can change as market conditions evolve.
Summary – Ripple (2026)
- Ripple (XRP) is trading around $1.74 as of 11:30am (UTC) on 30 January 2026, following an intraday range between $1.73 and $1.91.
- Over the past two years, XRP has moved from below $1 in late 2024 to peaks above $3 during 2025, before easing back toward the mid-$1 area by the end of the year.
- Technical indicators currently show price trading below its 20-, 50-, 100- and 200-day moving averages, with the RSI in the low-30s and the ADX pointing to an established trend.
- Looking ahead, XRP continues to be influenced by a combination of payments-related developments, the broader crypto risk backdrop, and evolving expectations around regulation and product innovation, leaving scope for sharp moves in either direction.
Past performance is not a reliable indicator of future results.
FAQ
What is the latest Ripple crypto price prediction?
Recent third-party forecasts for Ripple (XRP) published in late 2025 and January 2026 show a broad range of potential outcomes for 2026 rather than a single consensus view. Indicative scenarios cited by analysts span from the low-$2 area to the mid-$3 range, depending on assumptions around regulation, institutional participation, and broader crypto market conditions. These projections are forward-looking estimates rather than guarantees and can change as new information emerges.
Who owns the most Ripple?
Ripple Labs is the largest holder of XRP, controlling a substantial portion of the total supply through company holdings and escrow arrangements. A significant amount of XRP is released periodically from escrow under predefined conditions, which is designed to provide greater transparency around supply. Beyond Ripple Labs, ownership is distributed across exchanges, institutional participants, and individual holders, with no publicly available data offering a complete real-time breakdown.
How many Ripple coins are there?
XRP has a fixed maximum supply of 100 billion tokens, all of which were created at launch. Unlike some cryptocurrencies, no new XRP is mined over time. A large share of the supply has historically been held by Ripple Labs, with portions placed into escrow and released gradually. The circulating supply can therefore change over time, depending on escrow releases and market activity, while the total supply cap remains unchanged.
Could Ripple’s price go up or down?
Ripple’s price can move in either direction and has historically shown periods of sharp gains followed by relatively rapid pullbacks. Price movements tend to reflect a combination of factors, including broader crypto market sentiment, regulatory developments, technical levels, and shifts in risk appetite. As with other cryptocurrencies, XRP can experience heightened volatility, meaning prices may change quickly over short periods, increasing both potential opportunity and downside risk.
Should I invest in Ripple?
Whether Ripple is suitable will depend on individual circumstances, objectives, and risk tolerance. Cryptocurrencies are complex and volatile instruments, and prices can move against expectations. Information and forecasts discussed in market analysis do not constitute investment advice and do not account for personal financial situations. Anyone considering exposure to XRP may wish to carefully assess the risks and, where appropriate, seek independent financial advice before making any decision.
Can I trade Ripple (XRP) CFDs on Capital.com?
Trading Ripple CFDs on Capital.com lets you speculate on price movements without owning the underlying asset and to take long or short positions. However, contracts for difference (CFDs) are traded on margin, and leverage amplifies both profits and losses. You should ensure you understand how CFD trading works, assess your risk tolerance, and recognise that losses can occur quickly.