S&P 500, Nasdaq, DAX 40, FTSE 100 Forecast for the Week Ahead
Traders focus on the latest inflation data to provide some guidance
With central bank meetings out of the way, markets are now focused on all the latest inflation data set to be published next week. As key standouts, on Tuesday we’ll see US CPI at 1.30 PM GMT, followed by UK CPI and PPI at 7 AM GMT on Wednesday, and US CPI and PPI on Thursday at 1.30 PM.
The feeling I get from looking at equity markets is that traders are still confused as to where to place their expectations on what 2023 will entail for economic growth. The US is used as a generalised benchmark for risk appetite and the key equity indices have been dropping over the past few days despite an attempted upward reversal on Tuesday. Essentially, this move lower follows on from the higher-than-expected jobs data seen last Friday, which spooked those hoping for a more dovish Fed in the coming months.
As I mentioned in a note I posted on Wednesday:
In reality, the NFP reading on Friday, whilst slightly shocking, is just one reading, which could also have been slightly skewed by seasonality factors. The data from December is still painting a much weaker picture of the economy, and I expect that is where traders are putting most of their focus on. That’s why the rest of the data for January is going to be key in the next couple of weeks. The CPI on Tuesday will be very closely watched and I expect volatility to ramp up around the event as markets try and figure out whether the jobs data is the one outlier or if it's an early indication of the fact that there may not be a recession this year as previously thought.
At the end of the day, strong economic data should be positive for equity markets as it reflects future profitability for companies, but markets seem to be stuck in this “need the Fed to reverse tightening” mentality that makes it hard to try and forecast what the reaction will be for the upcoming data.
I still stand by this and believe that traders feel pretty lost and need further clarification for any further momentum to be achieved. As can be seen in the chart below, retail traders are feeling positive about the stock market, which can be taken to understand that they expect the inflation data to fall in line with the softer economic growth scenario, which has been the key driver of bullish equity markets for the past 4 months. Take the resurgence of meme stocks as an indicator of investors trying to find bargains. Because of this, there is a greater risk of a positive surprise in the data, where we see a higher-than-expected reading, and equities may take a bit of a dive.
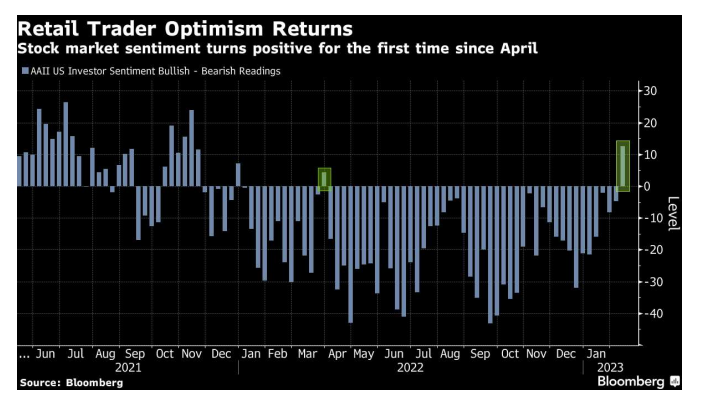
Retail trader sentiment . Photo: John Authers. Source: bloomberg
On the charts, both the S&P 500 and the Nasdaq are holding above their 2022 descending trend lines and their 200-day SMAs but they have failed to make a breakout above last week’s highs and are now building on the bearish momentum with lower highs and lows.
The S&P 500 is nearing its 20-day SMA (4050 - green line) which might offer some support as we saw back at the beginning of January but a further drop below 4000 cannot be discarded as the RSI dips below 50. Beyond here we find the 50-day SMA (3965 - black line) followed by the descending trend line at 3929.

S&P 500 daily chart. Photo: capital.com. Source: tradingview
The Nasdaq still has a way to go before reaching its 20-day SMA (12058) but it hasn't been as good as a support in the past few months so it may provide little relief for buyers. The RSI is also holding a little bit steadier so we may see a further pullback towards the 200-day SMA (11898 - yellow line) before stronger support comes in.

FTSE 100 daily chart. Photo: capital.com. Source: tradingview
In Europe, the DAX 40 is also feeling the effects of the selloff but is still holding a better formation than US equities. The move higher has consolidated slightly over the past few days, finding resistance just above 15600 but it continues to trade comfortably above its key support range (15000 - 14813) where I expect to see another halt in the pullback and potentially some sideways consolidation.

The FTSE 100 has been a little less resilient than its German counterpart but is also holding relatively well to the gains seen over the past few months. The 20-day SMA has moved up towards 7817 which is offering some support to buyers but I wouldn’t be surprised if we see a dip below 7800 in the case that bearish pressure intensifies, with further support around 7710.

FAQs
Will S&P 500 go up or down next week?
Focus on the US CPI to provide further guidance on the economy.
Will DAX 40 go up or down next week?
There is likely to be some support at the key range (15000 - 14813).