S&P 500 index forecast: Softer dollar, Q1 earnings
US 500 traded near the top of its recent range in mid-April 2026, as a softer US dollar, early Q1 earnings updates and continued trade policy uncertainty shaped sentiment. Explore third-party US500 targets and technical analysis. Past performance is not a reliable indicator of future results.
The S&P 500 index – referred to as the US 500 (US500) on CFD trading platforms such as Capital.com – was trading at 6,897.7 on Capital.com's quote feed as of 9:21am UTC on 14 April 2026, within a tight intraday range of 6,736.60–6,898.30. Past performance is not a reliable indicator of future results.
Sentiment has been supported by a softer US dollar, with the DXY at approximately 98.37 on 14 April 2026, its lowest level in recent weeks, as the currency index continued to ease amid uncertainty over US trade policy (Bernama, 14 April 2026). Q1 2026 earnings season is underway, with major financials and technology names including JPMorgan Chase, Goldman Sachs, and Taiwan Semiconductor among the most closely watched reporters for the week of 13 April (Reuters, 10 April 2026). Forward consensus estimates for the S&P 500 project full-year 2026 earnings per share at approximately $313.62, with the Information Technology sector leading upward revisions at 4.1% (CaixaBank Research, 14 April 2026).
US 500 forecast 2026–2030: Third-party targets
As of 14 April 2026, third-party US 500 predictions reflect a range of outlooks shaped by tariff uncertainty, Q1 earnings expectations, and the pace of AI-driven productivity gains. The following targets summarise leading third-party projections available as of 14 April 2026.
Goldman Sachs (year-end strategy target)
Goldman Sachs maintains a year-end 2026 target of 7,600 for the S&P 500, projecting a 12% total return underpinned by full-year EPS of $305–$309 and US GDP growth of 2.7%. The firm describes the current phase as a 'marathon' broadening in scope, with gains expected to rotate towards cyclical and value sectors as AI productivity gains spread beyond the technology sector (Yahoo Finance, 17 March 2026).
Reuters (analyst consensus poll)
Reuters reports that S&P 500 earnings are expected to rise more than 19% in 2026, revised upward from an estimated 15% increase in late February 2026, with Q1 2026 earnings season serving as the near-term test for that revised consensus. The wire service notes that geopolitical uncertainty and elevated energy prices remain the key variables that could shift that trajectory (Reuters, 10 April 2026).
TheStreet (multi-bank strategy round-up)
TheStreet reports that Barclays lifted its 2026 S&P 500 EPS forecast to $321 from $305 and raised its year-end index target accordingly, while the S&P 500 itself closed Q1 2026 down 329.95 points, or 4.8%, from its 2 January 2026 open of 6,858.5. The round-up notes that the early-April rebound was driven by Iran de-escalation hopes, easing oil prices, and a tech-led recovery, though the index remained below its January highs (TheStreet, 31 March 2026).
CNBC (seasonal pattern and strategist outlook)
CNBC reports that the S&P 500 has historically averaged a gain of 1.4% in April, outperforming both the Nasdaq Composite and Russell 2000 over the same month. Stock Trader's Almanac editor-in-chief Jeffrey Hirsch notes that April is 'rarely a perilous' month, citing the initial month of each quarter as historically the strongest period for the Dow Jones Industrials, S&P 500, and Nasdaq (CNBC, 31 March 2026).
Predictions and third-party forecasts are inherently uncertain, as they cannot fully account for unexpected market developments. Past performance is not a reliable indicator of future results.
US500 index price: Technical overview
The US500 index trades at 6,897.7 as of 9:21am UTC on 14 April 2026, sitting just above a broad moving-average cluster, where the 20-, 50-, 100- and 200-day SMAs are stacked at approximately 6,615, 6,760, 6,806 and 6,667, all currently signalling buy on TradingView's indicator suite. Price holds above every major SMA, and the 20-over-50 alignment is intact within the exponential moving-average family, keeping the near-term structure constructive. The Hull moving average (9) at 6,899.9 reads a sell signal, reflecting the sharp pace of the recent recovery relative to its short lookback.
Momentum is firm: the 14-day RSI sits at 63.46 in upper-neutral territory, while the average directional index (14) reads 29.79, consistent with an established and directional trend rather than a ranging market, according to TradingView data.
To the topside, the classic R1 pivot at 6,847.4 has already been cleared; R2 at 7,166.3 comes into view on a sustained daily close above current levels. On pullbacks, the classic pivot point at 6,582.2 represents the first notable support reference, with the 100-day SMA shelf near 6,806 acting as a closer intervening level. A move back below that MA shelf would raise the risk of a deeper retest towards S1 at 6,263.3 (TradingView, 14 April 2026).
This is technical analysis for informational purposes only and does not constitute financial advice or a recommendation to buy or sell any instrument.
US 500 index history (2024–2026)
The US 500 index opened April 2024 above 5,000, then dipped as low as 4,927.0 on 19 April 2024 during a brief mid-spring sell-off, before recovering steadily through the summer. The index closed 2024 at 5,882.7 and carried that momentum into early 2025, ending 2025 up 16.4% at 6,848.1 on 31 December 2025.
2025's sharpest test came in April, when a tariff-driven sell-off pushed the index down to 4,808.4 on 7 April 2025, the lowest point in the two-year window. A swift recovery followed, and by late January 2026 the index had climbed to a peak of 7,002.9 on 3 February 2026, its highest level in the dataset. From there, a pullback through March 2026 dragged the index to 6,312.1 on 31 March 2026, before another rebound pushed prices back towards the 6,900 area.
US500 last closed at 6,897.7 on 14 April 2026, approximately 0.6% up year to date and 28.0% higher year on year versus 14 April 2025, with the index sitting around 1.5% below its February 2026 peak of 7,002.9.
Past performance is not a reliable indicator of future results. Share prices are indicative and may differ from live market prices.
US 500 (US500): Capital.com analyst view
The US 500's trajectory over the past two years reflects the tension between resilient corporate earnings and persistent macro headwinds. A sharp recovery from the April 2025 lows near 4,808 demonstrated the index's capacity to rebound swiftly amid renewed optimism, and the climb towards 7,002.9 in early February 2026 underlined sustained investor appetite for US equities. However, that same speed of recovery also raises questions about valuation sustainability, particularly if earnings growth fails to keep pace with elevated price levels or if trade policy uncertainty re-escalates.
Looking at the current picture, the index trades near 6,897.7, up roughly 28% year on year, with Q1 2026 earnings season now acting as a near-term test of that premium. Continued AI-driven productivity gains and potential Federal Reserve rate adjustments could provide further support, though tighter financial conditions, geopolitical risk, or a deterioration in consumer spending could equally weigh on sentiment and compress multiples at current levels.
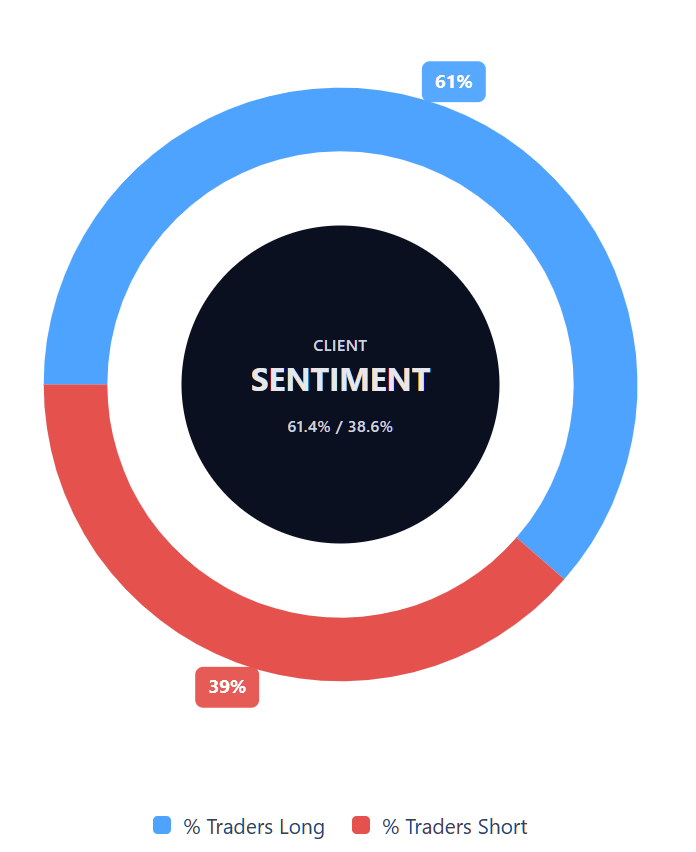
Capital.com’s client sentiment for US 500 CFDs
As of 14 April 2026, Capital.com client positioning in US 500 CFDs shows 61.4% buyers and 38.6% sellers, putting buyers ahead by 22.8 percentage points, which places current sentiment in majority-sell territory but not at an extreme. This snapshot reflects open positions on Capital.com and can change rapidly as market conditions evolve.
Summary – US 500 2026
- US 500 (US500) last traded at 6,897.7 as of 9:21am UTC on 14 April 2026, up 28.0% year on year and 0.6% year to date.
- Key upside drivers include resilient US corporate earnings, AI-driven productivity investment, and a softer US dollar; downside risks include tariff escalation, elevated valuations, and potential Fed policy tightening.
- Q1 2026 earnings season is underway, with major financials and technology names reporting; consensus EPS forecasts for full-year 2026 stand at around $305–$321, depending on the source.
Past performance is not a reliable indicator of future results.
FAQ
What is the 5 year US 500 forecast?
Is US 500 a good CFD to trade?
Could US 500 go up or down?
Should I invest in US 500?
Can I trade US 500 CFDs on Capital.com?
Yes, you can trade US 500 CFDs on Capital.com. Trading index CFDs lets you speculate on price movements without owning the underlying asset and to take long or short positions. However, contracts for difference (CFDs) are traded on margin, and leverage amplifies both profits and losses. You should ensure you understand how CFD trading works, assess your risk tolerance, and recognise that losses can occur quickly.