Silver price forecast: Dollar pressure and deficit
Silver is a precious and industrial metal, with Reuters citing US dollar pressure, policy expectations and a wider expected 2026 market deficit. Explore third-party Silver price targets and technical analysis. Past performance is not a reliable indicator of future results.
Silver (XAG) trades around $58.39, inside the $56.10–$59.35 intraday range as of 8am UTC on 29 June 2026. Past performance is not a reliable indicator of future results.
Reuters reported that silver came under pressure after a broad shakeout in precious metals, while the same week’s backdrop kept the US dollar and policy expectations in focus (Reuters, 25 June 2026). Reuters also said the global silver market is still expected to remain in deficit in 2026, with the gap widening from 40.3 million ounces in 2025 to 46.3 million ounces in 2026. Earlier Reuters coverage pointed to liquidity and physical-market tightness as continuing themes in silver trading, particularly in the context of stock drawdowns and squeeze risks (Reuters, 15 April 2026).
Silver outlook: dollar pressure meets deficit expectations
As of 29 June 2026, third-party Silver predictions point to a range of differing views.
Yahoo Finance (expert consensus)
Yahoo Finance reported that experts expect silver to surpass $80 per ounce by the end of 2026, with some longer-range views extending to $100 by 2030. The piece frames that level as part of a broader expert consensus after a volatile first half, with demand and macro conditions still shaping the outlook (Yahoo Finance, 9 June 2026).
GoldSilver (institutional range)
GoldSilver reported that most major institutional forecasters centre on a 2026 full-year average of $79–$81 per ounce. It links that range to forecasts from large banks and survey-based estimates, with the rationale tied to industrial demand, supply deficits, and the macro backdrop (GoldSilver, 15 June 2026).
Reuters (technical reference points)
Reuters noted that a sustained move higher in silver would bring the 6 February high of $72.74 into view, followed by $75.25. The report presents those figures as technical reference levels after a prolonged correction, with relative weakness versus gold shaping the near-term setup (Reuters, 25 June 2026).
Predictions and third-party forecasts are inherently uncertain, as they cannot fully account for unexpected market developments. Past performance is not a reliable indicator of future results.
Silver: latest macro news
Silver’s latest macro backdrop remains tied to US rates, the dollar, and inflation data, with Reuters and other outlets highlighting how changing rate expectations and currency moves have fed into precious-metals volatility in mid-2026 (Reuters, 12 June 2026). Reuters reported on 25 June that silver’s correction had left the market watching technical levels closely after a sharp pullback in precious metals, noting that the metal had lost roughly half its value since peaking at an all-time high in January (Reuters, 25 June 2026).
As of 25 June, CNBC and Trading Economics said US PCE inflation rose 4.1% in the 12 months through May, while Reuters reported that rate futures markets were pricing in a significantly higher probability of a December Fed hike, reinforcing pressure on non-yielding metals (CNBC, 25 June 2026; Trading Economics, 25 June 2026; Reuters, 5 June 2026).
Silver price: technical overview
Silver is around $58.39 on the latest Capital.com feed as of 8am UTC on 29 June 2026, trading below the main simple moving average cluster that TradingView places near the 20/50/100/200-day SMAs at approximately 66.47, 72.94, 75.95, and 68.69, respectively. The shorter SMAs are currently above the last price. TradingView’s Hull moving average (9) is closer to the platform price at about 56.07, while the Ichimoku base line sits higher near 67. Together, these readings suggest recent spot action has slipped below several medium-term trend markers.
The 14-day RSI on TradingView is around 31.44, in a lower-neutral to mildly oversold region, while the ADX (14) stands near 38.19. This points to an established trend backdrop rather than a flat or directionless tape.
On TradingView’s classic pivots, the first upside reference above the last price is the pivot (P) near 78.82, with R1 around 85.84 and R2 near 96.39 further up the ladder. That frames a wide gap between current spot levels and the next major resistance figures. On the downside, the 20-day SMA near 66.47 and the 100-day SMA close to 75.95 define the main moving-average shelf in the current configuration. S1 sits closer to 68.27, with S2 around 61.25 and S3 near 43.68 as deeper references if the broader correction extends (TradingView, 29 June 2026).
This technical analysis is for informational purposes only and does not constitute financial advice or a recommendation to buy or sell any instrument.
Silver price history (2024–2026)
The Silver spot price spent most of 2024 grinding higher from the high-$20s, with the close near $29.12 on 31 December 2024 marking the end of a steady climb from around $28.89 at the start of that year. Through mid-2025, prices shifted up another gear, moving from roughly $33 in early April to the mid-$30s by June and finishing June 2025 at about $35.78. This reflected a move from consolidation into a stronger precious metals phase as broader safe-haven demand built.
Momentum accelerated into late 2025 and early 2026. XAG moved from the low-$40s in September 2025 to above $70 by December, closing near $79.31 on 26 December 2025 as Reuters reported silver topping $75 for the first time amid expectations of US rate cuts and geopolitical tensions. The rally extended into January, with XAG closing at $117.83 on 28 January 2026 during a speculative surge that Reuters said pushed silver to fresh records before a sharp correction unfolded in late January and early February.
Since then, silver has retraced heavily, with the close slipping from $95.82 on 1 March 2026 to $58.41 on 29 June 2026. Reuters described the move as part of a broader shakeout that left silver down by roughly half from its peak amid tighter financial conditions and reassessed rate-cut hopes.
Past performance is not a reliable indicator of future results. Prices are indicative and may differ from live market prices.
Silver price outlook: Capital.com analysis
Silver spot’s 2026 price action has been marked by unusually large swings, from a January surge to a much lower level by late June. The earlier rally coincided with softer US dollar conditions and expectations for Federal Reserve rate cuts. Reuters later reported that silver lost roughly half its value from the January peak during a broader precious-metals shakeout.
At the same time, the market still appears supported by longer-running supply tightness, with Reuters and the Silver Institute noting that a sixth straight annual structural deficit is expected in 2026.
That mix leaves silver exposed to cross-currents rather than a single clear trend. A firmer US dollar and higher-for-longer rate expectations can weigh on non-yielding metals, and Reuters reported that the dollar entered the second half of 2026 on stronger footing as markets priced higher US rates. Equally, any easing in rate expectations or renewed haven demand could offer support.
Supply deficits and recovering retail investment may help underpin sentiment. However, Reuters also noted that industrial demand is projected to soften in 2026, which presents the other side of the argument for a metal with both precious and industrial uses.
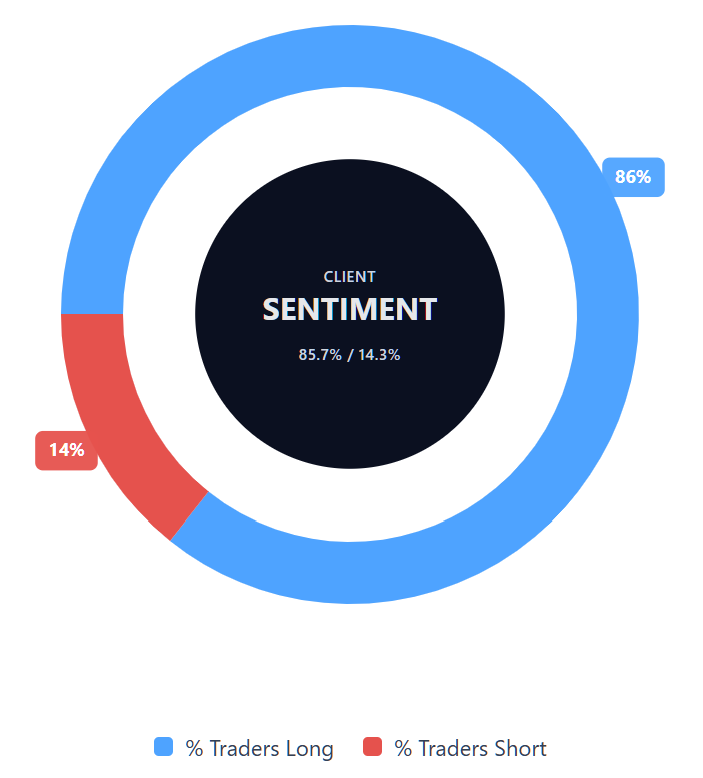
Capital.com’s client sentiment for Silver CFDs
As of 29 June 2026, Capital.com client positioning in Silver spot CFDs is 85.7% buyers versus 14.3% sellers. That keeps the market in heavy-buy territory, with buyers ahead by 71.4 percentage points. This snapshot reflects open positions on Capital.com and can change.
Summary – Silver price 2026
- Silver spot is around $58.41 on 29 June 2026, down sharply from January’s spike above $100 but still well above mid-2024 levels.
- TradingView’s technicals show price below the main moving-average cluster, with a low-30s RSI and elevated ADX, pointing to a strong but corrective trend backdrop.
- Key drivers include structural market deficits flagged by the Silver Institute, softer industrial demand, and shifting expectations around US interest rates and the dollar.
- Recent news focuses on silver’s losing streak since the January peak, heavy volatility across precious metals, and repricing as markets reassess rate-cut hopes and macro risks.
Past performance is not a reliable indicator of future results.
FAQ
What is the Silver price forecast?
Public silver forecasts published between 8 June and 29 June 2026 remain limited, with most available sources either recapping earlier bank views or setting out scenario-based levels. The article’s cited forecasts broadly cluster around the high-$70s to low-$80s for 2026 annual-average expectations, while Reuters’ nearer-term technical reference levels sit lower, around $72.74–$75.25. These forecasts are not guarantees, and market conditions can change quickly.
Could Silver’s price go up or down?
Yes. Silver’s price could move in either direction because it responds to several competing drivers. Supply deficits and renewed safe-haven demand may offer support, while a stronger US dollar, higher-for-longer interest rate expectations, and softer industrial demand could weigh on prices. Recent volatility also shows how quickly sentiment can shift. Traders should remember that past performance is not a reliable indicator of future results.
Should I invest in Silver?
Whether silver is suitable depends on your financial situation, risk tolerance, market knowledge, and investment goals. This article is for informational purposes only and does not constitute financial advice or a recommendation to buy, sell, or hold silver. Silver can be volatile, especially when macro expectations change quickly. Before making any decision, consider the risks, do your own research, and seek independent professional advice if needed.
Can I trade Silver CFDs on Capital.com?
Yes, you can trade Silver CFDs on Capital.com. Trading commodity CFDs lets you speculate on price movements without owning the underlying asset and to take long or short positions. However, contracts for difference (CFDs) are traded on margin, and leverage amplifies both profits and losses. You should ensure you understand how CFD trading works, assess your risk tolerance, and recognise that losses can occur quickly.