Crude oil price forecast: US-Iran ceasefire and OPEC+ supply
US Crude Oil and Brent Crude Oil remain sensitive to supply developments after the US–Iran ceasefire framework and latest OPEC+ output hike. Explore third-party crude oil price targets and technical analysis. Past performance is not a reliable indicator of future results.
- US Crude Oil (US Crude) is trading at $70 per barrel in early European trading as of 9:02am UTC on 29 June 2026, within an intraday range of $68.47–$71.50.
- Brent Crude Oil (Brent Crude) is quoted at $73.17 per barrel as of 9:02am UTC on 29 June 2026, within an intraday range of $71.74–$75.27, maintaining its customary premium over WTI.
- Past performance is not a reliable indicator of future results.
Prices remain under pressure as supply-side conditions shift. The US and Iran signed a ceasefire framework in mid-June that includes a 60-day truce and the agreed reopening of the Strait of Hormuz, a critical chokepoint whose disruption had pushed Brent above $120 per barrel earlier in the conflict (BBC News, 14 June 2026). Sky News reported on 29 June 2026 that Iran and the US had agreed to pause attacks and renew talks on the strait (Sky News, 29 June 2026).
The supply outlook has also been shaped by OPEC+ policy. The group approved its fourth consecutive output quota hike since the Hormuz closure, adding approximately 188,000 barrels per day for July and bringing cumulative quota increases since April to nearly 600,000 bpd (CNBC, 8 June 2026). OPEC+ had previously lowered its 2026 global demand growth forecast to 970,000 bpd (Reuters, 11 June 2026).
Market participants continue to monitor whether major shipping lines resume Strait of Hormuz transits and whether the broader ceasefire framework holds. Elevated marine insurance rates still point to uncertainty around how quickly supply conditions normalise (Reuters, 24 June 2026).
Third-party crude oil outlook: US–Iran ceasefire shapes view
As of 29 June 2026, third-party crude oil predictions have been revised sharply lower through June 2026. The US–Iran ceasefire agreement signed on 17 June 2026, alongside the deal to reopen the Strait of Hormuz, reduced the supply-risk premium that had pushed Brent above $100 per barrel earlier in the year (Reuters, 16 June 2026).
EIA (June 2026 STEO – Brent quarterly path)
The US Energy Information Administration, in its Short-Term Energy Outlook, forecast Brent crude to average around $105 per barrel in June and July 2026, before falling below $80 per barrel in Q3 2026 and to approximately $70 per barrel by the end of the year. The agency cited a projected decrease in global oil demand of 1.1 million barrels per day across 2026, alongside an assumption that Hormuz flows would resume incrementally from Q3, as the main factors behind the expected price decline through H2 2026 (EIA, 9 June 2026).
Goldman Sachs (Q4 2026 revision – WTI and Brent)
Goldman Sachs cut its Q4 2026 Brent forecast to $80 per barrel from $90, and its Q4 2026 WTI forecast to $75 per barrel. The bank also noted a downside scenario in which Brent could fall to around $70 per barrel in late 2026 if supply recovery arrives ahead of its revised base case, and flagged limited inventory buffer capacity as the main upside cushion (Investing.com, 3 June 2026).
Morgan Stanley (Q3/Q4 2026 revision – Brent)
Morgan Stanley revised its Brent crude forecast, cutting its Q3 2026 estimate to $90 per barrel and its Q4 2026 estimate to $80 per barrel. The revision followed the US–Iran breakthrough, which prompted a reassessment of supply restoration timelines. The bank cited the expected reopening of the Strait of Hormuz within 30 days of the ceasefire signing as the key variable compressing the risk premium that had supported prices above $100 per barrel through May 2026 (OilPrice.com, 16 June 2026).
Citi (Q3/Q4 2026 revision – Brent)
Citi cut its Brent crude forecast to $75 per barrel for Q3 2026 and $70 per barrel for Q4 2026, the lowest revision among the major banks cited at the time of publication. The bank also lowered its 2027 Brent average to $65 per barrel from a prior $80, citing expectations for a faster-than-consensus pace of Persian Gulf supply normalisation and softer global demand as compounding downside factors (TheStreet, 16 June 2026).
Reuters (WTI and Brent annual averages)
The Reuters survey of 33 economists and analysts placed the 2026 annual average Brent consensus at $90.44 per barrel, up from $86.38 in the April poll, with WTI projected to average $84.63 per barrel for the full year. Respondents cited a slow recovery in energy flows through the Strait of Hormuz and persistent supply-chain friction as factors sustaining the elevated annual average; however, the survey was conducted before the mid-June ceasefire deal changed the near-term supply outlook (Reuters, 29 May 2026).
Goldman Sachs (2027 Brent revision – longer-dated WTI path)
Goldman Sachs, in a separate note reported by Reuters, lowered its 2027 average Brent forecast to $75 per barrel from $80. The bank also noted that faster-than-expected supply normalisation, combined with weaker demand, could push Brent toward $70 in late 2026 and to around $60 in 2027, flagging supply growth from returning Persian Gulf barrels alongside OPEC+ quota hikes totalling approximately 600,000 barrels per day since April as structural headwinds for the medium-term price path (Reuters, 12 June 2026).
Predictions and third-party forecasts are inherently uncertain, as they cannot fully account for unexpected market developments. Past performance is not a reliable indicator of future results.
Crude oil prices: technical overview
Technical indicators for WTI and Brent point to continued sell pressure, although oversold RSI readings suggest the pace of recent declines may remain important to watch.
The Hull moving average (9) at $68.92 is the only bullish reading among the moving averages, suggesting very near-term momentum may be attempting to stabilise near current levels. The 14-day RSI at 27.81 sits in oversold territory, consistent with a sustained sell-off. The ADX at 26.06 indicates an established trend rather than a directionless drift, meaning the prevailing downward move retains structural momentum despite the oversold oscillator reading.
On a recovery, the classic pivot at $93.72 is the first meaningful overhead reference. A daily close toward that area would put R1 at $101.10 in view. To the downside, S1 at $79.99 has already been breached, with S2 at $72.61 acting as the next nearby reference. Below that, the S3 zone near $51.50 is the next classical support level on a further deterioration (TradingView, 29 June 2026).
As with WTI, the Hull moving average (9) at $72.24 provides the only near-term constructive reading. Its proximity to the current price suggests very short-term momentum may be attempting to find a floor. The 14-day RSI at 29.06 sits in oversold territory, while the ADX at 34.25 reflects a firmly established downtrend. This is the stronger trend-strength reading of the two benchmarks, indicating that the prevailing move has notable directional momentum.
On a recovery, the classic pivot at $98.78 is the first meaningful overhead reference. A sustained daily close toward that level would put R1 at $107.64 in view. To the downside, S1 at $82.27 has already been broken, leaving S2 at $73.41 as the next reference just below the current spot. A loss of that level would expose S3 near $48.04 as the next classical support on the chart. The 200-day SMA at $78.34 sits above spot and now acts as resistance rather than support, reinforcing the bearish structure (TradingView, 29 June 2026).
This technical analysis is for informational purposes only and does not constitute financial advice or a recommendation to buy or sell any instrument.
Crude oil price history (2024–2026)
WTI and Brent have both seen significant swings over the past two years. Prices first moved lower during a prolonged supply-led retreat, before a major geopolitical disruption and its subsequent unwinding reshaped the market in 2026.
US Crude Oil (WTI)
The US Crude price closed June 2024 at $81.43 per barrel before entering a sustained decline through the second half of 2024, ending the year at $71.69 on 31 December 2024. That downward drift extended into 2025, a period marked by ample global supply and softer demand expectations. By 31 December 2025, WTI had fallen to $57.35, a loss of roughly 20% over the calendar year.
The picture changed abruptly in early 2026. US strikes on Iran triggered an intraday spike to $115.78 on 9 March 2026, before prices pulled back sharply and later retested the $103–$104 area in late April as the conflict continued.
The US–Iran ceasefire deal signed in mid-June then began unwinding the war premium. WTI fell from $90.73 on 1 June 2026 to $70.02 on 29 June 2026, leaving it approximately 22.1% above its December 2025 close and 8.7% above its level on the same date a year earlier.
Past performance is not a reliable indicator of future results. Prices are indicative and may differ from live market prices.
Brent Crude Oil
The Brent Crude price closed June 2024 at $85.10 per barrel and followed a similar path lower through the remainder of 2024, settling at $74.82 on 31 December 2024. Persistent oversupply concerns weighed further through 2025, with Brent finishing the year at $60.92 on 31 December, down approximately 19% over the calendar year.
As with WTI, the Iran conflict changed the price landscape in 2026. Brent spiked intraday to $116.29 on 9 March 2026, the highest level in the two-year window, before retreating and consolidating around $110.39 by 30 April as Hormuz closure disruptions kept a significant risk premium in place.
The June ceasefire unwound those gains quickly. Brent closed at $95.05 on 1 June 2026 and has since fallen to $73.21 on 29 June 2026, leaving it approximately 20.2% above its December 2025 close despite the sharp retreat from the war-period highs.
Past performance is not a reliable indicator of future results. Prices are indicative and may differ from live market prices.
US Crude vs Brent Crude: Capital.com analyst outlook
Crude oil prices have experienced one of their most volatile periods in recent years. Both WTI and Brent moved above $100 per barrel during the height of the Iran conflict before giving back those gains as ceasefire developments emerged.
The mid-June 2026 US–Iran framework and the agreed reopening of the Strait of Hormuz removed a substantial geopolitical risk premium that had supported prices for months. At the same time, a series of OPEC+ output quota increases, totalling approximately 600,000 barrels per day since April, added further supply-side pressure. That said, the pace of Hormuz traffic normalisation remains uncertain, and renewed geopolitical friction or slower-than-expected export recovery could limit or reverse the current downward move.
Looking at the broader picture, WTI trades near $70 and Brent near $73.17 as of 29 June 2026, 9:02am UTC. Both benchmarks sit well below their 2026 war-period highs but remain above their December 2025 lows. Softer global demand forecasts, including the IEA’s projection of a 1.1 million barrels per day contraction in 2026, continue to weigh on the medium-term outlook. However, tighter-than-expected inventory draws or a slower supply recovery could also support prices from current levels.
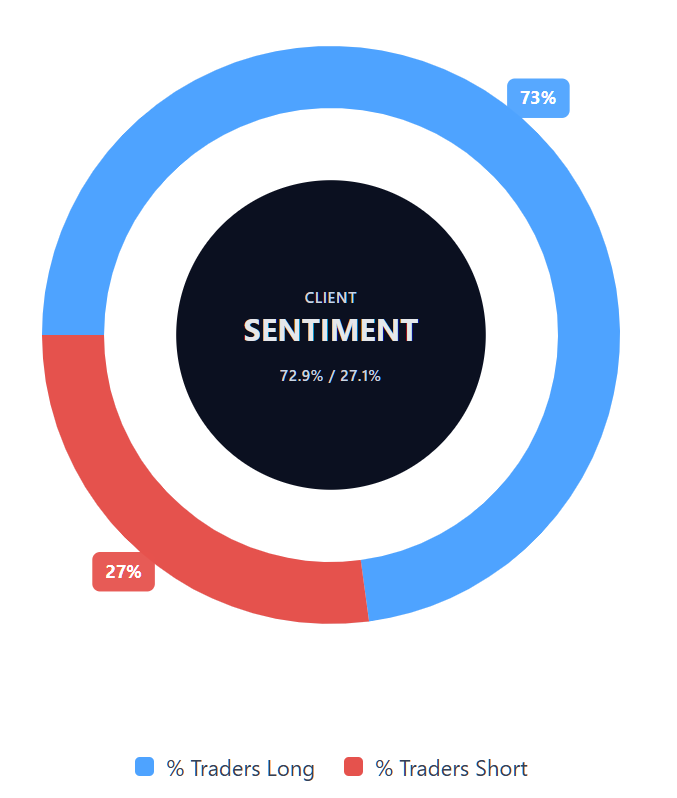
Capital.com’s client sentiment for US Crude CFDs
As of 29 June 2026, Capital.com client positioning in US Crude CFDs shows 72.9% buyers versus 27.1% sellers. This puts buyers ahead by 45.8 percentage points and places sentiment in heavy-buy, one-sided-toward-longs territory. This snapshot reflects open positions on Capital.com and can change quickly as market conditions evolve
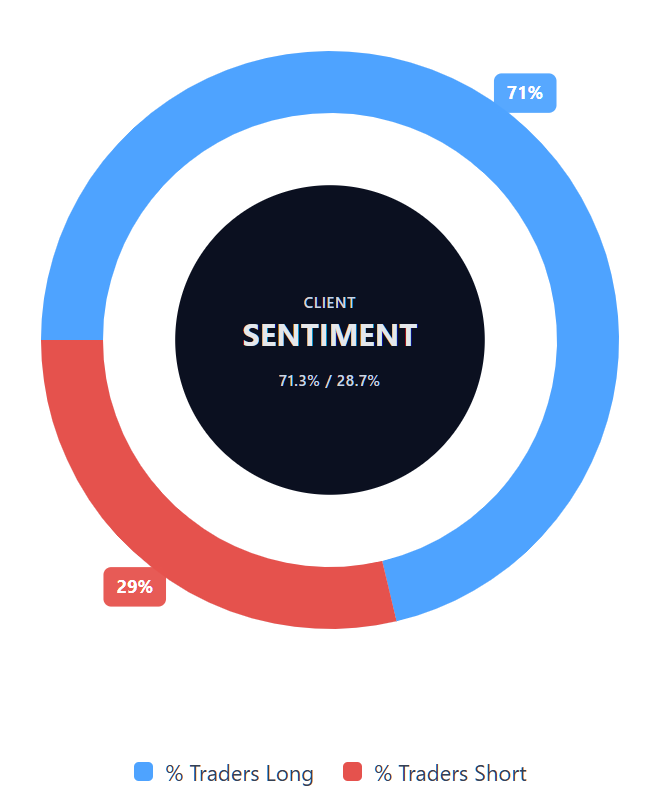
Capital.com’s client sentiment for Brent Crude CFDs
As of 29 June 2026, Capital.com client positioning in Brent Crude CFDs shows 71.3% buyers versus 28.7% sellers. This puts buyers ahead by 42.6 percentage points and also indicates heavy-buy, one-sided-toward-longs territory. As with US Crude Oil, this snapshot reflects open positions on Capital.com and can change quickly as market conditions evolve.
Summary – US Crude and Brent Crude (2026)
- As of 9:02am UTC on 29 June 2026, WTI trades at $70 per barrel and Brent at $73.17, with both benchmarks near multi-month lows after giving back their 2026 war-period highs above $100.
- The primary driver of recent declines is the mid-June 2026 US–Iran ceasefire framework, which agreed to reopen the Strait of Hormuz and reduced the geopolitical risk premium in oil prices.
- OPEC+ has approved its fourth consecutive output quota hike since April, adding approximately 600,000 barrels per day cumulatively. This has added to supply-side pressure alongside a downward revision to 2026 global demand growth.
CFDs are complex instruments and come with a high risk of losing money rapidly due to leverage. XX% of retail investor accounts lose money when trading CFDs with this provider. You should consider whether you understand how CFDs work and whether you can afford to take the high risk of losing your money
FAQ
What is the crude oil price forecast?
Third-party crude oil forecasts cited in the article point to a lower price path through late 2026, although projections vary by source. For WTI, forecasts range from around $75 per barrel in Goldman Sachs’ Q4 estimate to the low $70s in the EIA’s year-end path. For Brent, Q4 forecasts range from $70 to $80 per barrel. Analysts generally cite faster supply normalisation through the Strait of Hormuz as a key downside factor.
Could crude oil’s price go up or down?
Crude oil prices could move in either direction, depending on how supply, demand and geopolitical risks develop. Prices may face further pressure if Hormuz traffic normalises quickly, OPEC+ output increases continue, or demand forecasts soften. However, renewed geopolitical tension, slower-than-expected export recovery or tighter inventory conditions could support prices. Technical indicators in the article currently point to sell pressure, but oversold RSI readings suggest short-term rebounds can’t be ruled out.
Should I invest in crude oil?
Whether crude oil is suitable for you depends on your goals, risk tolerance and market knowledge. The article highlights significant recent volatility, with WTI and Brent both moving above $100 per barrel during the Iran conflict before falling sharply after ceasefire developments. CFDs are leveraged products, which means both profits and losses can be magnified. You should carry out your own research and consider whether you understand the risks before trading crude oil.
Can I trade crude oil CFDs on Capital.com?
Yes, you can trade US Crude CFDs and Brent Crude CFDs on Capital.com. Trading commodity CFDs lets you speculate on price movements without owning the underlying asset and to take long or short positions. However, contracts for difference (CFDs) are traded on margin, and leverage amplifies both profits and losses. You should ensure you understand how CFD trading works, assess your risk tolerance, and recognise that losses can occur quickly.