Gold (XAU/USD) price forecast: PCE data, Fed rate bets
Gold traded near $4,062.47 on 29 June 2026, after Fed rate-hike expectations lifted the US dollar and renewed tariff risks supported some demand. Explore third-party Gold price targets and technical analysis. Past performance is not a reliable indicator of future results.
Gold (XAU/USD) is trading at $4,062.47 as of 8:08am UTC on 29 June 2026, within an intraday range of $3,990.29–$4,090.14. Past performance is not a reliable indicator of future results.
The partial recovery follows four consecutive weeks of declines as markets repriced Federal Reserve policy. Fed Chair Kevin Warsh's remarks last week reinforced the central bank's commitment to reducing inflation, lifting the market-implied probability of a December rate hike to around 79–88% on the CME FedWatch Tool (CNBC, 26 June 2026). The move also pushed the US dollar to a one-year high, adding pressure to non-yielding assets priced in the currency (Reuters, 23 June 2026).
Renewed trade uncertainty remains in focus after President Trump threatened, on 27 June 2026, to impose 100% tariffs on countries that enact digital services taxes on US technology firms (Al Jazeera, 26 June 2026). That has added a modest safe-haven bid to gold, although the wider backdrop remains shaped by rates and the dollar. Saxo Bank's head of commodity strategy noted that 'the interplay of elevated bond yields, a stronger dollar, and the anticipation that policy rates may stay high for an extended period continues to dampen investor interest in non-yielding assets' (Reuters, 24 June 2026).
Gold outlook shifts as Fed rate bets keep pressure on prices
As of 29 June 2026, third-party gold predictions have been revised lower since early June, as expectations for Federal Reserve rate cuts faded and the US dollar firmed to a one-year high.
Citi Research (three-month and six-to-12-month targets)
Citi cut its three-month gold price target to $4,000/oz from $4,300/oz, citing stabilising real yields, a stronger near-term US dollar, moderating central bank and ETF demand, and easing geopolitical tensions. The bank left its six-to-12-month target unchanged at $4,500/oz, noting that near-term upside remains capped without a fresh macro shock (Kitco News, 9 June 2026).
Deutsche Bank (Q3 and Q4 2026 quarterly averages)
Deutsche Bank trimmed its Q3 2026 gold price target to $4,300/oz, a cut of more than 22% from its previous outlook. It also lowered its Q4 2026 target to $4,800/oz, a 17% reduction from the prior estimate. The bank cited weaker investor demand and a repriced Fed trajectory, while maintaining that a partial recovery in the second half remains plausible if central bank buying continues (Kitco News, 23 June 2026).
ING Think (Q3 and Q4 2026 quarterly averages)
ING reset its gold forecasts, lowering the Q3 2026 average to $4,300/oz and the Q4 2026 average to $4,600/oz, down from previous estimates of $4,850/oz and $5,000/oz respectively. The bank said the ongoing correction was becoming harder to ignore, with ETF demand weak and safe-haven flows thinning as geopolitical risk premiums eased (FXStreet, 24 June 2026).
Goldman Sachs (year-end 2026 target)
Goldman Sachs cut its year-end 2026 gold price target by $500/oz to $4,900/oz, after previously raising it to $5,400/oz in January. Analysts Lina Thomas and Daan Struyven said the revision reflected the Federal Reserve no longer being expected to cut rates in 2026, with Fed easing now deferred to mid-to-late 2027. The bank kept its longer-term structural bull case intact (Bloomberg, 19 June 2026).
J.P. Morgan (full-year 2026 average and Q4 2026 directional target)
J.P. Morgan lowered its full-year 2026 average gold price forecast to $5,243/oz from $5,708/oz, citing softer near-term investor demand, which the bank described as having dried to a trickle. It maintained a directional Q4 2026 target of $6,000/oz, based on the view that central bank demand and structural tailwinds could reassert later in the year (J.P. Morgan Global Research, 9 June 2026).
Predictions and third-party forecasts are inherently uncertain, as they cannot fully account for unexpected market developments. Past performance is not a reliable indicator of future results.
Gold spot: key macro data and upcoming events
The first consumer-sentiment snapshot since the 17 June FOMC meeting arrives on 30 June, when the Conference Board Consumer Confidence Index for June is due; nine of 18 Fed members at that meeting projected at least one rate hike in 2026 (Reuters, 18 June 2026).
The most recent hard data was the Bureau of Economic Analysis May PCE report, released 25 June 2026. Headline PCE came in at 4.1% year on year, the highest since April 2023, while core PCE edged up to 3.4%, in line with consensus; energy was the primary driver (CNBC, 25 June 2026). Despite the firm print, gold recovered from roughly $3,980 to above $4,000 as the figures offered no fresh catalyst beyond what markets had already priced (FXStreet, 25 June 2026).
The next key releases are JOLTS job openings (30 June) and the June non-farm payrolls report (3 July, brought forward ahead of the 4 July federal holiday), both of which may influence expectations for a September or November Fed move (Reuters, 18 June 2026).
Gold price: technical overview
Gold spot prices traded at $4,062.47 as of 8:08am UTC on 29 June 2026, below the daily moving average stack. The 20-, 50-, 100- and 200-day simple moving averages sit at approximately $4,228, $4,454, $4,674 and $4,476, respectively. Price is trading beneath the full SMA structure, reflecting the broader corrective move that has developed through June 2026. The Hull moving average (9) at $4,011.62 sits just below the intraday range low of $3,990.29 and may act as a near-term reference point.
The 14-day relative strength index reads 36.31, placing it in the lower-neutral zone but not at oversold extremes. The average directional index at 41.65 points to an established trending environment rather than a ranging one. The stochastic RSI fast (3, 3, 14, 14) at 57.04 has turned up from recent lows, although the broader oscillator picture remains negatively skewed, with the MACD level at -118.41 and bull bear power at -190.36.
On the topside, the classic pivot R1 at $4,346.65 is the first meaningful resistance reference. A daily close above that level would bring the R2 zone near $4,967.46 into broader view. To the downside, the area around the Hull moving average near $4,011.62–$3,990.29 is the first near-term reference. A sustained move below that zone would bring the S3 level near $3,745.42 into focus. The classic pivot point at $4,560.11 now sits overhead and may be viewed as a former support area turned resistance, subject to price action (TradingView, 29 June 2026).
This technical analysis is for informational purposes only and does not constitute financial advice or a recommendation to buy or sell any instrument.
Gold price history (2024–2026)
The gold spot price opened 2025 near $2,625/oz and moved steadily higher through the first half of the year. It traded in a relatively tight range of $2,750–$3,090 through February and March, as central bank buying and safe-haven demand supported prices. The rally steepened into spring, with spot crossing $3,000/oz in March 2025 for the first time, partly coinciding with renewed tariff uncertainty under President Trump’s second term and dollar weakness.
By late June 2025, gold had pulled back from those highs to close at $3,264.02 on 29 June 2025. It then resumed its ascent through the second half of the year, closing 2025 at $4,319.14 on 31 December.
The pace of gains accelerated in early 2026. Gold reached an all-time intraday high of $5,598.39 on 29 January 2026, driven by a combination of geopolitical tensions, dollar weakness and strong ETF inflows. It then reversed sharply, falling back towards $4,686 by 30 January.
A second rally attempt took spot back above $5,000/oz through early-to-mid March 2026, but sellers returned from mid-March onward. The move coincided with a repricing of Federal Reserve policy, as rate-cut expectations gave way to rate-hike bets. That shift, alongside a firmer dollar and easing geopolitical risk premiums, pushed gold lower through May and June. Spot reached an intraday low of $3,959.33 on 24 June 2026, its weakest level since November 2025.
Gold spot (XAU) closed at $4,062.84 on 29 June 2026, about 6.1% lower year to date from the 1 January 2026 open near $4,327, but 24.5% higher year on year.
Past performance is not a reliable indicator of future results. Prices are indicative and may differ from live market prices.
Gold price outlook: Capital.com analysis
Gold spot’s 2026 price action has unfolded in two phases. The metal opened the year near $4,327/oz and climbed to an all-time intraday high of $5,598.39 on 29 January, supported by a weaker US dollar, central bank accumulation, geopolitical risk premiums and strong ETF inflows. Global gold ETFs recorded $6.6bn of net inflows in Q1 2026 alone.
Since then, a sharp repricing of Federal Reserve policy has changed the backdrop. Expectations shifted from rate cuts to potential hikes, strengthening the dollar and pressuring non-yielding assets. That pulled spot back to around $4,063 as of 29 June 2026, leaving prices roughly 27% below the January peak. (Investopedia)
The structural case for gold remains contested. Central bank demand, de-dollarisation trends and inflation above 4% year on year provide a credible floor argument. Goldman Sachs also notes a bull case above $6,000/oz if macro-policy hedging demand returns. Against that, the bear case is clear: if the Fed raises rates, a firmer dollar and rising real yields could extend the current correction. High prices may also continue to weigh on jewellery demand, which has historically represented around 40% of global gold consumption.
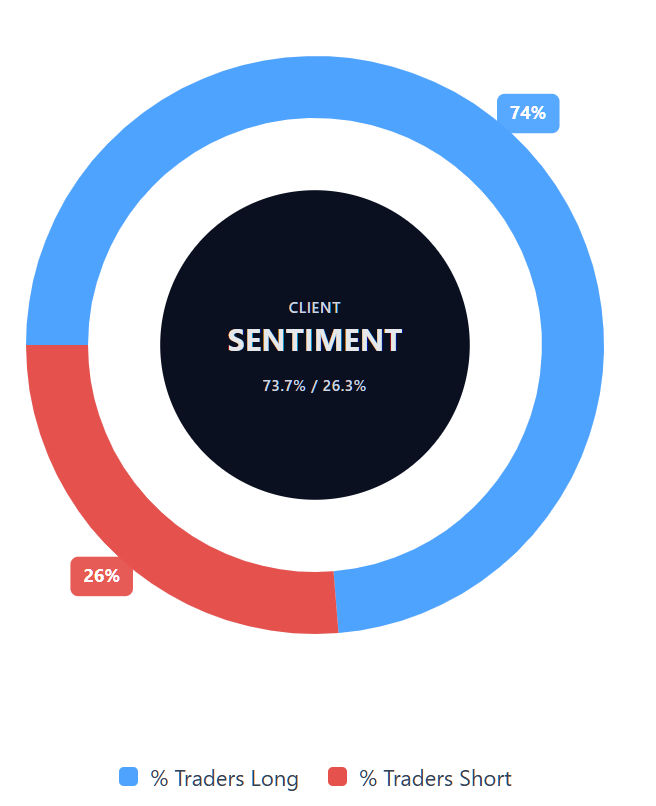
Capital.com’s client sentiment for Gold CFDs
As of 29 June 2026, Capital.com client positioning in Gold spot CFDs sits at 73.7% buyers versus 26.3% sellers, putting buyers ahead by 47.4 percentage points. This indicates a strong long-side skew among open positions on Capital.com at the time of writing, but sentiment can change.
Summary – Gold price 2026
- Gold spot (XAU) trades at $4,062.47 as of 8:08am UTC on 29 June 2026, around 27% below January’s all-time intraday high of $5,598.39.
- The main headwind is a repriced Federal Reserve outlook, with markets pricing around 88% odds of a December 2026 rate hike. This has lifted the US dollar and weighed on non-yielding assets.
- May PCE inflation came in at 4.1% year on year on 25 June 2026, the highest reading since April 2023, reinforcing expectations that US interest rates could stay higher for longer.
- President Trump’s threat of 100% tariffs on digital services tax nations, made on 27 June 2026, added a modest safe-haven bid. So far, that effect has been limited against the broader pressure from rates and the dollar.
Past performance is not a reliable indicator of future results.
FAQ
What is the gold price forecast?
Analyst gold price forecasts for 2026 have been revised lower since early June, as expectations for Federal Reserve rate cuts faded and the US dollar strengthened. Institutional targets cited in the article cluster around $4,300–$4,800/oz for Q3 2026 averages, while year-end views range from $4,900/oz to $6,000/oz. These forecasts vary because they depend on factors such as Fed policy, inflation, central bank demand and safe-haven flows.
Could gold’s price go up or down?
Gold’s price could move in either direction, depending on the balance between macroeconomic headwinds and supportive factors. A firmer US dollar, higher real yields or further Fed rate-hike expectations could weigh on gold, as it is a non-yielding asset. However, renewed geopolitical uncertainty, persistent inflation, central bank buying or stronger ETF inflows could provide support. Traders should also consider that gold can react quickly to economic data and shifts in market sentiment.
Should I invest in gold?
Whether gold is suitable depends on your financial goals, risk tolerance and understanding of the market. Gold is often viewed as a hedge against inflation, currency weakness or geopolitical uncertainty, but its price can still fall sharply, especially when the US dollar strengthens or real yields rise. This article is for informational purposes only and should not be taken as financial advice. Consider your own circumstances and seek independent advice if needed.
Can I trade gold CFDs on Capital.com?
Yes, you can trade Gold CFDs on Capital.com. Trading commodity CFDs lets you speculate on price movements without owning the underlying asset and to take long or short positions. However, contracts for difference (CFDs) are traded on margin, and leverage amplifies both profits and losses. You should ensure you understand how CFD trading works, assess your risk tolerance, and recognise that losses can occur quickly.