Gold (XAU/USD) price forecast: Fed split, fiscal concerns
Gold traded near $4,209.59 on 22 June 2026 after the Fed held rates and US-Iran diplomacy moderated some safe-haven demand. Explore third-party Gold price targets and technical analysis. Past performance is not a reliable indicator of future results.
Gold (XAU/USD) traded at $4,209.59 in early European trading as of 9:53am UTC on 22 June 2026, within an intraday range of $4,127.18–$4,212.37. Past performance is not a reliable indicator of future results.
Prices found tentative support after the Federal Reserve held the federal funds rate steady at 3.50%–3.75% at its 18 June meeting under new Chair Kevin Warsh (CNBC, 17 June 2026). Nine of 18 FOMC officials signalled at least one rate increase this year, with the other nine projecting rates unchanged or lower, a split that initially weighed on gold before prices partly stabilised (Yahoo Finance, 17 June 2026).
The broader backdrop remains mixed. An Iran–US peace deal announced on 15 June lifted gold more than 3% before the subsequent Fed meeting tempered gains, illustrating how geopolitical developments and monetary policy signals can pull prices in opposite directions (Reuters, 15 June 2026). Central bank buying and US fiscal concerns continue to offer structural support, while the June dot plot's implied median year-end rate of approximately 3.8% – up from 3.4% in March – represents a meaningful shift in the policy outlook (Kalkine, 18 June 2026). Trading Economics reported gold up 0.95% on 22 June from the prior session, though it remained roughly 8.3% lower over the past month (Trading Economics, 22 June 2026).
Third-party gold forecast: Fed split tests bullish targets
As of 22 June 2026, third-party gold predictions point to a market that has pulled sharply back from its January peak near $5,595/oz. Institutional year-end targets cluster between $4,900/oz and $6,000/oz, with views split over the Federal Reserve's policy path and the durability of safe-haven demand.
Goldman Sachs (year-end target cut)
Goldman Sachs trimmed its year-end 2026 gold price target to $4,900/oz from $5,400/oz. Analysts Lina Thomas and Daan Struyven cited fading expectations for Federal Reserve rate cuts in 2026 as the main reason for the revision. The bank said near-term institutional outflows and shifting rate expectations could weigh on the outlook, although the revised target still implies upside from current levels (beincrypto.com, 19 June 2026).
J.P. Morgan (year-end and average targets)
J.P. Morgan Global Research maintained its year-end 2026 target of $6,000/oz, while cutting its 2026 annual average estimate to $5,243/oz from $5,708/oz. The bank said near-term investor demand had cooled to what it described as a trickle, but expects demand to re-accelerate in the second half of the year. It cited structural central bank buying as a key support and said $6,300/oz was possible in 2027 (J.P. Morgan, 9 June 2026).
Reuters (rate-hike pressure)
Reuters reported that spot gold traded near $4,188/oz on 13 June 2026, after touching $4,022 the previous session – its weakest level since November 2025. Strong US jobs data reinforced rate-hike expectations and pressured the metal, while a firmer US dollar added to the pullback (Reuters, 15 June 2026).
UBS (quarterly price path)
UBS projected gold at $5,200/oz by June 2026, $5,400/oz by September 2026, and $5,900/oz by December 2026. The forecast reflects the view that structural demand drivers – including geopolitics, US fiscal risks, and de-dollarisation – remain intact. UBS also set out an upside scenario of $6,200/oz, while reaffirming its base-case year-end target of $5,900/oz in mid-June (MoneyMagpie, 2 June 2026).
FX Leaders (Goldman Sachs revision in context)
FX Leaders reported that Goldman Sachs lowered its 2026 gold forecast to $4,900/oz from $5,400/oz on 20 June 2026, citing near-term institutional outflows and a reassessment of the rate-cut timeline. The revision put Goldman's target below those of J.P. Morgan and UBS, widening the range of institutional year-end estimates to $4,900–$6,000/oz (FX Leaders, 21 June 2026).
Predictions and third-party forecasts are inherently uncertain, as they cannot fully account for unexpected market developments. Past performance is not a reliable indicator of future results.
Gold price: technical overview
Gold spot prices traded at $4,209.59 as of 9:53am UTC on 22 June 2026, below all key simple moving averages (SMAs) on the daily chart. The 20-, 50-, 100- and 200-day SMAs stood at approximately $4,339.00, $4,530.00, $4,715.00 and $4,466.00 respectively, with the 100-day SMA above the 200-day. That placed the current price below the full moving-average band.
The 14-day relative strength index (RSI) read 39.65, placing it in lower-neutral territory and suggesting continued selling pressure without an oversold reading. The average directional index (ADX) stood at 37.44, indicating that an established trend remained in place.
On the classic pivot framework, the pivot point at $4,560.11 marked the nearest overhead reference. A daily close above that level would bring R1 near $4,754.00 into view. The Hull moving average (9) at $4,192.71 sat just below the current price, making it the nearest dynamic reference to the downside. If price moved below that level, classic S1 at $4,346.65 and S2 near $4,152.77 would form the next structural references on a further pullback (TradingView, 22 June 2026).
This technical analysis is for informational purposes only and does not constitute financial advice or a recommendation to buy or sell any instrument.
Gold price history (2024–2026)
The gold spot price opened June 2024 near $2,319.00 and spent much of mid-2024 consolidating, before a sustained rally carried prices through $2,600.00 by year-end. It closed 2024 at approximately $2,624.00.
The advance continued into 2025, with gold moving through $3,000.00 in the first quarter and rising above $3,400.00 by mid-year. By 22 June 2025, spot gold was trading near $3,373.00 – already high relative to 2024 averages. The rally then gathered pace through the second half, supported by central bank buying, haven demand and changing Federal Reserve rate expectations.
The sharpest move came in January 2026, when gold reached an intraday peak of approximately $5,598.00 on 28–29 January. The move coincided with heightened geopolitical uncertainty and a surge in institutional positioning. A swift reversal followed, with prices falling back to around $4,892.00 by 30 January.
Gold briefly recovered above $5,000.00 in early-to-mid March 2026, but selling pressure returned as the Fed signalled a more hawkish path. By 23 March, the intraday low had touched $4,098.00.
A further leg lower extended into early June 2026, with spot gold reaching $4,024.00 on 10 June – down roughly 28% from the January peak. Prices have since partly recovered.
Gold spot closed at $4,209.71 on 22 June 2026, approximately 3.2% lower year to date but 24.8% higher year on year.
Past performance is not a reliable indicator of future results. Prices are indicative and may differ from live market prices.
Gold price outlook: Capital.com analysis
Gold spot’s price trajectory over the past two years reflects a market caught between structural tailwinds and near-term headwinds. Central bank accumulation, persistent geopolitical risk and US fiscal concerns helped drive XAU to a historic intraday peak near $5,598.00 in late January 2026, reinforcing its role as a haven asset.
The subsequent correction of roughly 28% to the June 2026 lows shows how quickly even structurally supported assets can reprice when rate expectations shift. In this case, the Federal Reserve’s hawkish signals and a firmer US dollar weighed on the metal.
At current levels near $4,209.00, gold trades below all key long-term moving averages. Some analysts may read this as a sign of sustained selling pressure, while others may view the pullback as a reset within a longer-term trend. The Fed’s split June dot plot – with roughly half the committee favouring a rate hike – leaves risk two-sided. Further tightening could weigh on non-yielding gold, while any policy reversal or renewed geopolitical escalation could support a recovery.
Capital.com’s client sentiment for Gold CFDs
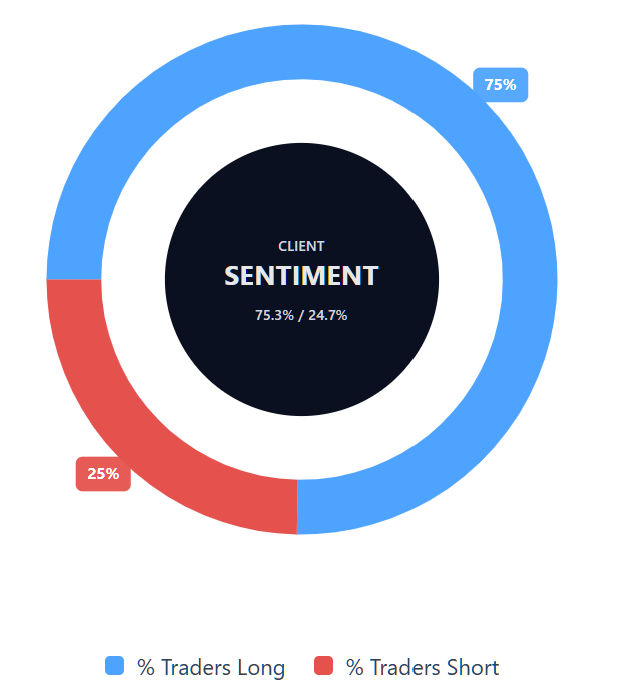
As of 22 June 2026, Capital.com client positioning in Gold spot CFDs shows 75.3% buyers versus 24.7% sellers. This puts buyers ahead by 50.6 percentage points and indicates a buyer-led positioning snapshot. This data reflects open positions on Capital.com and can change.
Summary – Gold price 2026
- Gold spot (XAU) traded at $4,209.59 as of 9:53am UTC on 22 June 2026, down approximately 3.2% year to date but 24.8% higher year on year.
- Key price drivers include Federal Reserve rate policy, US dollar strength, central bank gold buying, geopolitical risk and US fiscal concerns. Each could push prices in either direction.
- The Fed’s June 2026 dot plot split the committee on further hikes. A tightening move could weigh on gold, while any policy reversal or escalating geopolitical tension could support prices.
Past performance is not a reliable indicator of future results.
FAQ
What is the Gold price forecast?
Analyst forecasts cited in this article show a wide range of possible outcomes for gold spot in 2026. As of mid-to-late June, institutional year-end targets ranged from $4,900.00/oz at Goldman Sachs to $6,000.00/oz at J.P. Morgan, with UBS at $5,900.00/oz. These forecasts reflect differing views on Federal Reserve policy, safe-haven demand, central bank buying and broader macroeconomic risks. Forecasts can change as new data becomes available.
Could Gold’s price go up or down?
Gold’s price could move in either direction, depending on how key drivers develop. Further Federal Reserve tightening, a stronger US dollar or weaker investor demand could weigh on gold, particularly as it does not pay interest. However, renewed geopolitical tension, central bank buying, US fiscal concerns or a shift back towards looser monetary policy could support prices. Technical indicators also suggest recent selling pressure, so traders may continue to watch momentum and support levels closely.
Should I invest in Gold?
Whether gold is suitable for you depends on your financial goals, risk tolerance and market knowledge. Gold is often viewed as a haven asset, but its price can still move sharply, as shown by the correction from its January 2026 peak to the June lows. This article is for informational purposes only and does not constitute financial advice. You should do your own research and consider seeking independent advice before making any investment or trading decision.
Can I trade Gold CFDs on Capital.com?
Yes, you can trade Gold CFDs on Capital.com. Trading commodity CFDs lets you speculate on price movements without owning the underlying asset and to take long or short positions. However, contracts for difference (CFDs) are traded on margin, and leverage amplifies both profits and losses. You should ensure you understand how CFD trading works, assess your risk tolerance, and recognise that losses can occur quickly.