What is a cup and handle pattern in trading?

Originally introduced by William J. O’Neil in the late 1980s, the cup and handle pattern has established itself as a staple in technical analysis. Here’s more on how it forms, how to identify it, and how you can approach trading it.
What is a cup and handle pattern?
The cup and handle pattern is a technical chart formation used to identify potential bullish continuation or reversal in an asset’s price. Known for its distinctive U-shaped profile followed by a shallow downward pullback, the pattern indicates consolidation before the prevailing uptrend may resume.
On a price chart, the 'cup' forms as the price initially declines, then gradually recovers to the previous high, creating a rounded, symmetrical bottom. The 'handle' develops when the price consolidates slightly lower – typically on diminished volume – and then breaks out above the handle's resistance level.
Some traders interpret this sequence as a signal of shifting supply and demand dynamics, with the handle representing final consolidation ahead of a potential upward move.
Past performance is not a reliable indicator of future results.
How does the cup and handle pattern form?
The cup and handle pattern forms in two distinct phases: the 'cup' and the 'handle'.
The cup
-
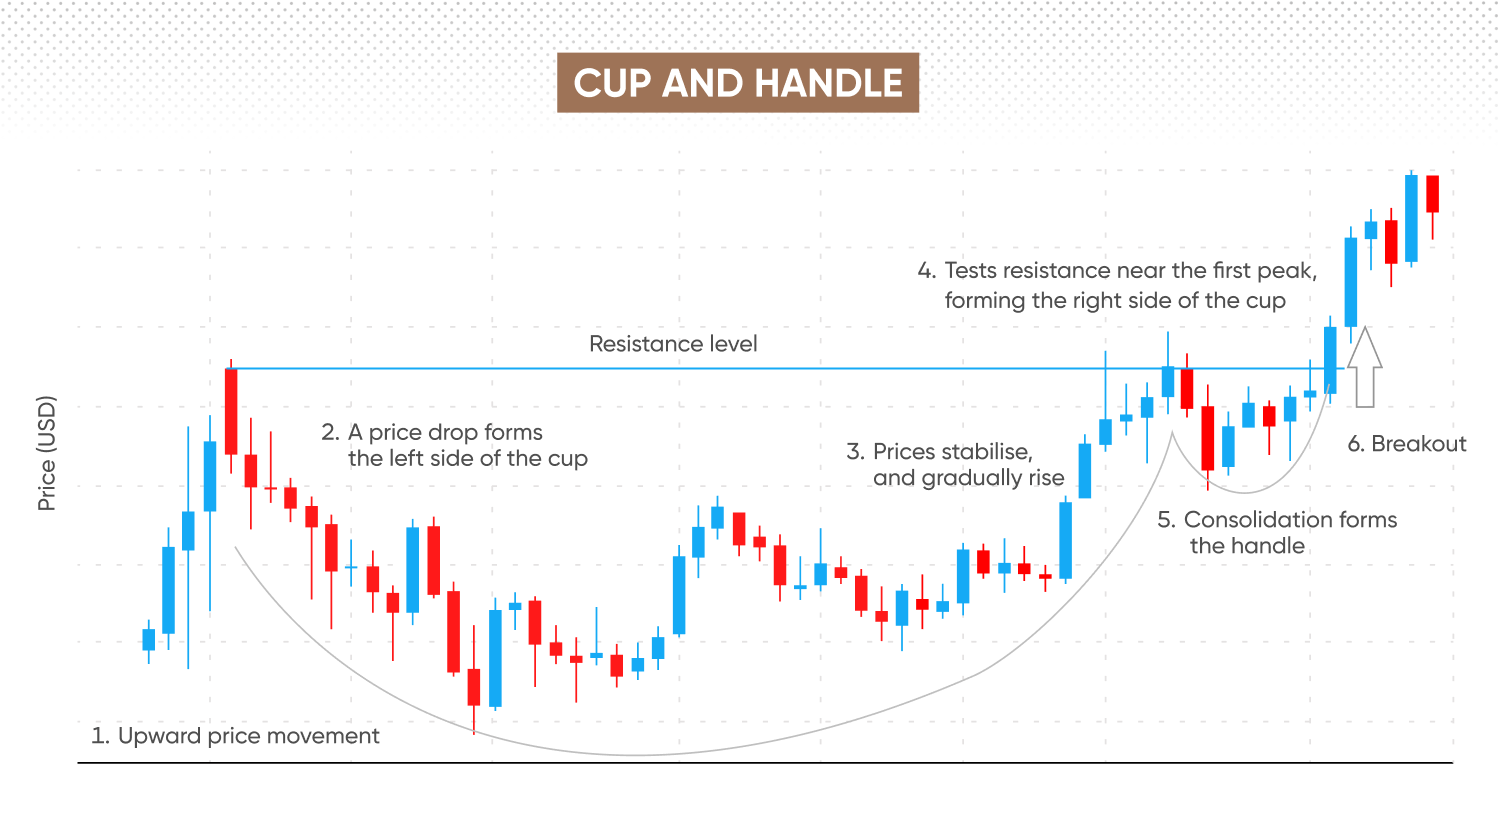
The formation begins with a noticeable upward price movement, followed by a decline that creates the left side of the cup.
-
Prices then stabilise and gradually rise – sometimes with decreasing volume – forming a rounded, bowl-shaped recovery.
-
This recovery should ideally retrace the initial decline, returning close to the left peak’s level, but not necessarily exceeding it.
-
Typically, the cup forms over one to several months, with buying pressure potentially increasing towards the end of the cup.
The handle
-
After prices test the cup's right peak, a slight retracement or consolidation occurs, forming the handle just below the resistance level.
-
This price contraction may involve a shallow, downward or sideways move – sometimes with declining trading volume – possibly forming a flag, wedge, or triangle pattern.
-
The handle shouldn’t exceed 33% of the cup's depth from trough to peak; deeper declines risk invalidating the pattern.
Cup and handle pattern rules
Here are some key rules for effective identification and trading of cup and handle patterns:
-
Volume confirmation
-
Pattern duration
-
Entry and exit points
1. Volume confirmation
Volume often decreases as the cup forms, reflecting reduced activity, but it should increase markedly when the price breaks above the handle’s resistance. This surge typically indicates stronger market momentum and can lower the likelihood of a false breakout.
2. Pattern duration
The duration of a cup and handle pattern can vary significantly, depending on the chart timeframe. Formation periods typically range from a few weeks to several months, influenced by market conditions and volatility.
The handle should be shorter – typically lasting from a few days to a few weeks – and ideally be less than one-third of the cup’s size. Patterns with disproportionately long handles or cups that form rapidly are considered less reliable.
3. Entry and exit points
Clearly defined entry and exit points help traders apply the cup and handle pattern effectively:
-
Entry point: traders usually enter positions as the price breaks out above the resistance formed by the handle. A clear close above this resistance line, supported by strong volume, confirms the pattern.
-
Stop-loss placement: a common strategy is to place a stop-loss just below the lowest point of the handle or slightly below the breakout level to manage risk effectively.
-
Exit or target: calculate your initial price target by measuring the distance from the bottom of the cup to the handle’s resistance and projecting it upwards from the breakout point. Alternatively, you could set a more conservative target by measuring twice the handle’s height and adding it to the breakout price.
Discover more formations in our 12 chart patterns for traders guide.
Cup and handle pattern target
Calculating a realistic price target is essential when trading the cup and handle pattern. Traders typically set targets by measuring the vertical distance from the bottom of the cup to the breakout level, which forms the handle’s resistance.
To calculate this target:
-
Identify the bottom of the cup: note the lowest price reached during the cup formation.
-
Measure vertically to the breakout point: determine the price distance between this low and the handle’s resistance – the point where the price breaks out above the handle.
-
Project this distance upward: add this measurement to the breakout level to establish your price target.
How to trade the cup and handle pattern
Trading the cup and handle pattern can be relatively straightforward when you approach it systematically. CFDs let you speculate on both upward and downward market moves.
Here’s how to trade the cup and handle pattern:
-
Identify the breakout – begin by confirming a clear breakout above the handle’s resistance. Ideally, this breakout should be supported by higher volume, which may indicate stronger market momentum.
-
Entry point – set a buy order slightly above the breakout level of the handle to catch momentum as the trend resumes.
-
Stop-loss placement – place your stop-loss just below the lowest point of the handle to manage risk effectively. Alternatively, for a more conservative approach, set it slightly beneath the breakout line.
-
Take-profit levels – estimate your profit target by measuring the distance from the bottom of the cup to the resistance level (the top of the cup). Then add this measurement directly to the breakout price to find your potential exit.
Example with real chart analysis
Assume a hypothetical scenario, where:
- You observe a cup and handle forming on Apple shares.
- The cup bottomed at $90, and the breakout occurred at $100, providing a clear 10-point measure.
- Your buy-stop order triggers at $101, just above the breakout.
- You set your stop-loss at $97, slightly below the handle’s lowest point of $98.
- The initial take-profit target is $110 ($100 breakout plus the 10-point measure).
Conversely – had the breakout failed and price dropped back below $98 – your stop-loss at $97 would trigger, potentially limiting your loss. Please note that stop-loss orders aren’t guaranteed. A guaranteed stop-loss incurs a fee if triggered.
Inverted cup and handle pattern
An inverted cup and handle pattern may signal a potential bearish reversal or continuation, depending on the preceding trend. Visually, it resembles an upside-down 'U' shape (the inverted cup), followed by a smaller, upward-sloping retracement or consolidation (the handle).
Here’s how an inverted cup and handle can take shape:
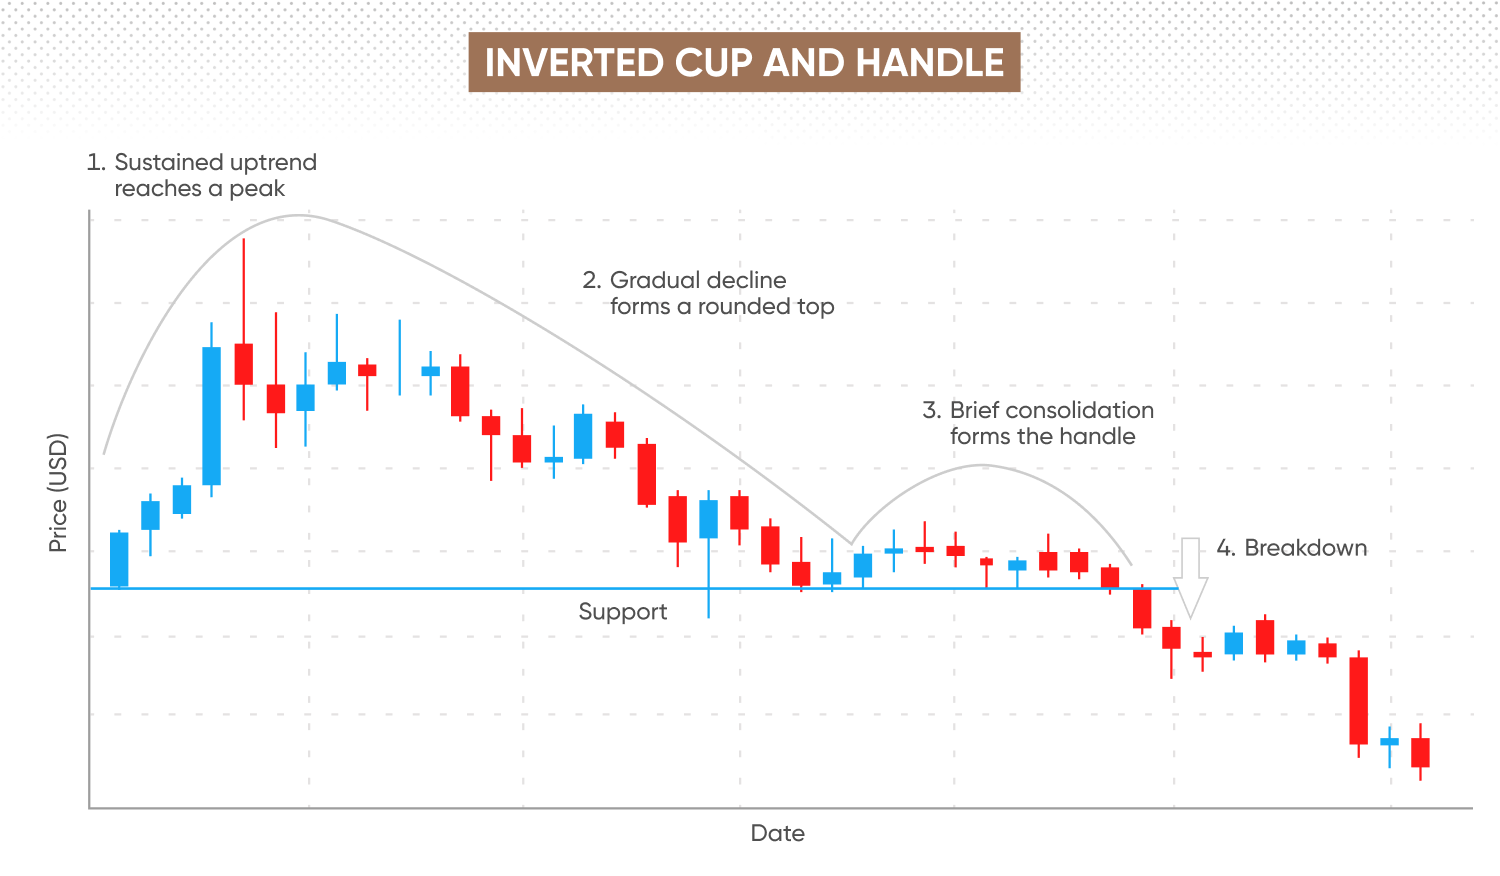
- The pattern typically forms after a sustained up trend, culminating in an initial peak, followed by a gradual decline – this forms the inverted cup.
- Following this decline, prices experience a brief recovery or sideways consolidation, typically on lower volume – the handle.
- Volume usually remains subdued during the handle formation but may increase suddenly upon breakout, potentially confirming the pattern.
- Ideally, the handle should remain in the upper third of the inverted cup’s depth; deeper retracements may invalidate the pattern.
You can identify the inverted cup and handle by drawing a support line (neckline) at the base of the cup. A pattern is confirmed when prices move decisively below the handle's support level, usually accompanied by higher trading volume.
How to trade the inverted cup and handle
-
Entry: some traders open short positions if prices break below the handle’s support.
-
Stop-loss: a stop-loss can be set just above the handle’s high, as this level may act as resistance if the pattern fails.
- Target: estimate the target by measuring the vertical distance from the inverted cup’s peak to the handle's support line and projecting it downward from the breakout point.
Past performance is not a reliable indicator of future results.
FAQs
What happens after a cup and handle pattern?
After the cup and handle pattern completes, traders often look for the price to continue its prior upward trend. However, continuation isn’t guaranteed, and the pattern can occasionally signal a reversal, particularly in certain market contexts. While increased buying momentum and volume confirmation are commonly sought, these factors may not always be present. Manage risk effectively and – where possible – confirm breakouts with technical analysis.
Is the cup and handle a bullish pattern?
Yes, the traditional cup and handle is generally regarded as a bullish continuation formation because it tends to emerge after an advance and indicates renewed buying interest once price breaks above the handle. Nevertheless, past performance isn’t a reliable indicator of future results; confirm with volume and manage risk appropriately.
Is the cup and handle pattern accurate?
While widely recognised, the cup and handle pattern isn’t foolproof. Its reliability depends on correct identification, volume confirmation, and prevailing market conditions. The pattern’s effectiveness can vary across different markets and timeframes, and historical performance is mixed. False signals do occur, particularly if the handle is unusually deep or volume confirmation is weak. Using other indicators alongside it may enhance accuracy.
Can this pattern be used in crypto or forex?
Yes, the cup and handle pattern can be observed in various markets, including cryptocurrencies and forex. However, its effectiveness may differ depending on market liquidity and volatility, and it may be less reliable in highly volatile or illiquid conditions.
How do I identify invalid cup and handle patterns?
Invalid cup and handle patterns usually feature irregular shapes, overly deep handles, or weak volume during breakout. Genuine patterns often have smooth, rounded bottoms, shallow handles, and may show clear volume increases upon breakout, though these features aren’t always present. Technical indicators can help filter out false patterns.
How long does a cup and handle pattern take to form?
Cup and handle patterns can vary significantly in formation time – from several weeks to multiple months, depending on market conditions and time frame. Shorter formations (days or a couple of weeks) may lack reliability, whereas longer, clearly defined patterns tend to offer stronger signals. In many cases, the cup forms over one to six months, with the handle developing over one to four weeks.