How to trade triangle patterns

Learn how to identify and trade ascending, descending and symmetrical triangle chart patterns when trading CFDs with Capital.com.
What are triangle patterns?
Triangle patterns are candlestick chart patterns that typically signal a period of price consolidation as trading volume decreases. They may indicate the continuation of a previous trend, but can also signal a potential reversal. Triangle patterns may be bullish, bearish or neutral depending on the type and the market conditions when the pattern occurs.
Where volume decreases during the market consolidation phase of a triangle chart pattern, sentiment is mixed and neither buyers nor sellers have control. As a result, the price will fluctuate, swinging up and down with no clear trend or direction.
Triangle patterns have two converging trend lines representing a narrowing price range due to market consolidation, with low trading volume and mixed investor sentiment.
-
The upper trendline, or supply line, connects the highs of the price peaks and indicates bearish pressure limiting price growth.
-
The lower trendline, or support line, connects the lows of the price troughs and indicates bullish pressure limiting price declines.
As the lines converge, the likelihood of a price breakout, either above or below one of the trendlines, increases. If the price breaks in the direction of the previous trend, the triangle acts as a continuation signal. However, if the price breaks in the opposite direction, it may indicate a trend reversal.
What is the ascending triangle pattern?
An ascending triangle is a bullish chart pattern that forms during consolidation after an uptrend to signal a potential continuation of the prior trend. They can also appear after a downtrend to signal a potential bullish reversal.
The pattern forms when price reaches peaks near the same level each time. Meanwhile, each dip gets progressively higher, representing increased buying pressure.
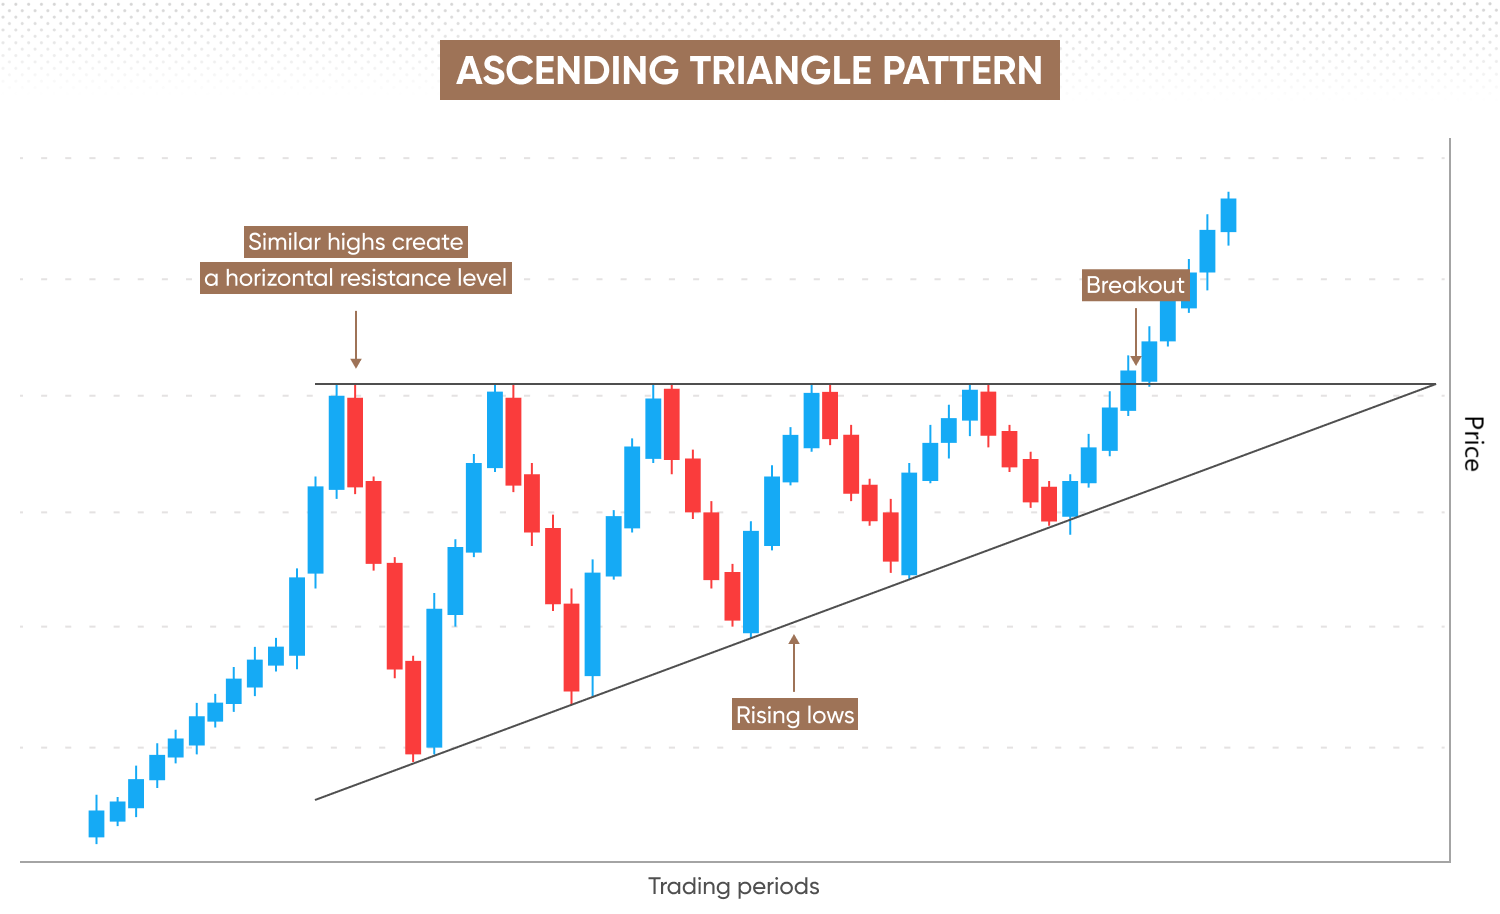
Ascending triangles emerge when you can draw a horizontal upper trendline connecting the near-identical peaks, and a diagonal upward-sloping lower trendline connecting the rising lows. As the trendlines converge towards an apex, the price range narrows.
The upper trendline acts as a resistance level. Once the price breaks above this resistance, the pattern is complete. The signal is confirmed if price enters a sustained uptrend.
However, if the price breaks below the lower trendline instead, there’s a chance the price will move in the opposite direction to the prior trend.
What is the descending triangle pattern?
A descending triangle is a bearish chart pattern that forms during consolidation after a downtrend, signalling a potential continuation of the prior trend. It can also emerge after an uptrend to signal a potential bearish reversal.
This pattern forms when the price rises to peaks that get progressively lower, representing increased selling pressure. The lower peaks are followed by dips, with each dip forming around the same level and creating a horizontal support line.
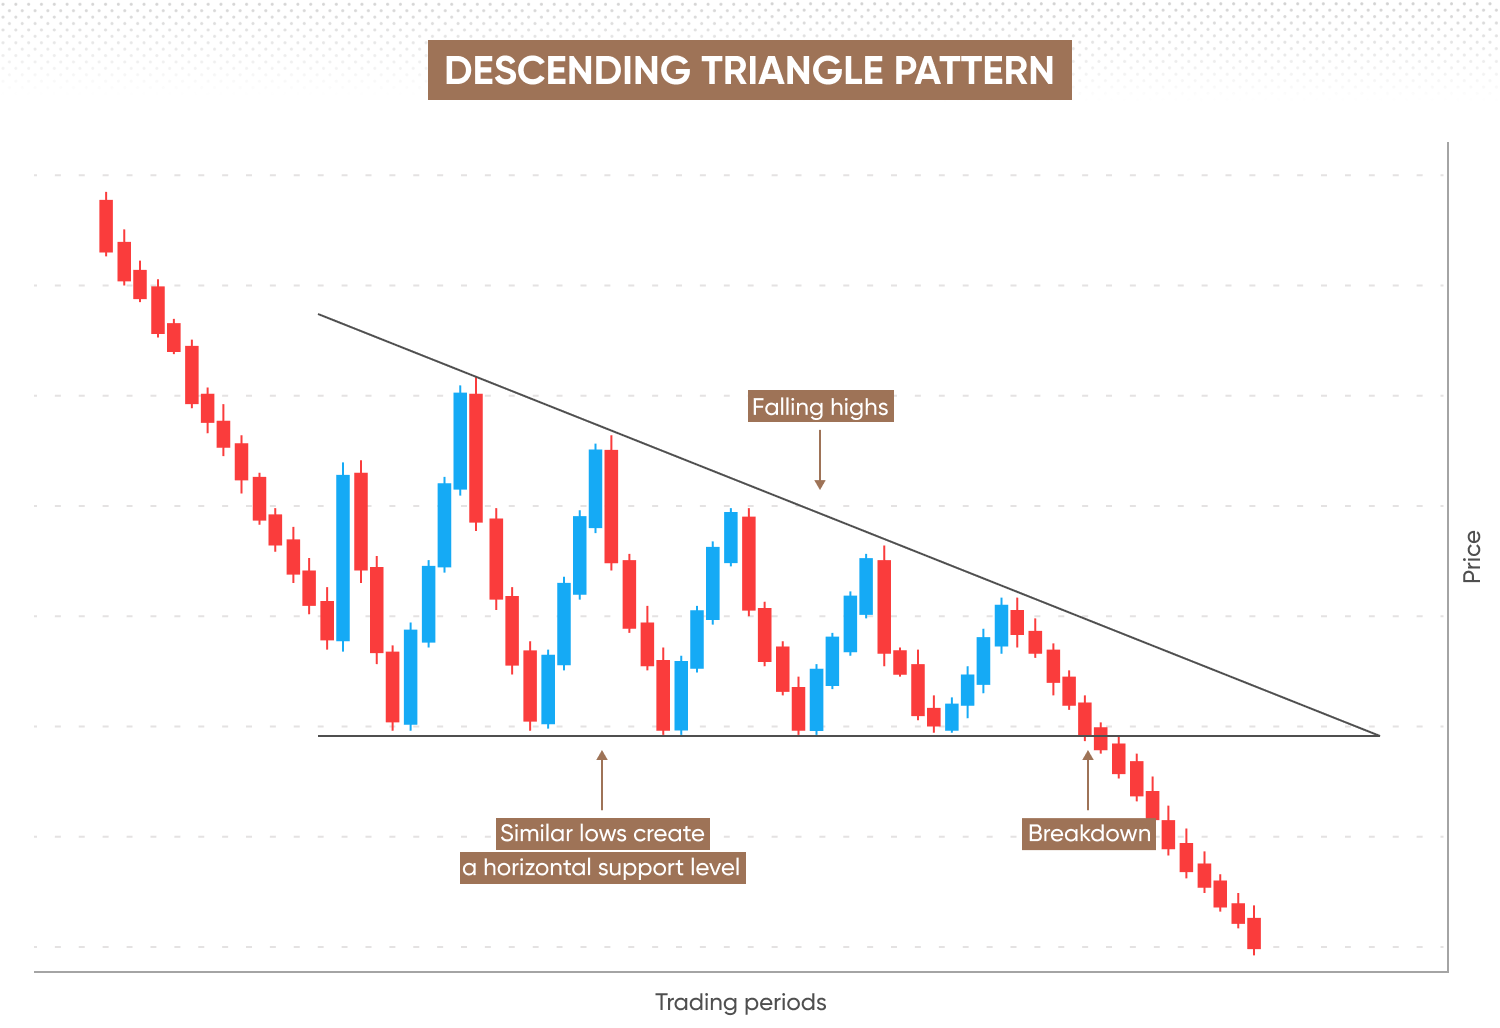
Descending triangles emerge when you can draw a diagonal downward-sloping upper trendline connecting the descending peaks, and a horizontal lower trendline connecting the near-identical troughs. As the lines converge towards an apex, the price range narrows.
The lower trendline acts as a support level. Once the price breaks below this support, the pattern is complete. The signal is confirmed if price enters a sustained downtrend.
However, if the price breaks above the upper trendline instead, there’s a chance the price could move in the opposite direction to the prior trend.
What is the symmetrical triangle pattern?
A symmetrical triangle is a neutral pattern that may form after a bearish, bullish or sideways trend which may signal the continuation of a prior trend, though it can also signal a reversal, especially if it appears at market tops or bottoms.
This pattern forms during market consolidation, where the price reaches progressively lower peaks, representing increasing pressure from sellers, and progressively higher troughs, representing rising pressure from buyers.
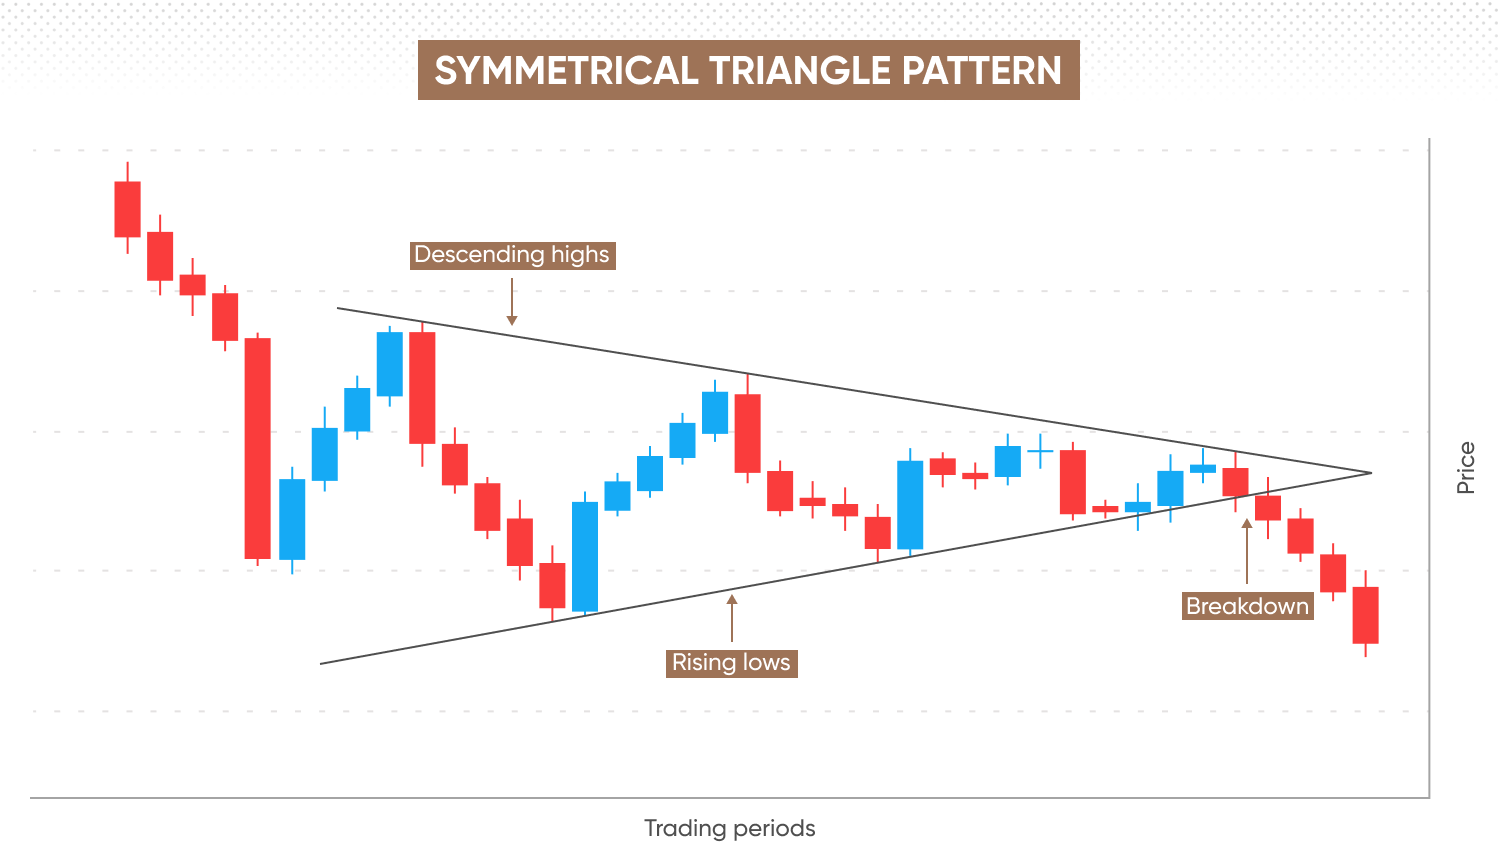 Symmetrical triangles emerge when you can draw a downward-sloping upper trendline across the descending peaks, and an upward-sloping lower trendline connecting the rising troughs. As the lines converge towards an apex, the price range narrows.
If the symmetrical triangle appears after a bull trend, the price may break above the upper trendline, potentially signalling a continuation of the uptrend.
Following a bear trend, the price may break below the lower trendline, potentially signalling a continuation of the downtrend.
When a symmetrical triangle forms after a neutral trend (sideways movement), the price could break out in either direction, or the market may continue moving sideways.
How do triangles work in technical analysis?
When you see signs of a triangle chart pattern emerge, look out for key visual identifiers and use additional indicators and technical analysis to help confirm the signal.
First, observe the conditions before the triangle forms. Keep an eye out for converging trendlines and ensure the pattern emerges during market consolidation.
-
In an ascending triangle, the upper trendline is horizontal while the lower trendline slopes upwards at a diagonal angle.
-
In a descending triangle, the upper trendline slopes downwards at a diagonal angle while the lower trendline is horizontal.
-
In a symmetrical triangle, both the upper trendline descends and the lower trendline ascends diagonally.
Once you’ve identified the triangle pattern, you can use additional technical tools to assess the potential breakout direction and strength:
-
Moving averages and moving average convergence divergence (MACD) to confirm the direction of the breakout.
-
Relative strength index (RSI) to gauge whether the trend is overbought or oversold.
-
Fibonacci retracement levels to identify potential support and resistance levels after the breakout.
How to trade triangle patterns
You can trade triangle patterns using CFDs or spread betting with a breakout trading strategy. Here are the steps:
- 1. Identify the triangleLook at the converging trend lines to determine the type of triangle. In an ascending triangle, the upper trendline will be horizontal and the lower line will rise at an angle. In a descending triangle, the upper trendline will descend at an angle with the lower line horizontal. In a symmetrical triangle, the upper trendline descends while the lower line rises.
- 2. Wait for the breakout Triangles form during a period of consolidation, where the price range narrows and sentiment is either mixed or indecisive. A breakout occurs when the price moves above the upper trendline or below the lower trendline, often in the direction of the preceding trend.
- 3. Volume confirmationLook for increased volume after the breakout to confirm the strength of the trend.
- 4. Set entry and stop-loss*/limit orderConsider entering a position once the trend appears to be sustained. You may decide to place a stop-loss just below the lower trendline for bullish breakouts, or above the upper trendline for bearish breakouts, as part of a risk management plan.
- 5. Set a price targetMeasure the vertical height of the triangle (the distance between the highest and lowest points within the pattern). Then, project this distance from the breakout point in the direction of the breakout to estimate your price target.
- 6. Practice on a demo: You can practise using historical examples or real-time market prices with our demo account, which allows you to trade risk-free with virtual funds.
Create an account Open a demo account
*Stop-losses are not guaranteed.
FAQs
How to trade triangle patterns
To trade triangle patterns, first identify the triangle by spotting converging trendlines. Wait for a breakout, which occurs when the price moves beyond a trendline during consolidation. Confirm the breakout by checking for increased trading volume, then set your entry once the trend stabilises, using stop-loss orders to manage risk. To set a price target, measure the triangle's height and project it from the breakout point.
What does a triangle pattern indicate?
Triangle patterns indicate bullish, bearish, or neutral moves based on their type and prior market conditions. Ascending triangles typically indicate a bullish continuation, suggesting the uptrend may persist. Descending triangles often point to a bearish continuation, signalling a potential downtrend. Symmetrical triangles are neutral, hinting at trend continuation in either direction. If the triangle breaks in the opposite direction, it could signal a trend reversal. However, past performance is not a reliable indicator of future results.
How do you trade expanding triangle patterns?
An expanding triangle forms during high volatility, with higher peaks and lower dips, creating diverging trendlines. It involves at least five widening swings, reflecting growing buyer and seller uncertainty. This pattern is hard to predict, making it an advanced trading strategy. You can either range trade by playing the widening price swings between trendlines or wait for a breakout. For breakouts, enter a position once the price moves beyond a trendline, set your exit levels, and use a stop-loss to manage risk in case the breakout fails.