Volatile Trading Ahead of October Option Expiry as Dollar Rally Falters
Volatility in the stock market remained very high on Wednesday, 15 October, with sharp moves in both directions as equities searched for a clear path forward ahead of October’s option expiry.
Meanwhile, the dollar has now been weak for two consecutive days and appears to be on the cusp of losing all the momentum it had built up earlier in the month.
S&P 500 Stalls at the 20-Day Moving Average, Again
The S&P 500 saw a very sharp opening — this time higher — before the equity market gave back most of those gains throughout the day. The S&P 500 even briefly turned negative before recovering some of the losses and finishing the day up around 40 basis points.
However, it’s worth noting that despite all the intraday swings, the S&P 500 has effectively moved sideways since Monday afternoon. Stocks are still sitting just below the 20-day simple moving average, which has now acted as resistance for three consecutive days. Each attempt to move above it has so far failed, which could be telling us a lot about where the market is positioned heading into option expiry at the end of this week.
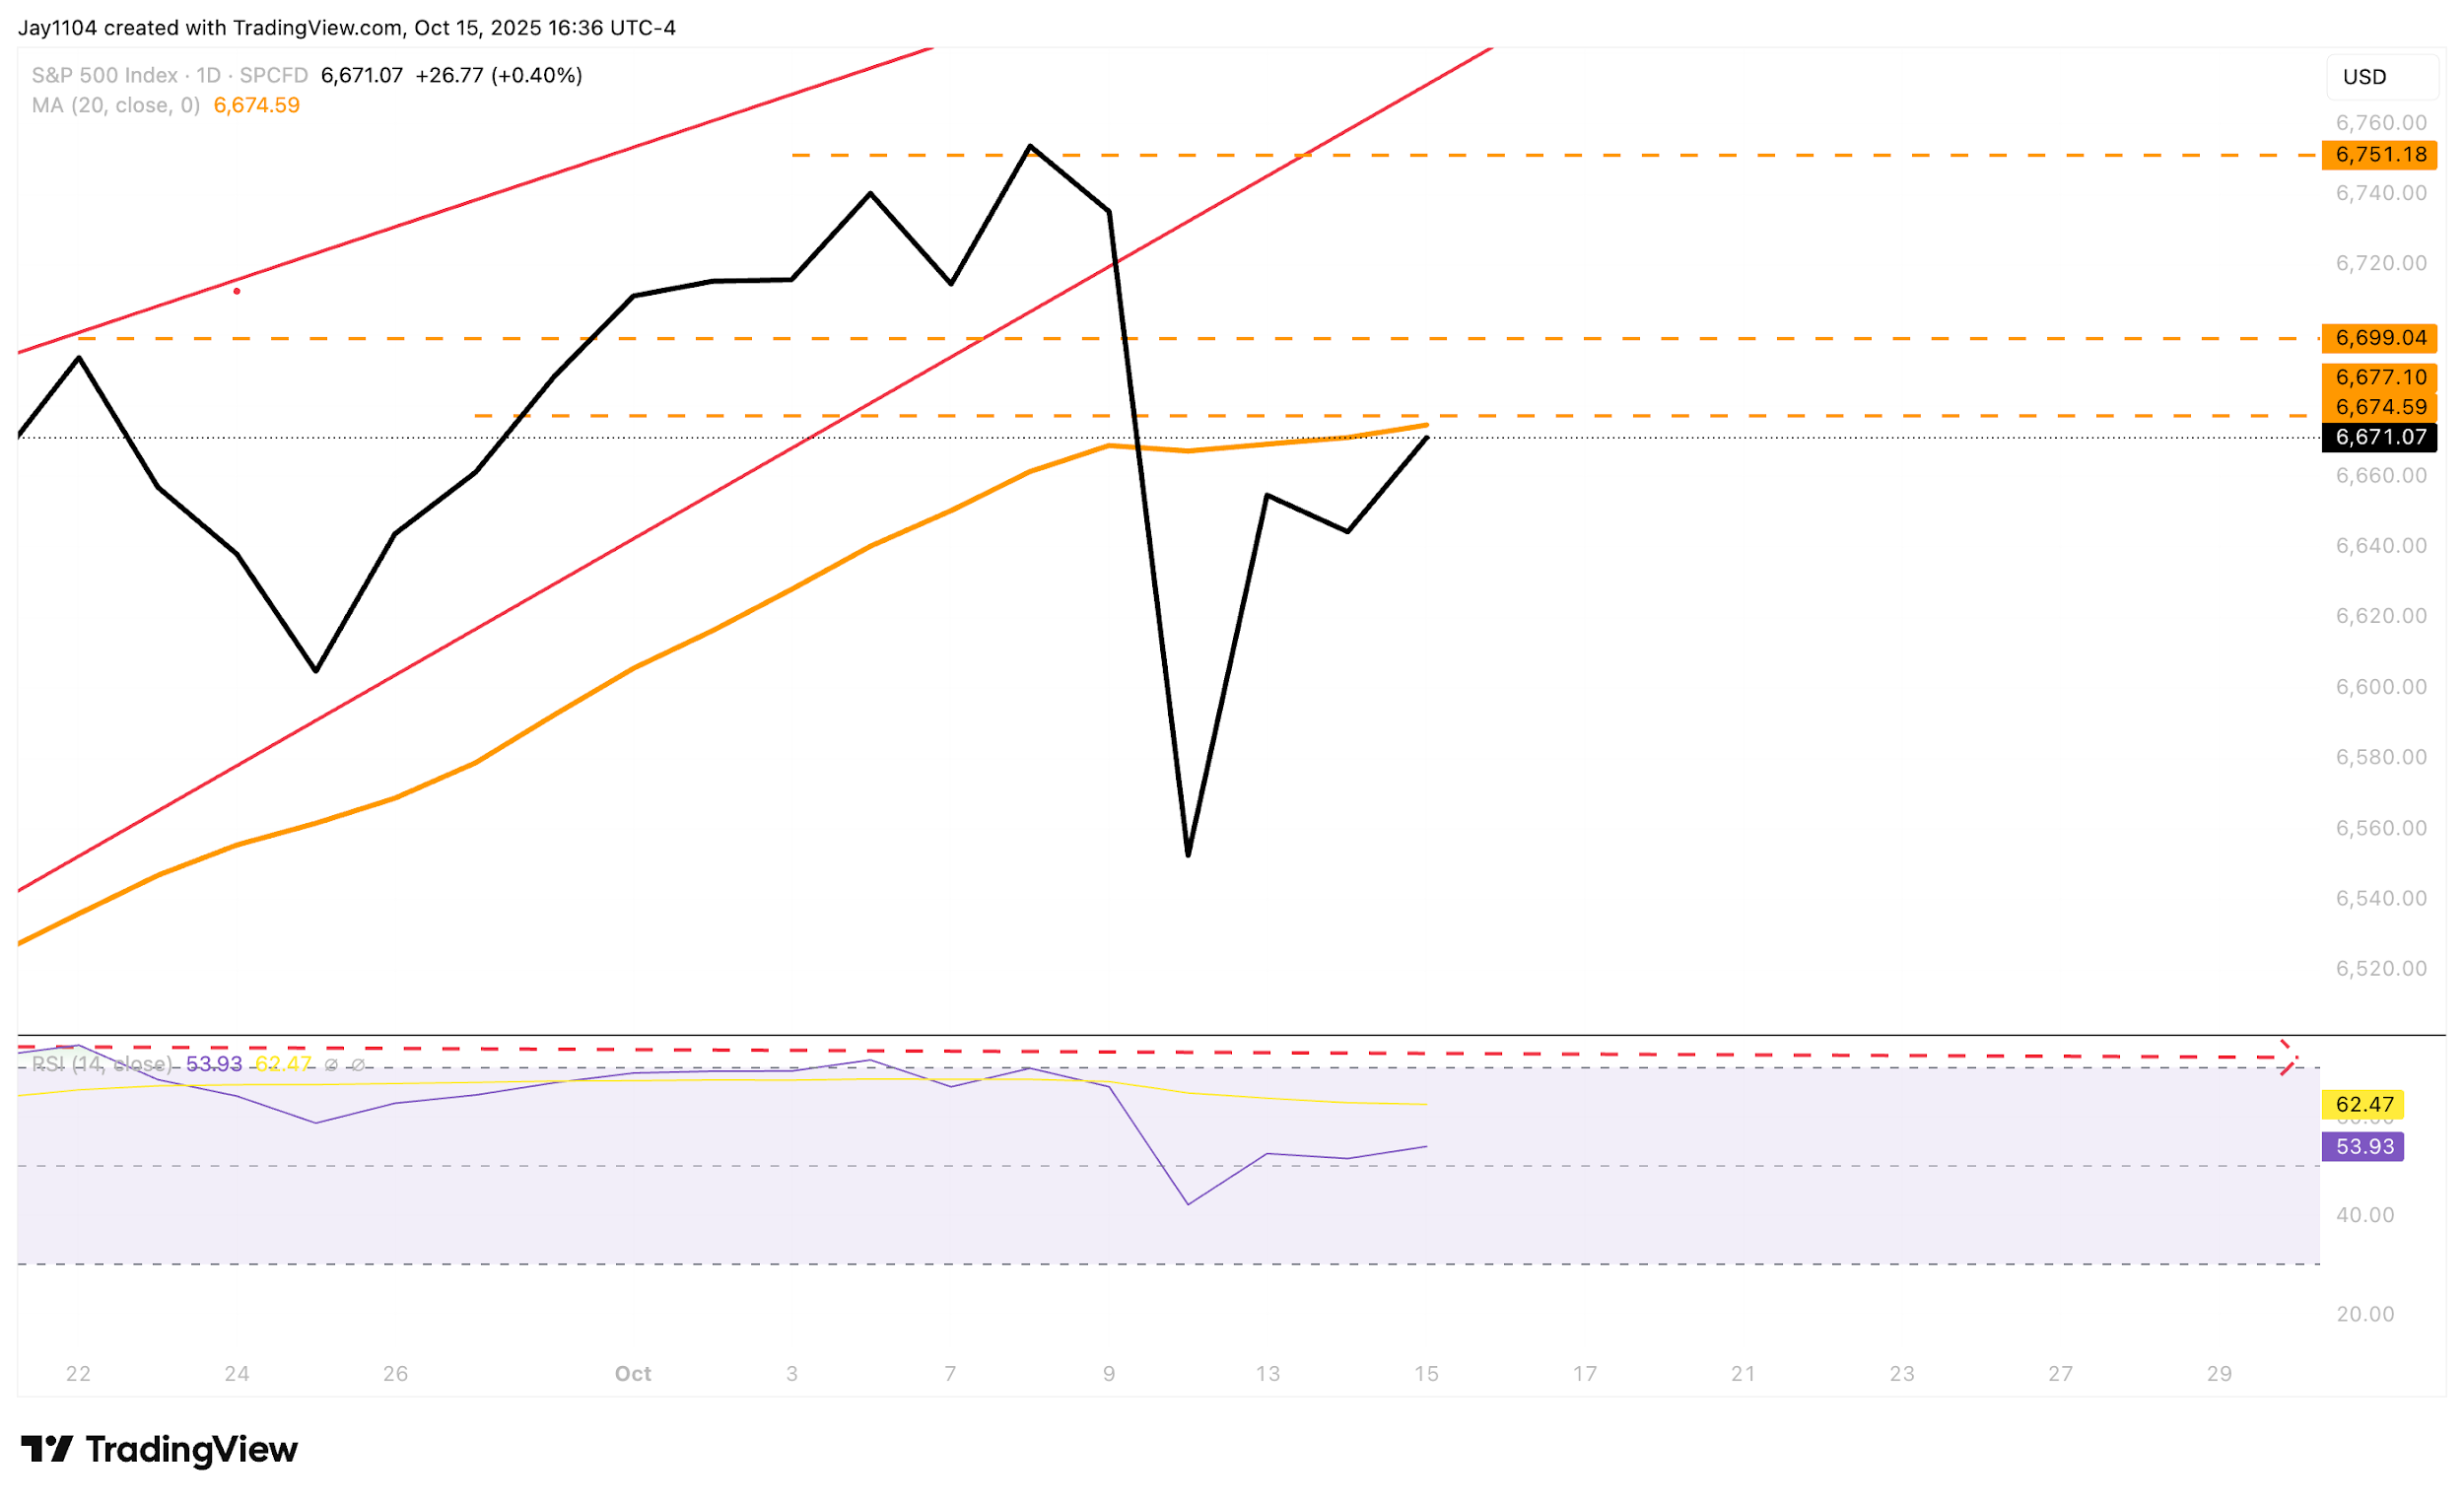
(Source: TradingView)
(Past performance is not a reliable indicator of future results)
The call wall for Friday’s option expiry is strongest at 6,700 — the strike with the highest concentration of call gamma. Meanwhile, the put wall, or the strike with the most significant amount of put gamma, sits at 6,500. It would suggest that the upside for the S&P 500 currently appears capped around 6,700, while the downside could be quite substantial if the index begins to decline.
Currently, the market appears to be trapped between 6,675 and 6,700, primarily due to pinning effects associated with option expiry. However, it’s essential to remain alert, as a move lower could quickly see the index falling towards 6,500, where the next notable area of support is likely to be found.
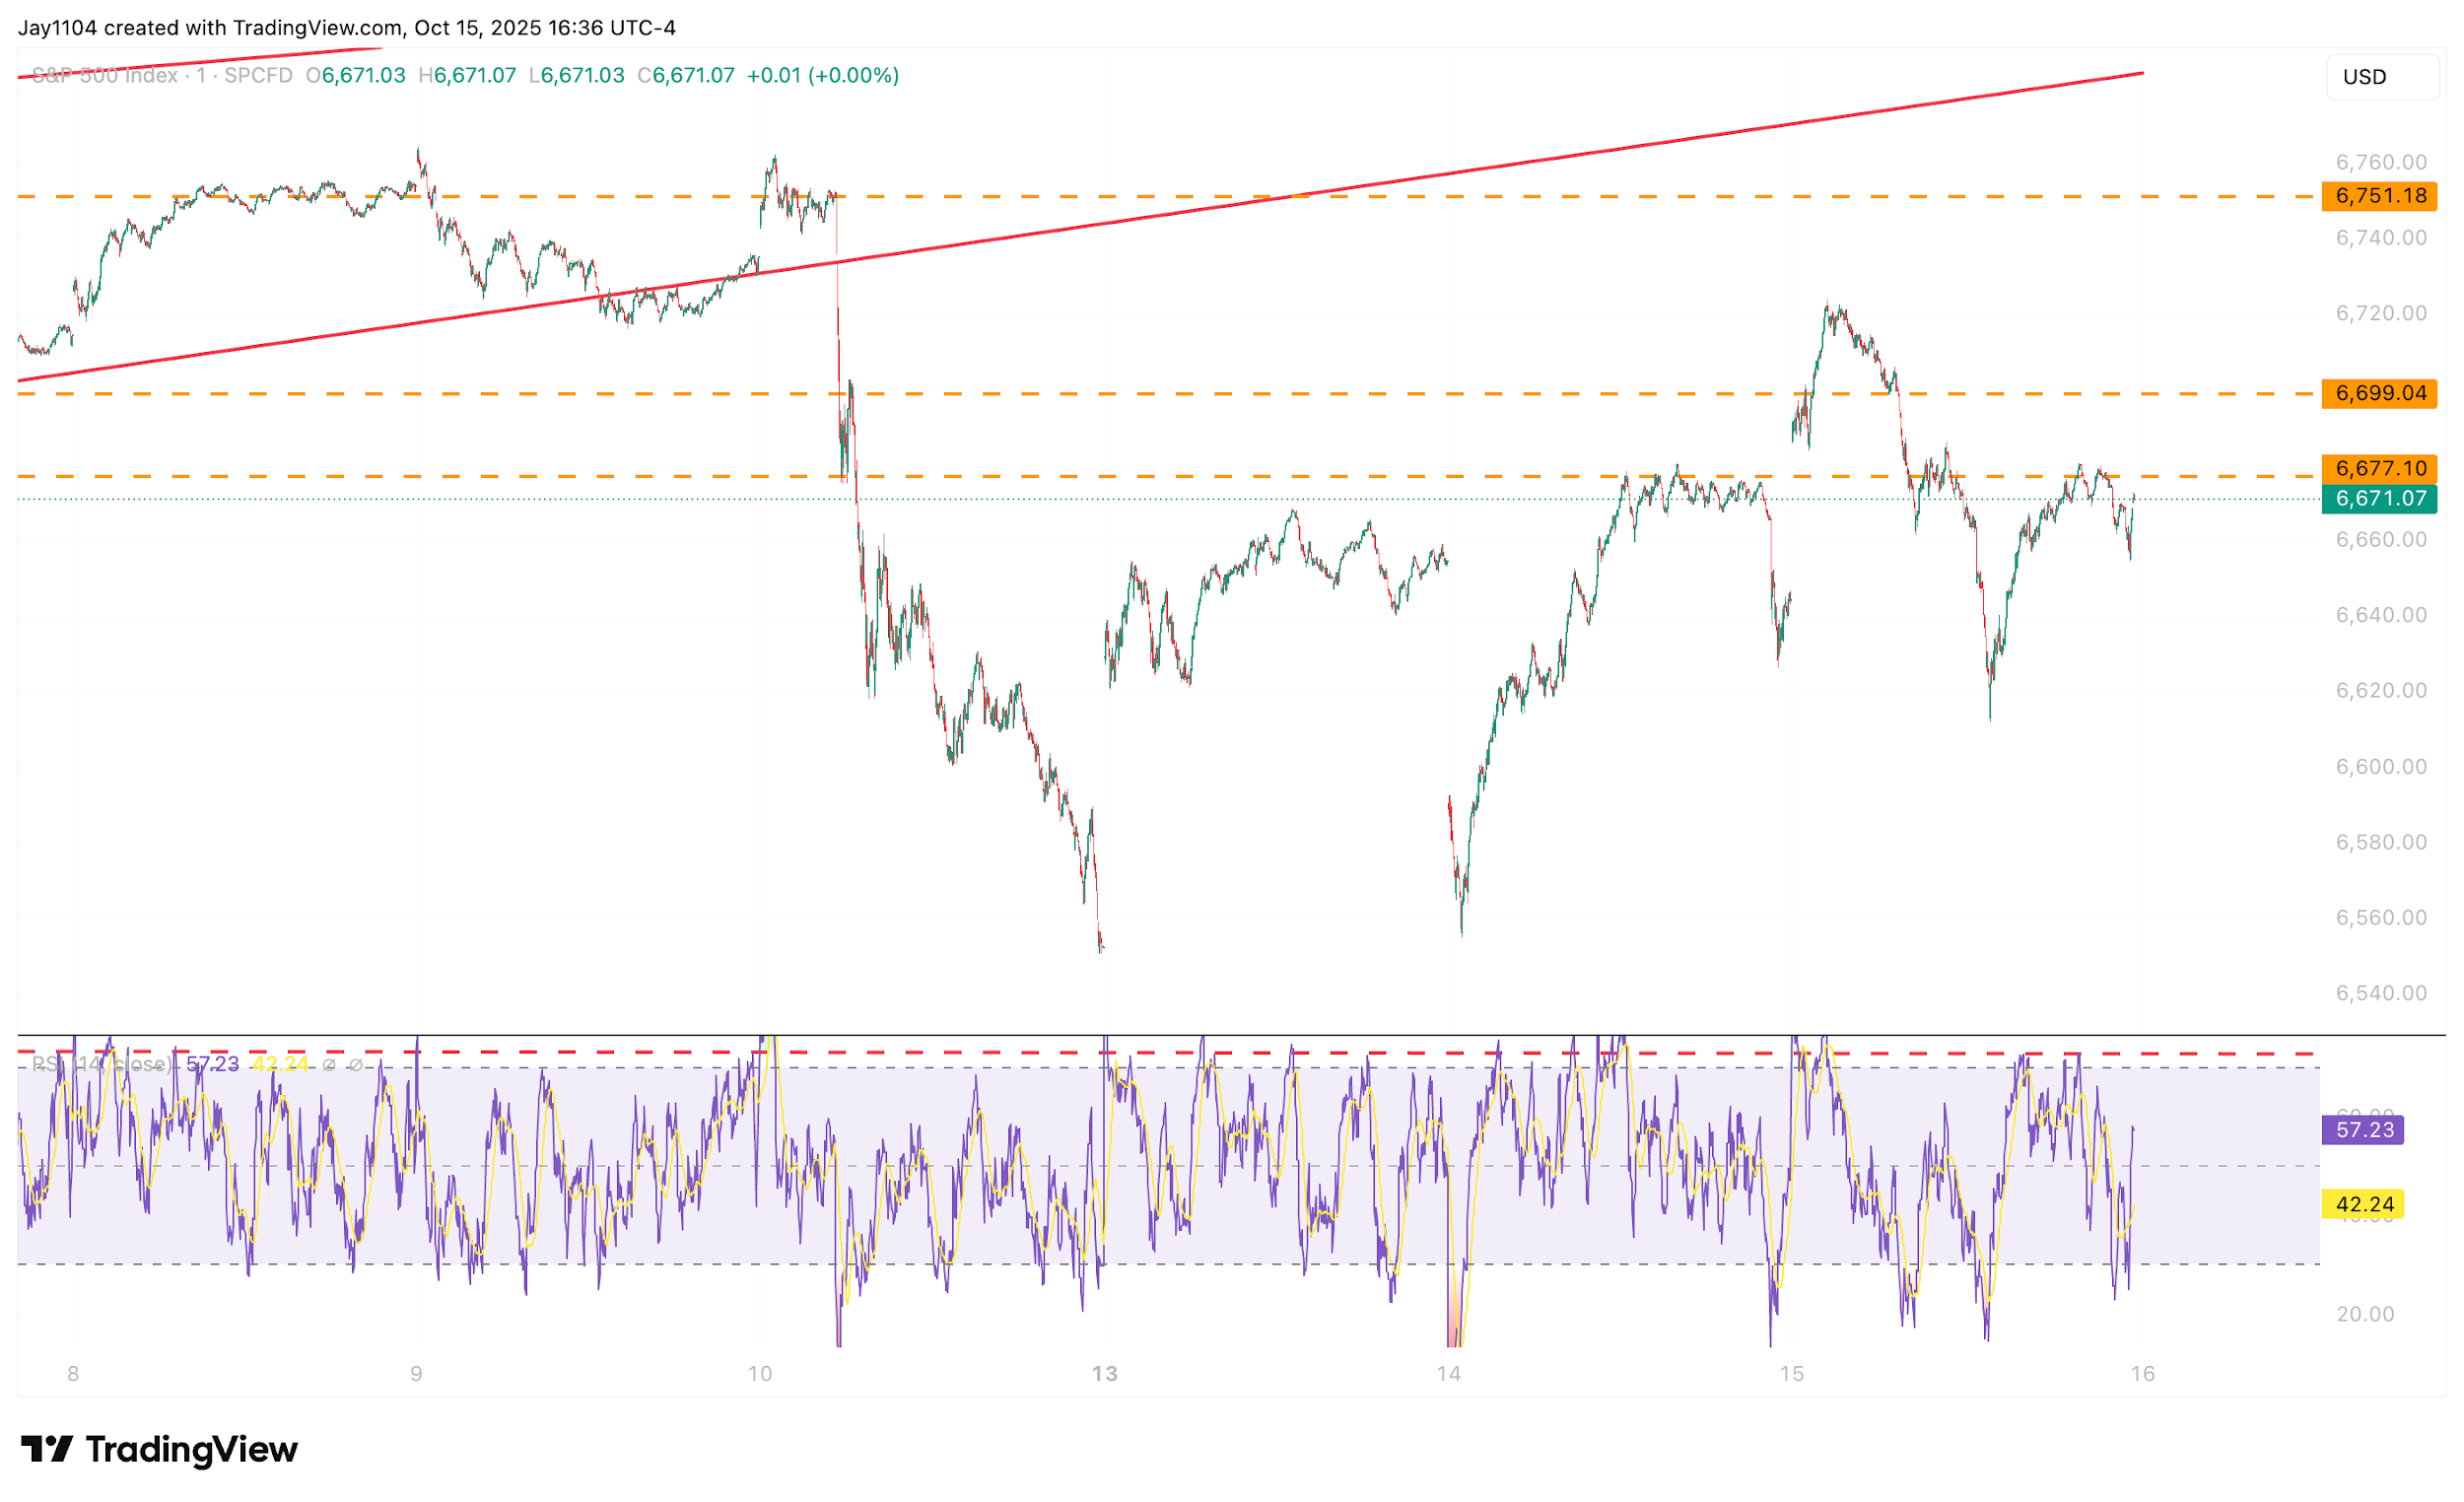
(Source: TradingView)
(Past performance is not a reliable indicator of future results)
Regional Bank Weakness
The S&P Regional Bank ETF (KRE) fell by more than 2% Wednesday, after rallying over 3% on Tuesday. Interestingly, the KRE has now risen to resistance around $63.5 for two consecutive days, a level that also coincides with the 20-day moving average and has so far failed to break above it.
It’s also worth noting that the KRE broke below an uptrend line on 8 October, a trend that had been in place since the lows of April. More importantly, the Relative Strength Index (RSI) has established a steady downtrend, indicating that momentum within the regional banking sector has turned negative and that further downside could be ahead.
If the KRE continues to move lower, support appears around $60.25, with a break of that level potentially paving the way for a decline below $59.5. Meanwhile, resistance remains firm around $63.5, extending up to roughly $64.25.
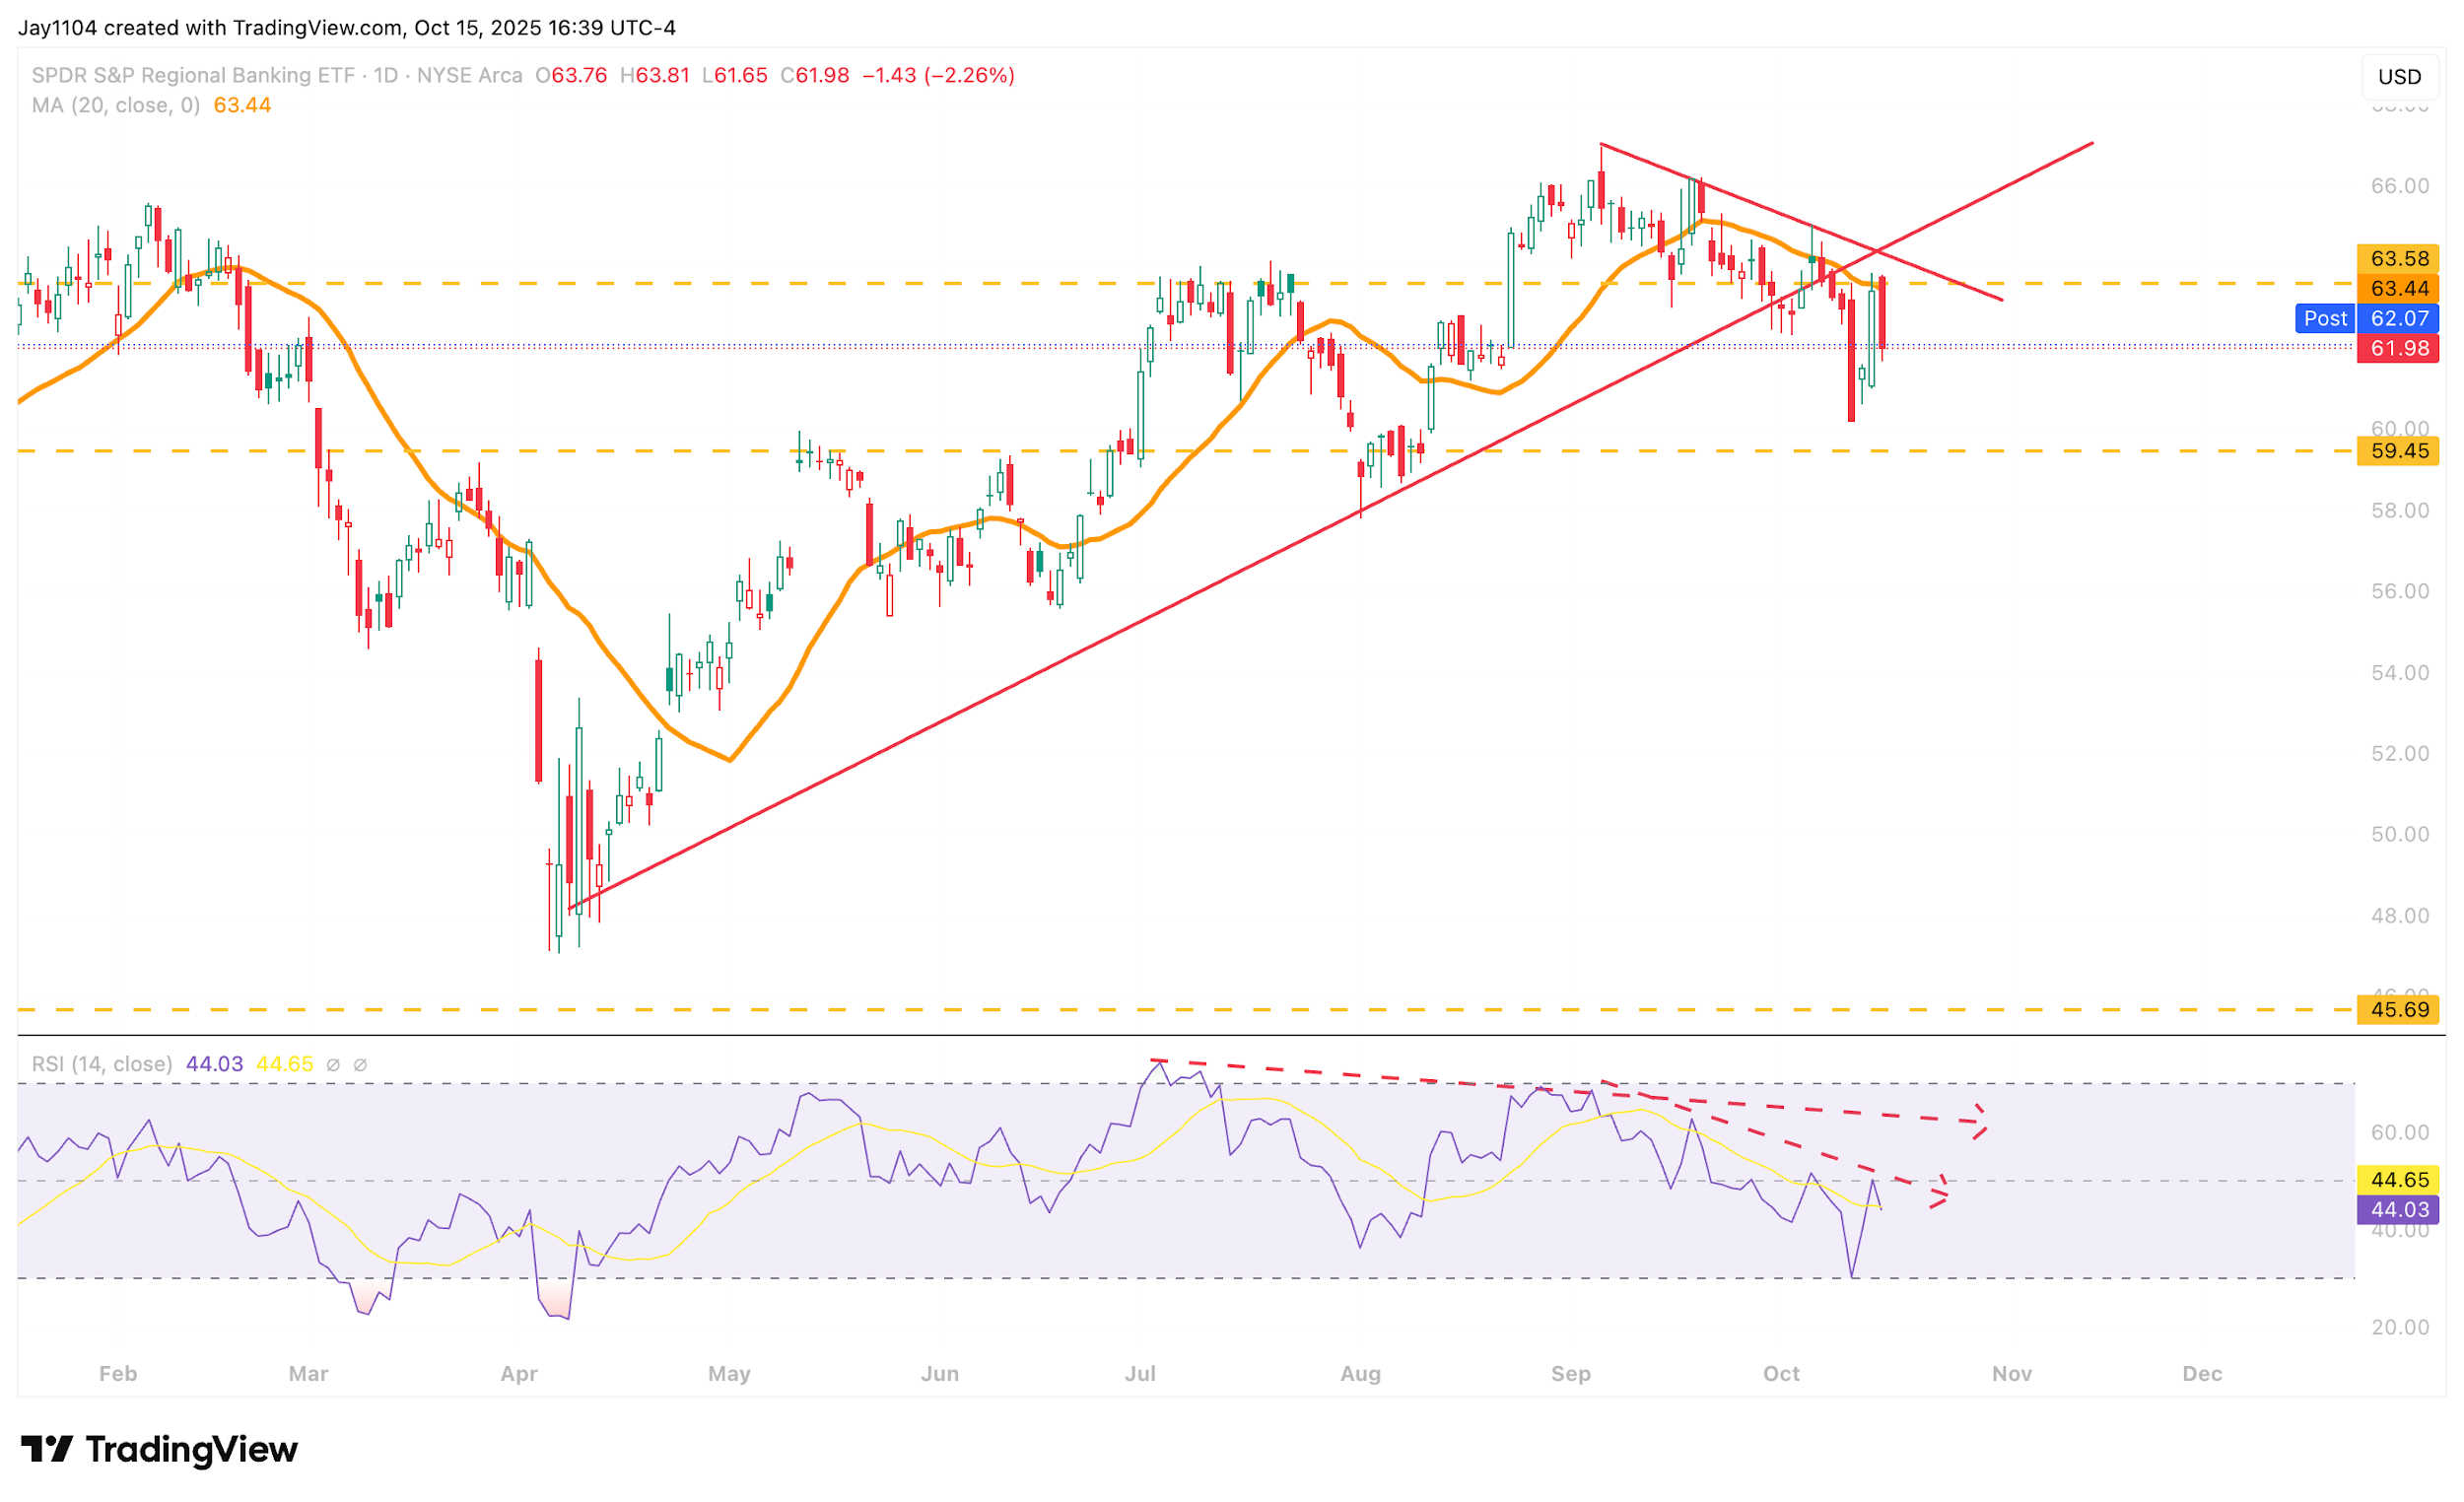
(Source: TradingView)
(Past performance is not a reliable indicator of future results)
Dollar Weakness Continues
The dollar was also weaker on Wednesday for a second consecutive day and now finds itself in a rather precarious position. It’s beginning to show signs of losing momentum against both the euro and the yen, which could be signalling that the recent breakout in the dollar may have been a false move and could ultimately fade.
The euro has started to move higher after bouncing off support around 1.157 and is now approaching a downtrend line near 1.1650. A breakout above 1.1670 could see the euro climb towards 1.1750.
Additionally, the RSI has also started to turn higher, with a potential breakout emerging from the downtrend that had formed there. This suggests that momentum may be improving for the euro, pointing to a more bullish outlook in the near term.
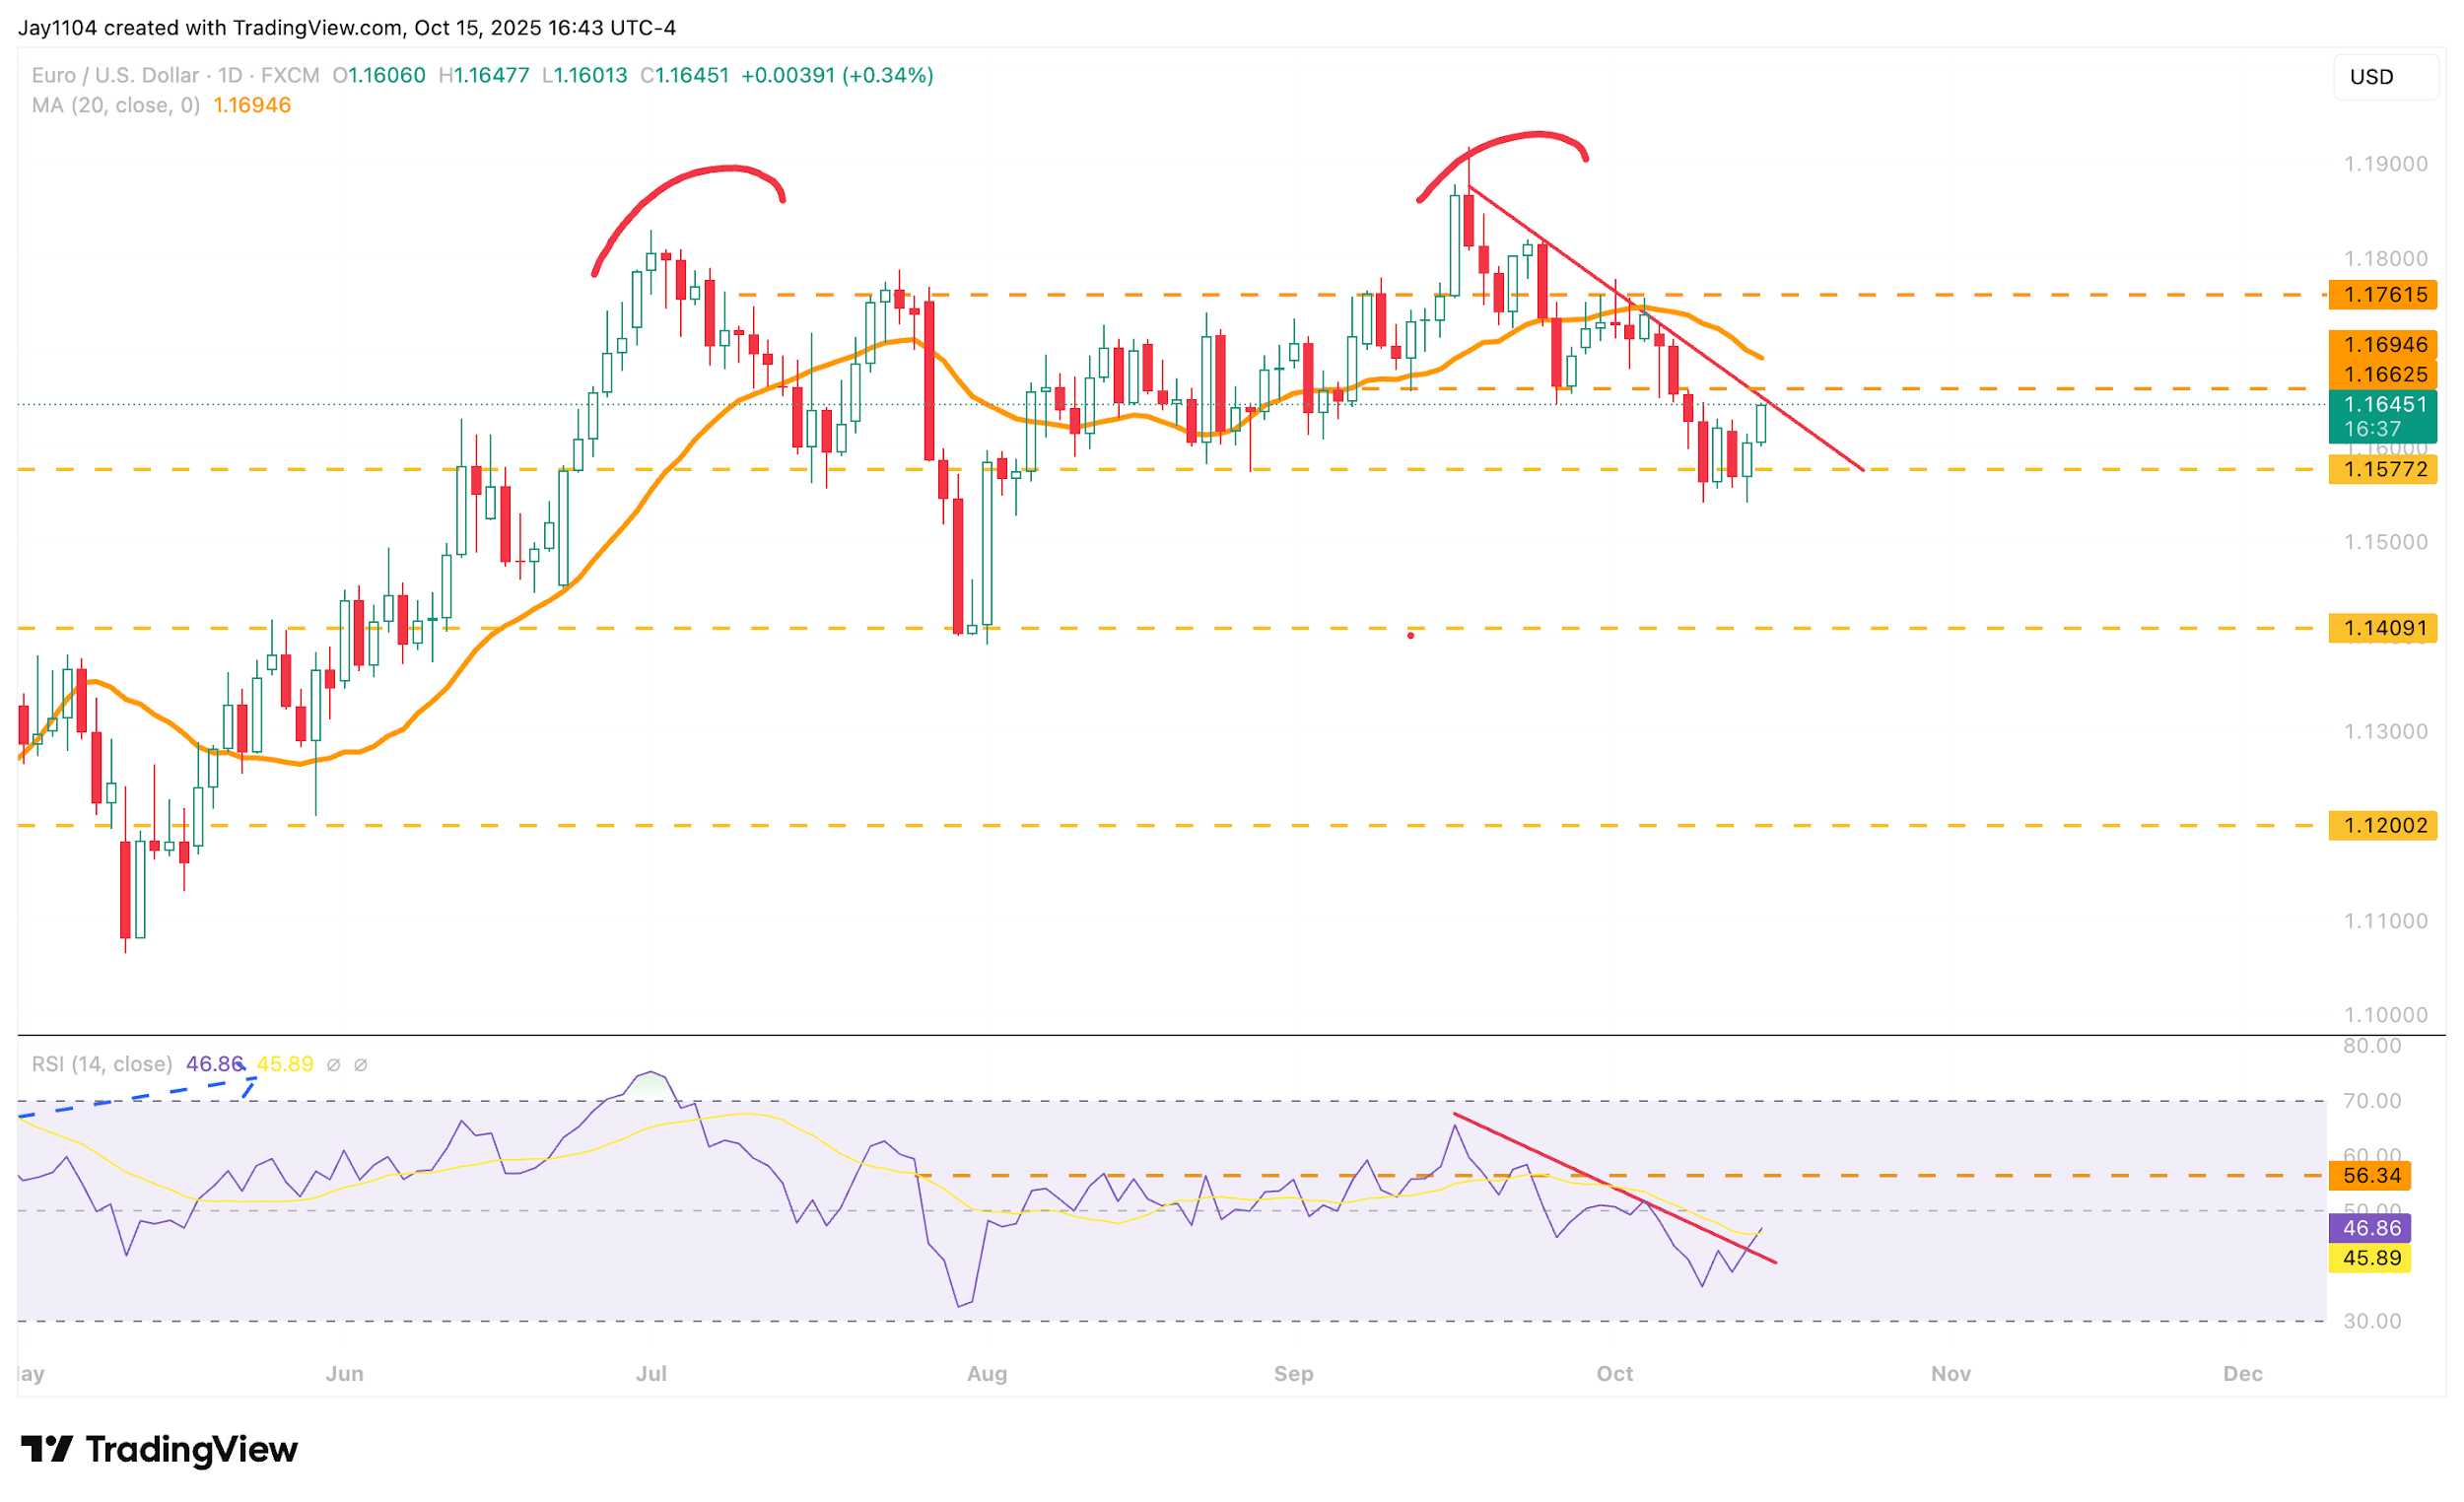
(Source: TradingView)
(Past performance is not a reliable indicator of future results)
The Japanese yen was also stronger today against the U.S. dollar, marking its second consecutive day of gains. The yen is currently sitting on support around 151.15 versus the dollar. A break below this support could open the door for the yen to strengthen further, potentially moving towards 148.20, a level that would roughly fill the gap created on Monday, 6 October, when the yen gapped higher following the election of the new Prime Minister Takaichi.
Additionally, the Relative Strength Index (RSI) has begun to reverse, suggesting that momentum may now be shifting in favour of further yen strength against the dollar.
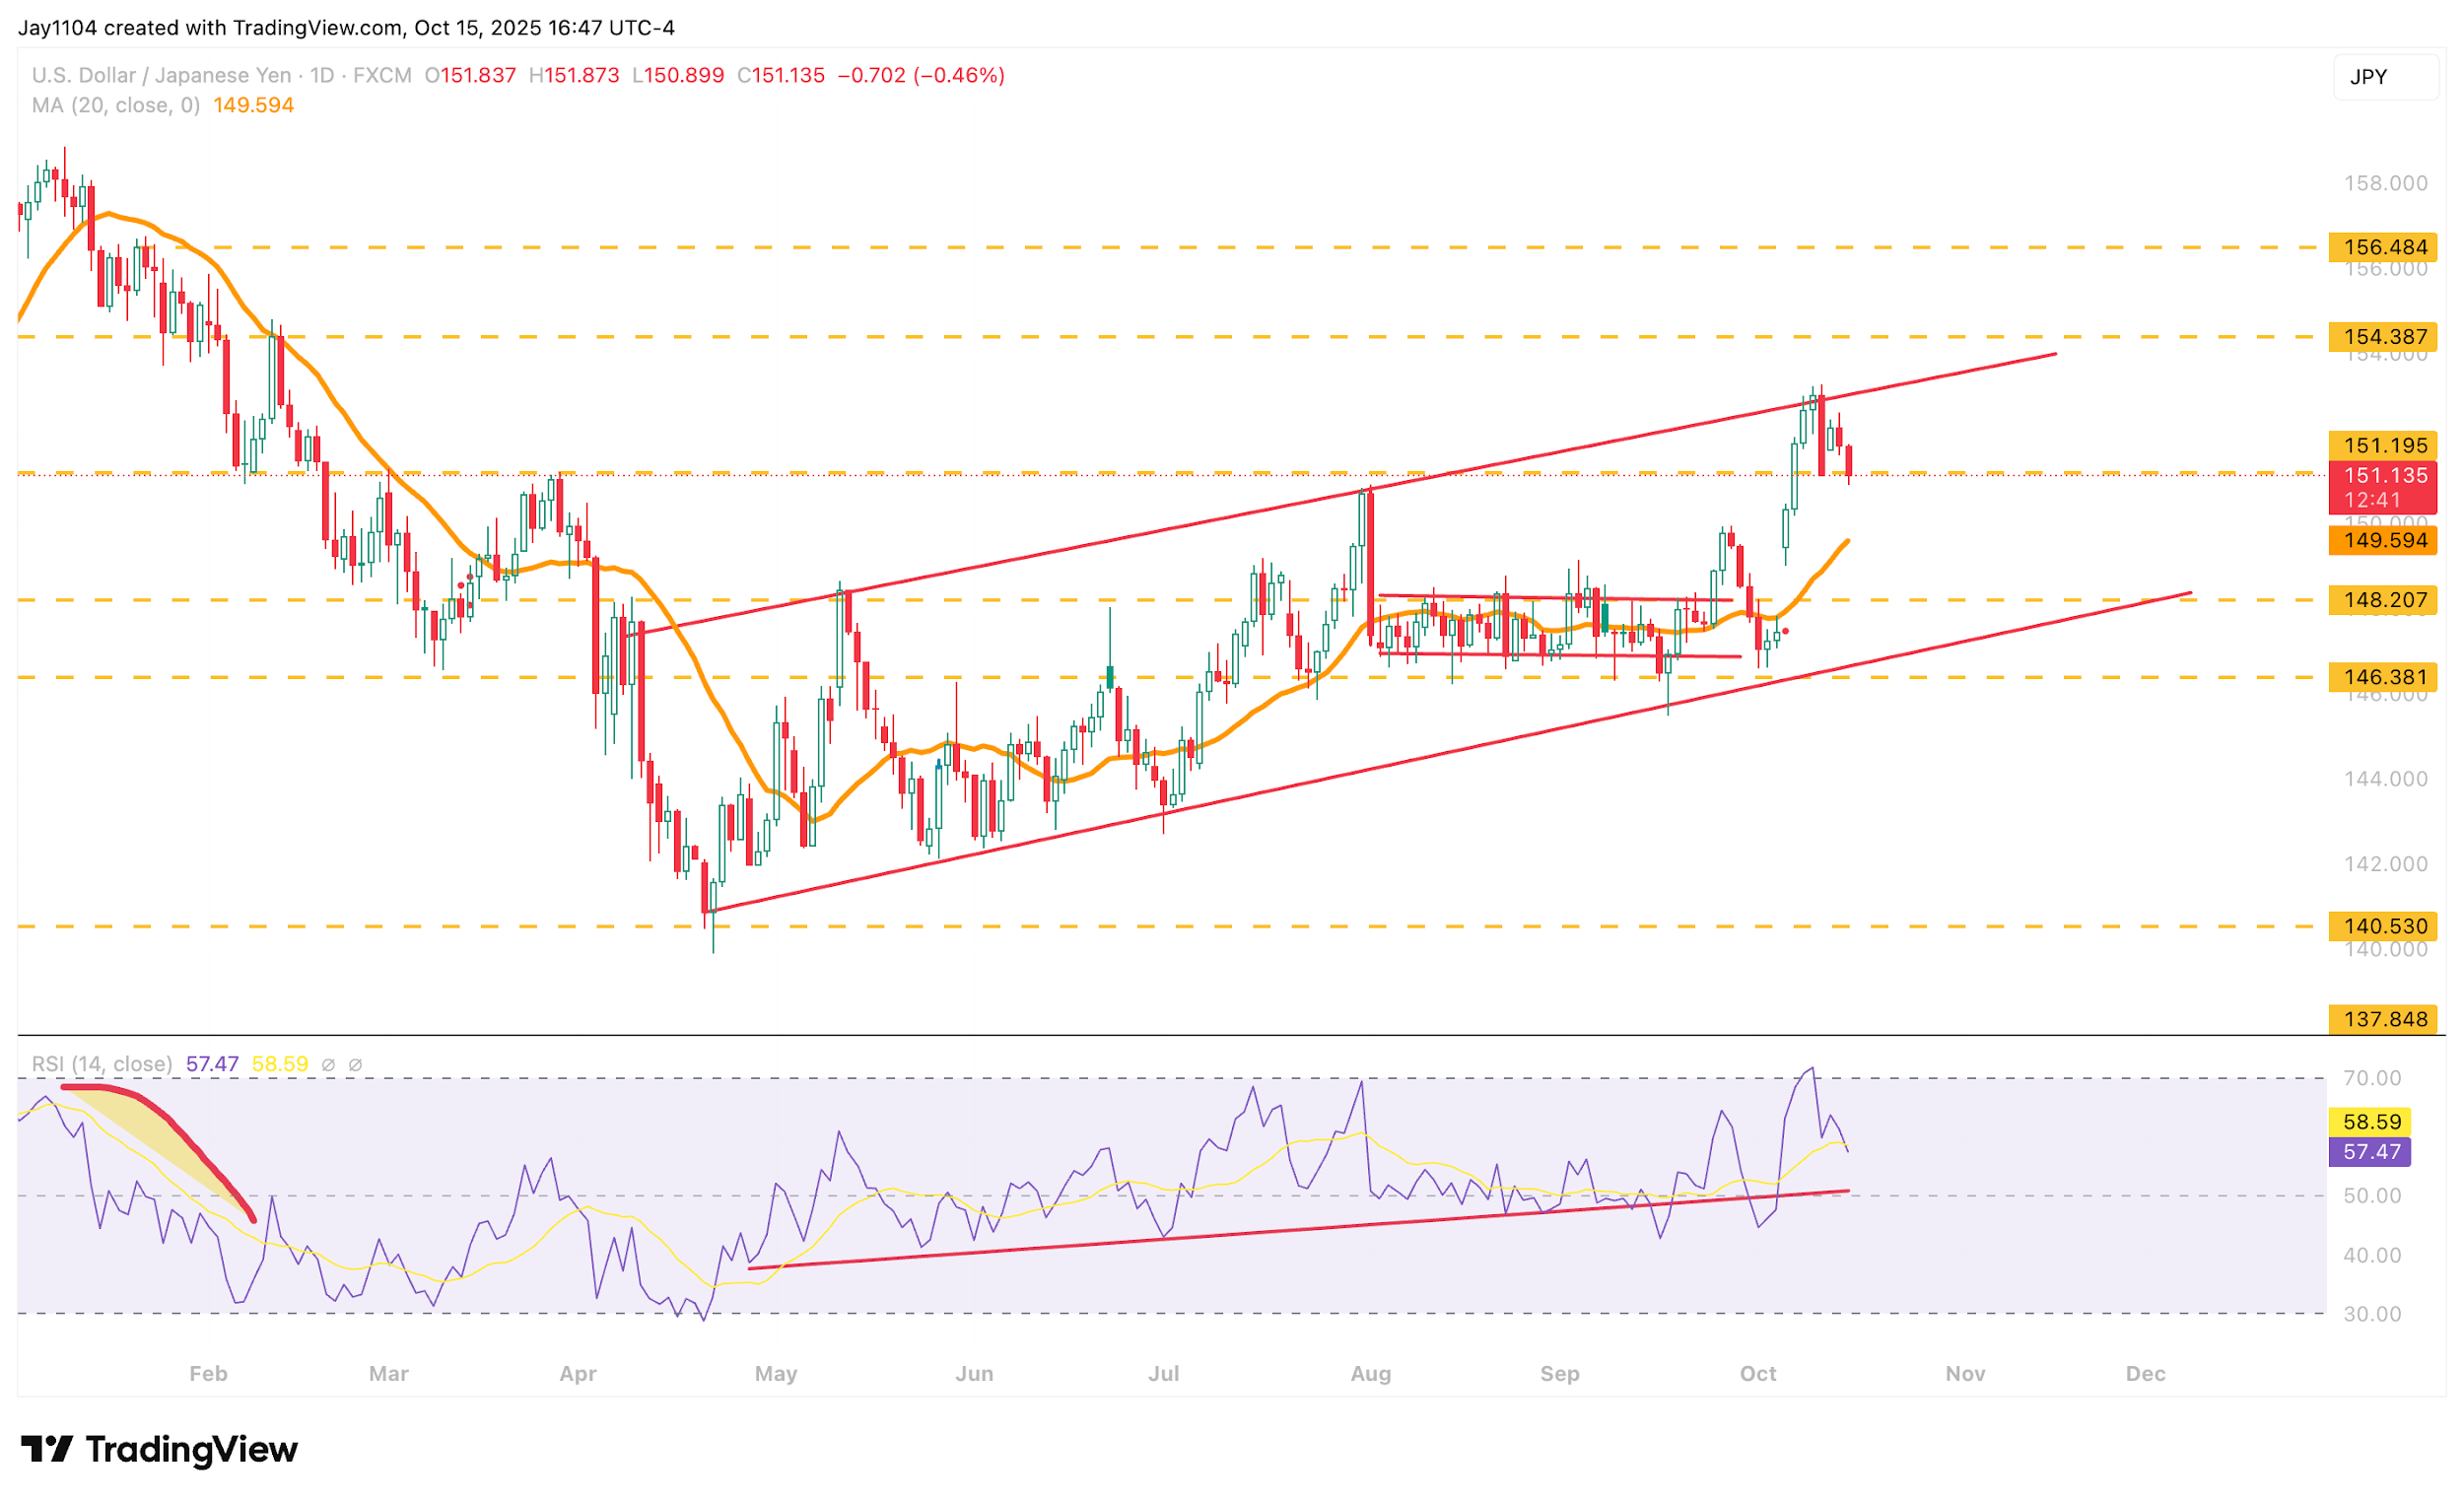
(Source: TradingView)
(Past performance is not a reliable indicator of future results)