Technical Levels Take Focus as Volatility Pressures Build
The S&P 500 fell by approximately 25 basis points on 16 December following a weaker-than-expected US jobs report.
The S&P 500 fell by approximately 25 basis points on 16 December following a weaker-than-expected US jobs report, which showed the unemployment rate rising to 4.6%, above the 4.4% forecast by analysts.

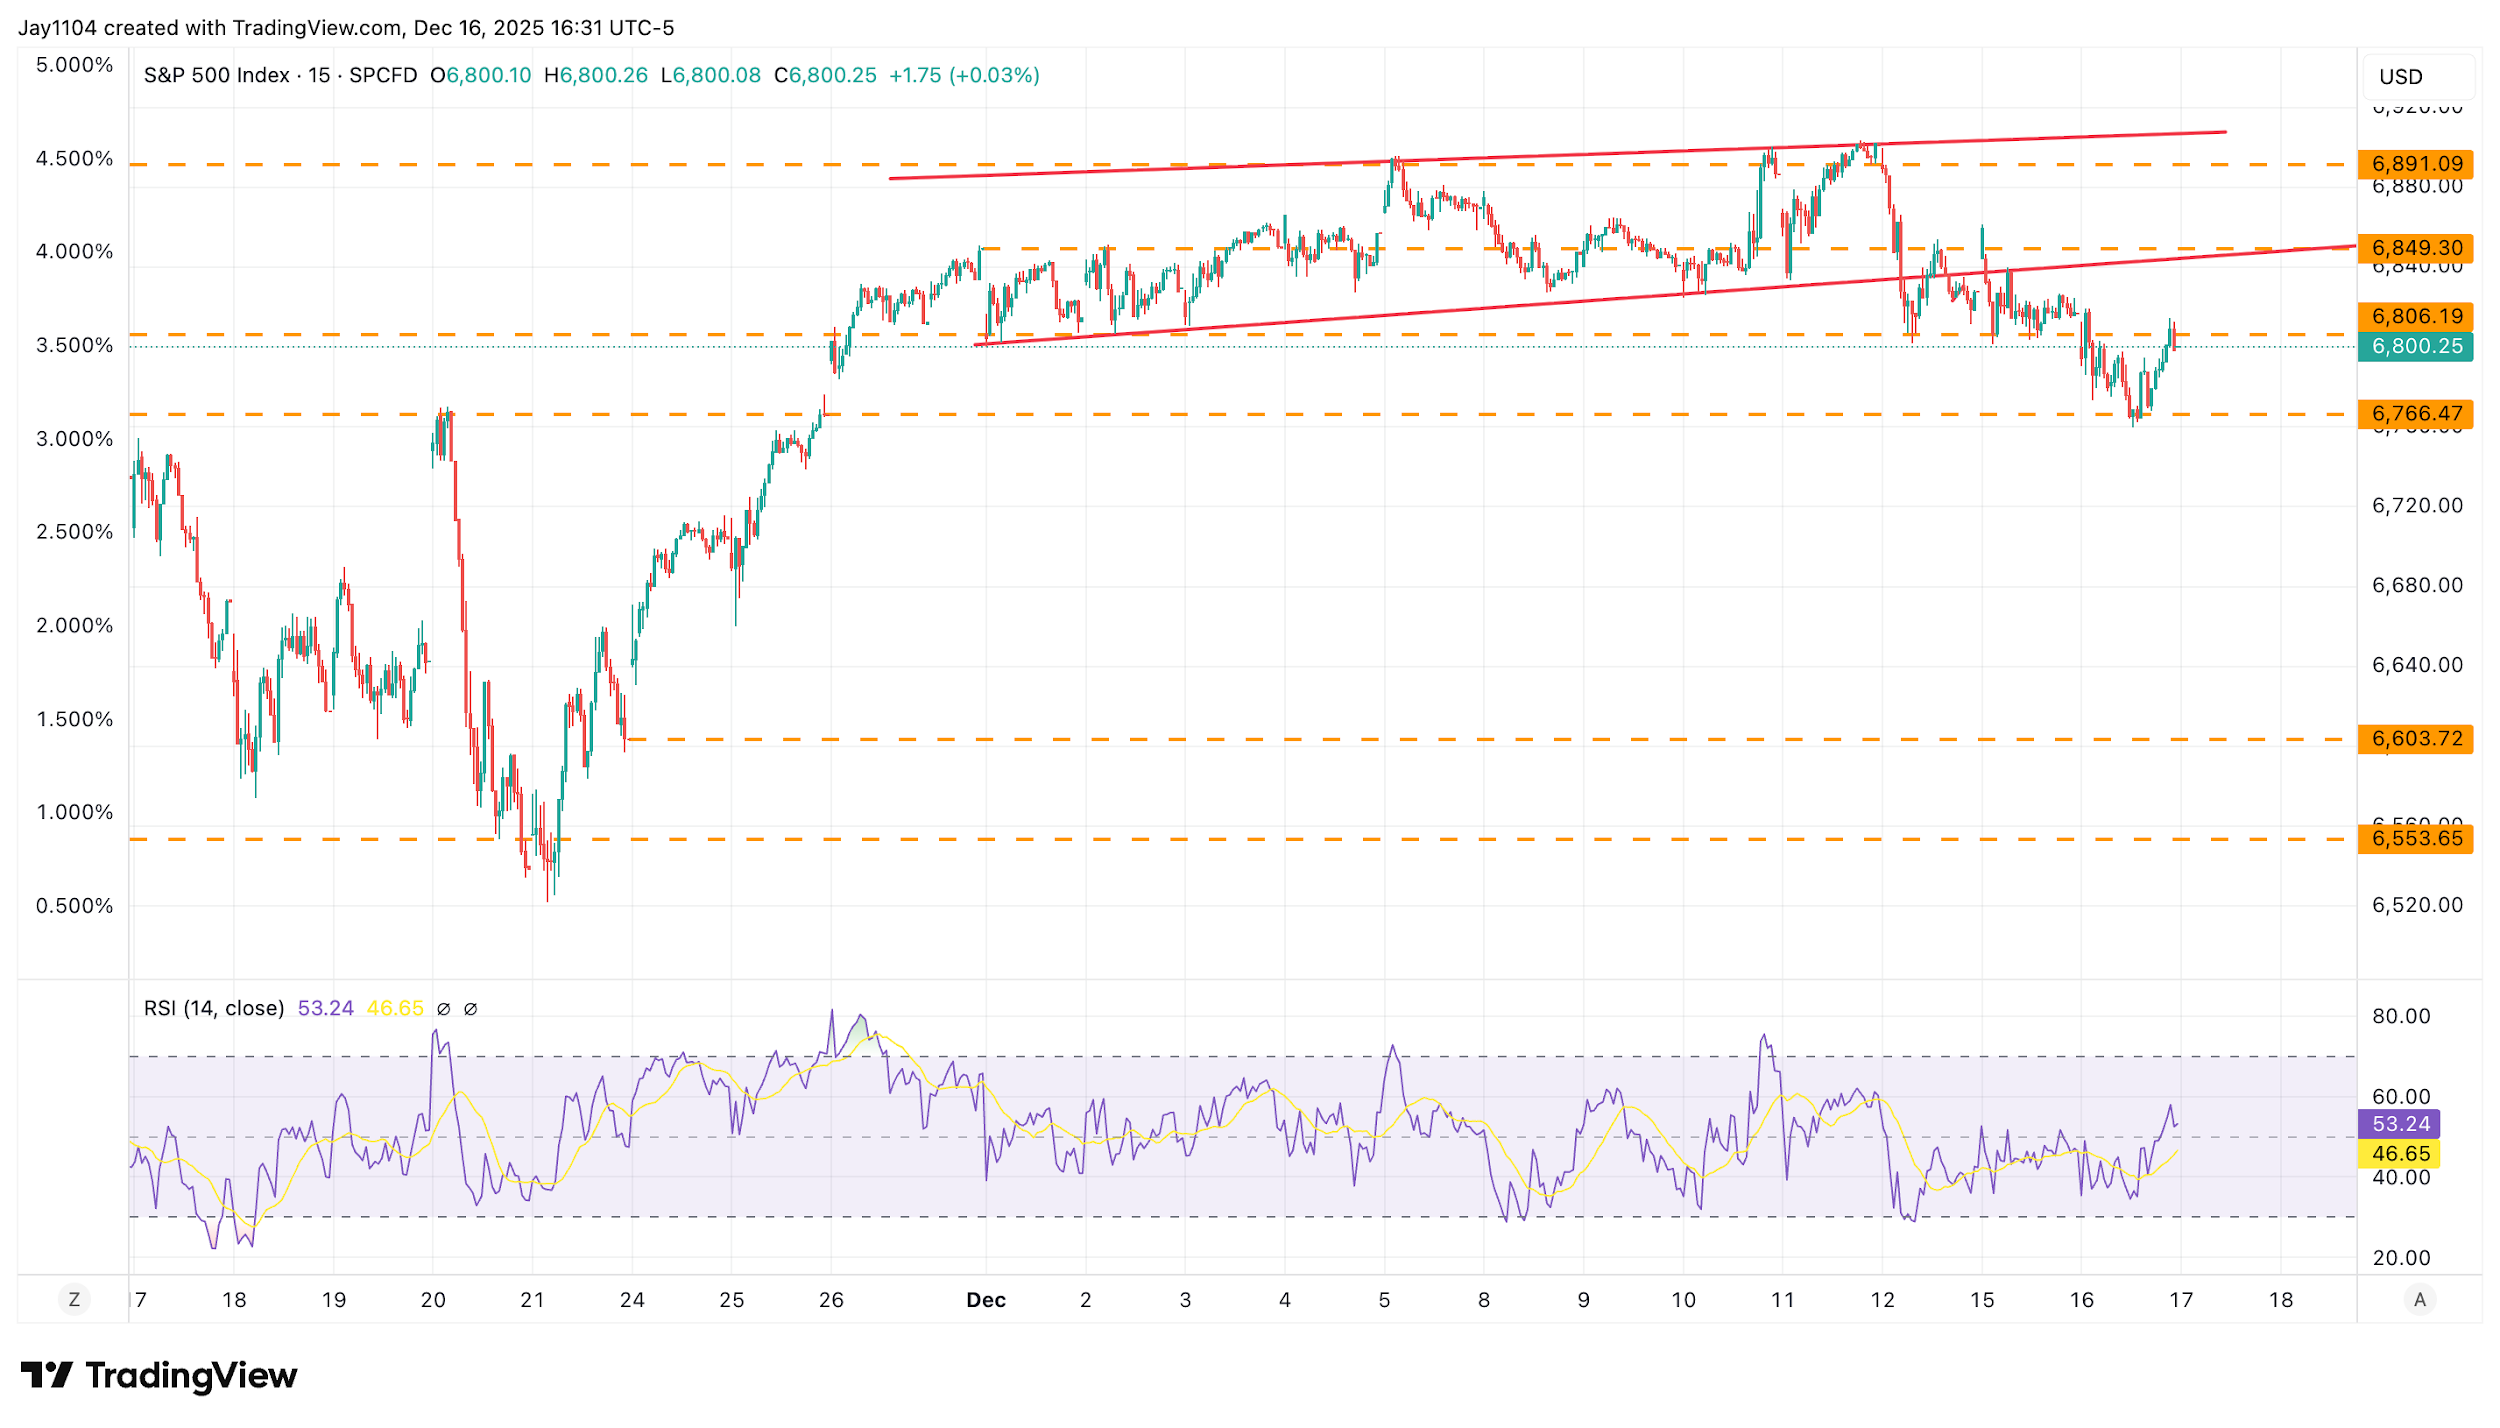
Consequently, the S&P 500 index dropped below the 6,800-level intraday, before returning to that level by the close. It retreated to around 6,760 intraday, closing the gap created on 25 November. [Chart1] Whether the index will continue to decline or if it changes direction will largely depend on options-related flows for the rest of the week, with the December options expiration scheduled for 19 December. However, the VIX option will expire first on the morning of Wednesday, 17 December.
(Source: TradingView)
Past performance is not a reliable indicator of future results.
[Chart1]
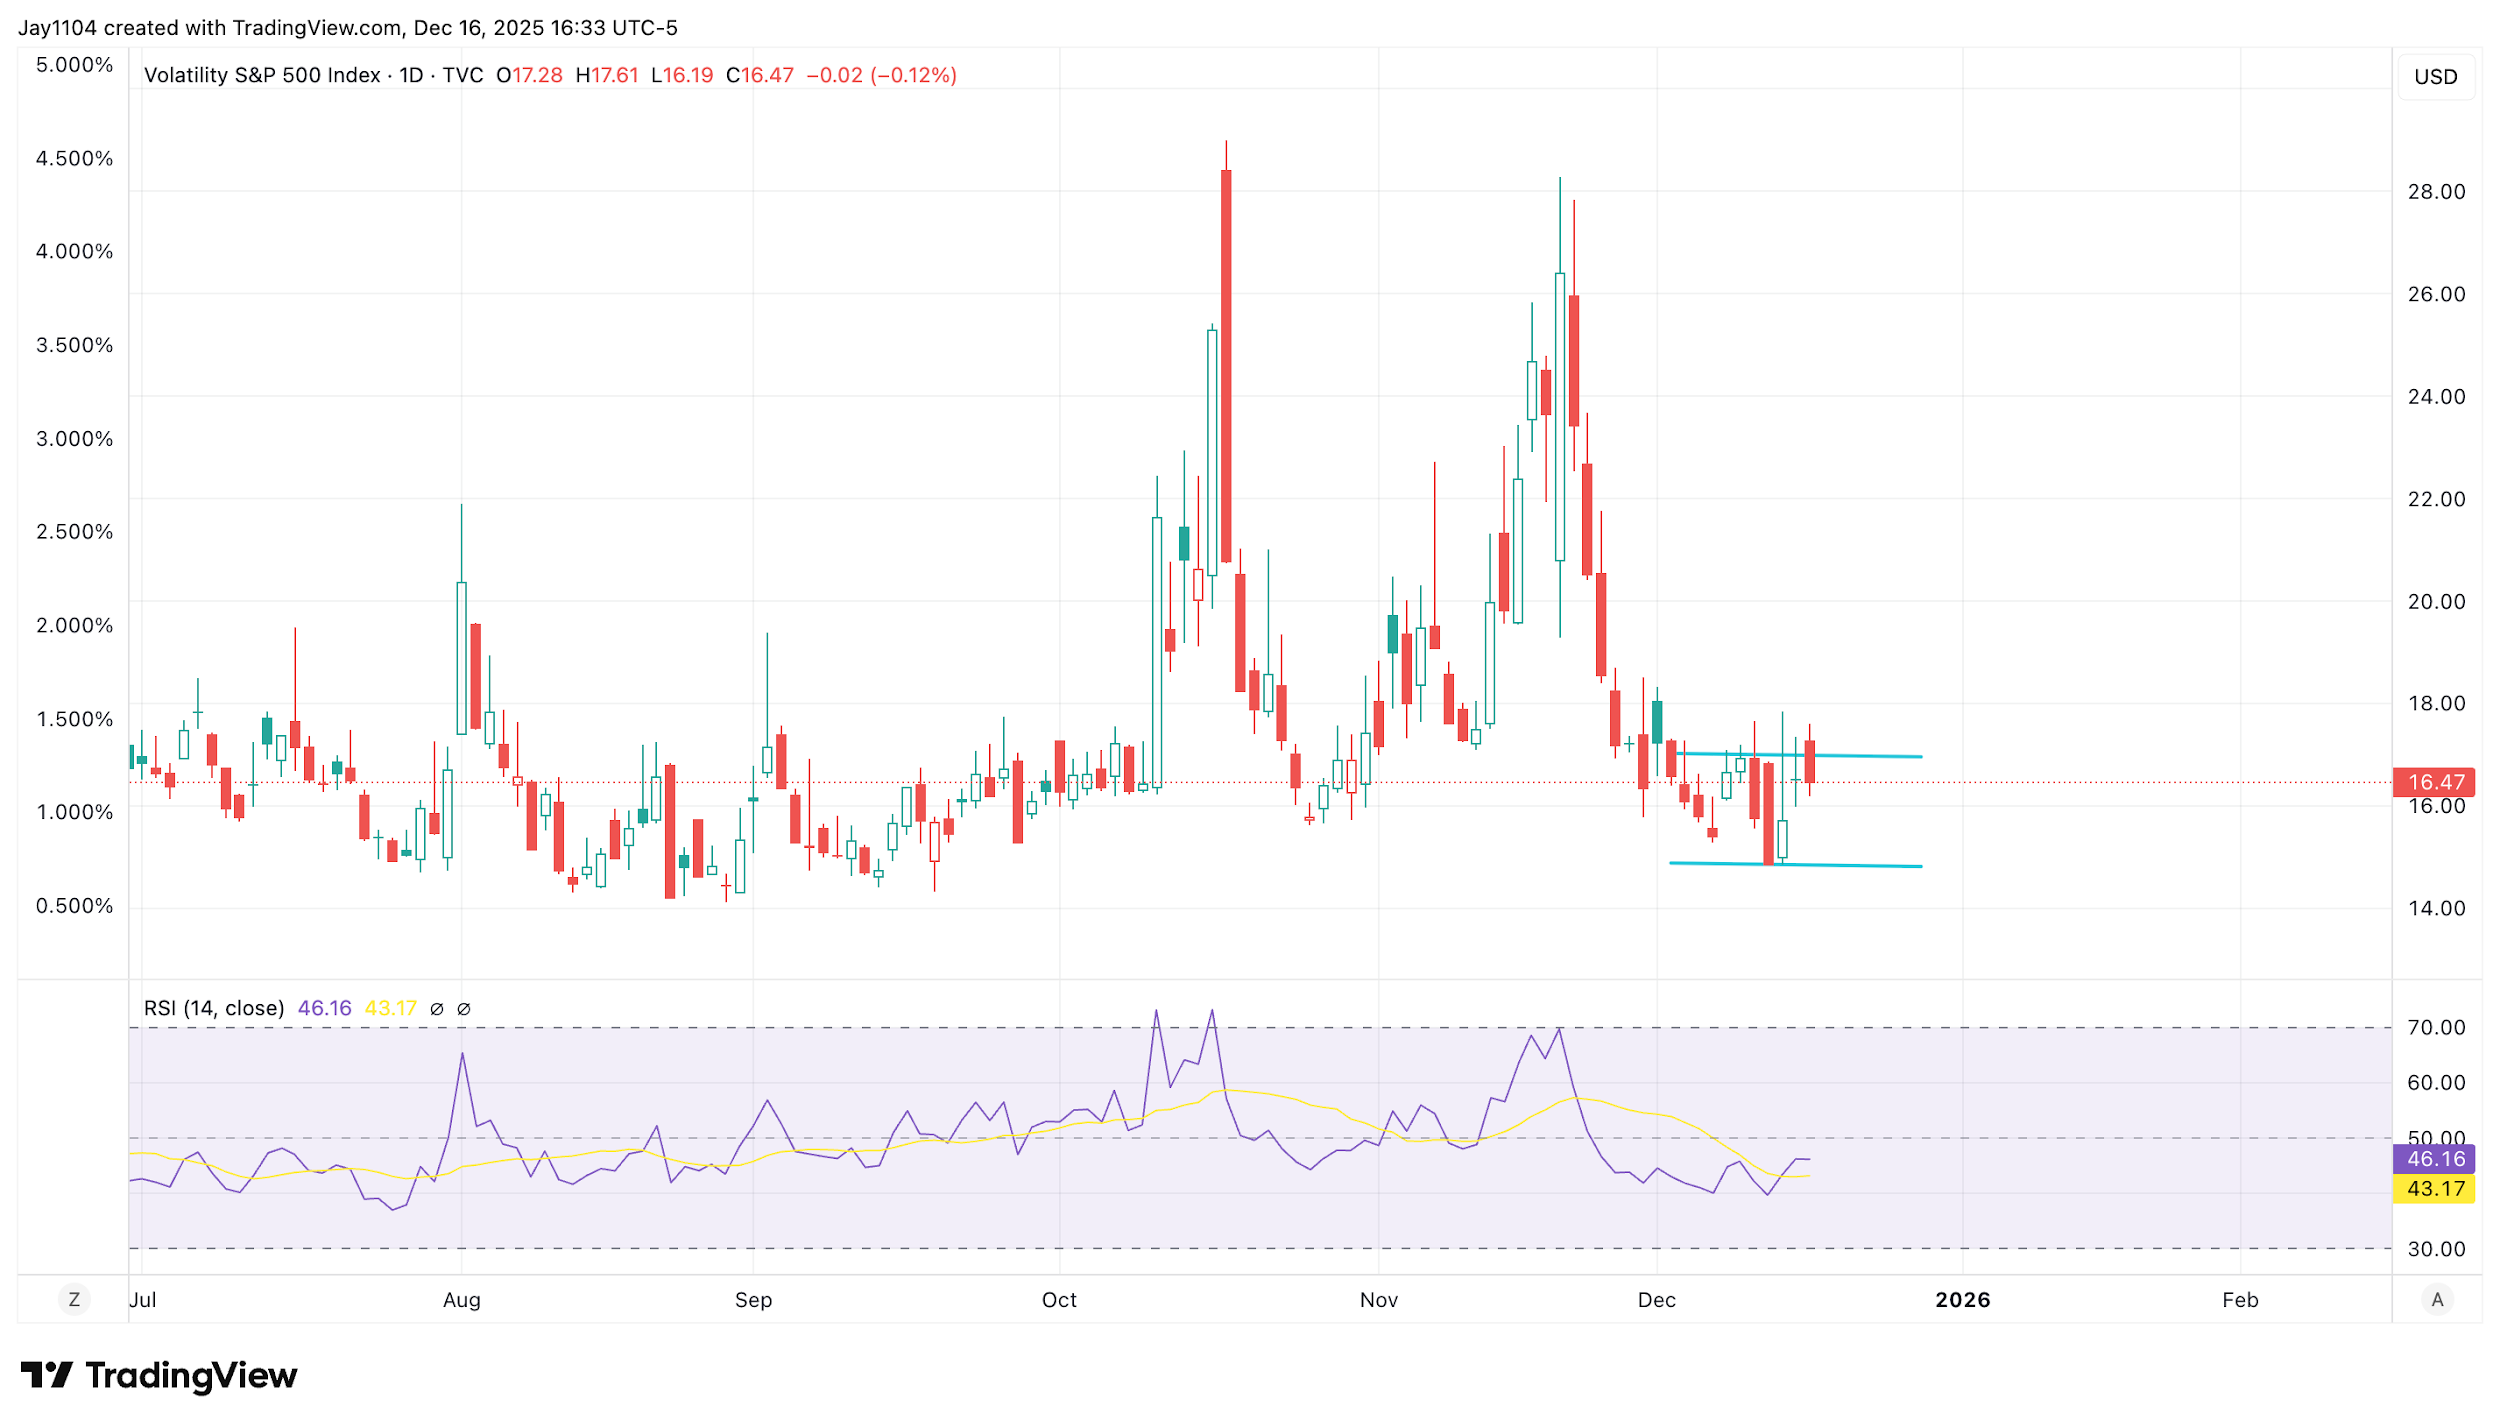
The VIX Index has mainly stayed within a trading range of 15 to 17 since 2 December. [Chart2] Once VIX options expire on Wednesday morning, volatility could start to increase, as the VIX will no longer be influenced by the option-related flows that usually happen around expiry. As those flows are likely to lessen after Wednesday morning, the VIX could begin to reflect broader market dynamics more freely, which may result in movement outside its recent range – though this will depend on market conditions and sentiment.
(Source: TradingView)
Past performance is not a reliable indicator of future results.
[Chart2]
Additionally, as the week progresses, a significant flow of news is expected to influence the market. With a US CPI report scheduled for Thursday, 18 December, alongside rate decisions from the Bank of England and the European Central Bank, and the Bank of Japan's rate decision beginning on Thursday, these events are likely to introduce some risk. As a result, volatility may increase as we near the end of the week, which will be the final full trading week of 2025. If volatility does pick up, it could add pressure to the S&P 500 and broader equity markets. Initial support for the index appears around 6,750, with further levels near 6,675. Resistance remains in focus around the 6,890–6,900 area, but as always, much will depend on how markets react to the data and policy decisions.
A Stronger JPY May Lie Ahead
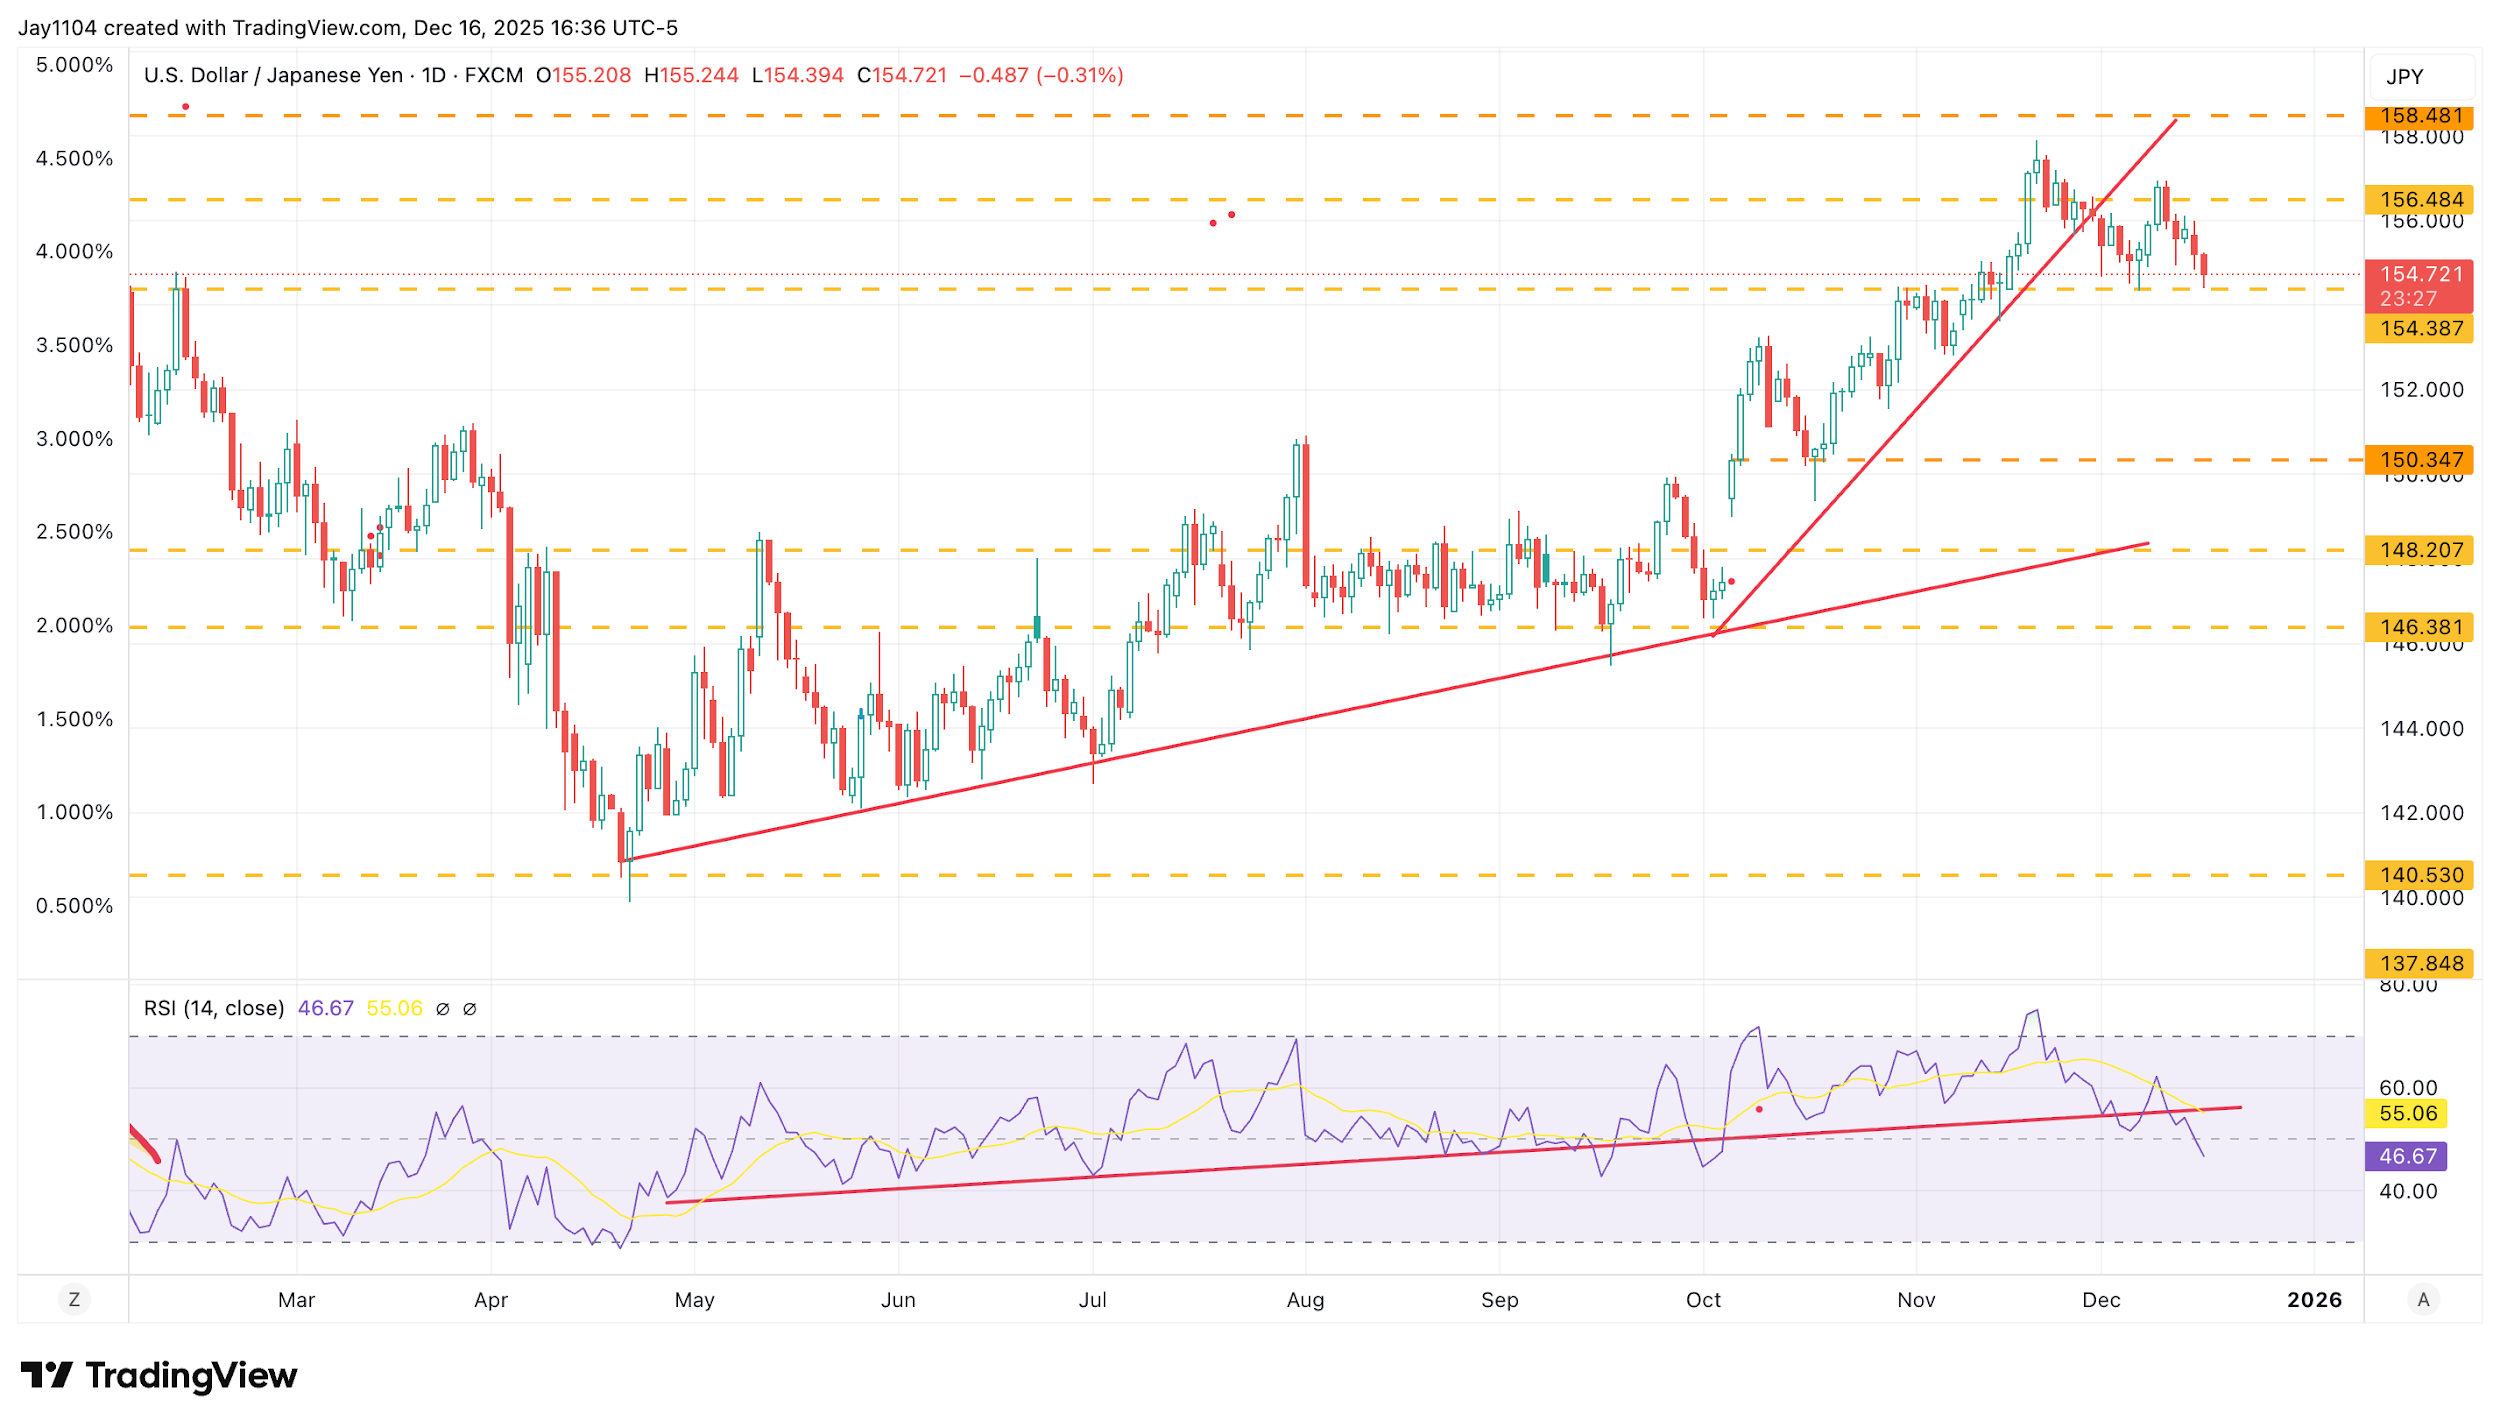
The Japanese yen strengthened after the weaker-than-expected US jobs report on 16 December and is now supported at around 154.75. A break below this level would bring a potential double-top formation into focus. If confirmed, this could signal further yen strength in the near term, with the next technical area of interest around 152.90 – though any move would ultimately depend on broader market conditions and follow-through momentum.
More significantly, the yen has established a longer-term bump-and-run technical pattern that may have started as early as April 2025. This is most clearly indicated by the shift in the trendline around October. [Chart3]
(Source: TradingView)
Past performance is not a reliable indicator of future results.
[Chart3]
Of course, for the technical chart to unfold properly, the BOJ will need to follow through on expectations that they will raise rates at its policy meeting on Friday, 19 December, reaching a 30-year high. Perhaps more importantly, it will be what the BOJ signals for the future and an indication that more rate hikes are to come.
Oil Continues to Drop
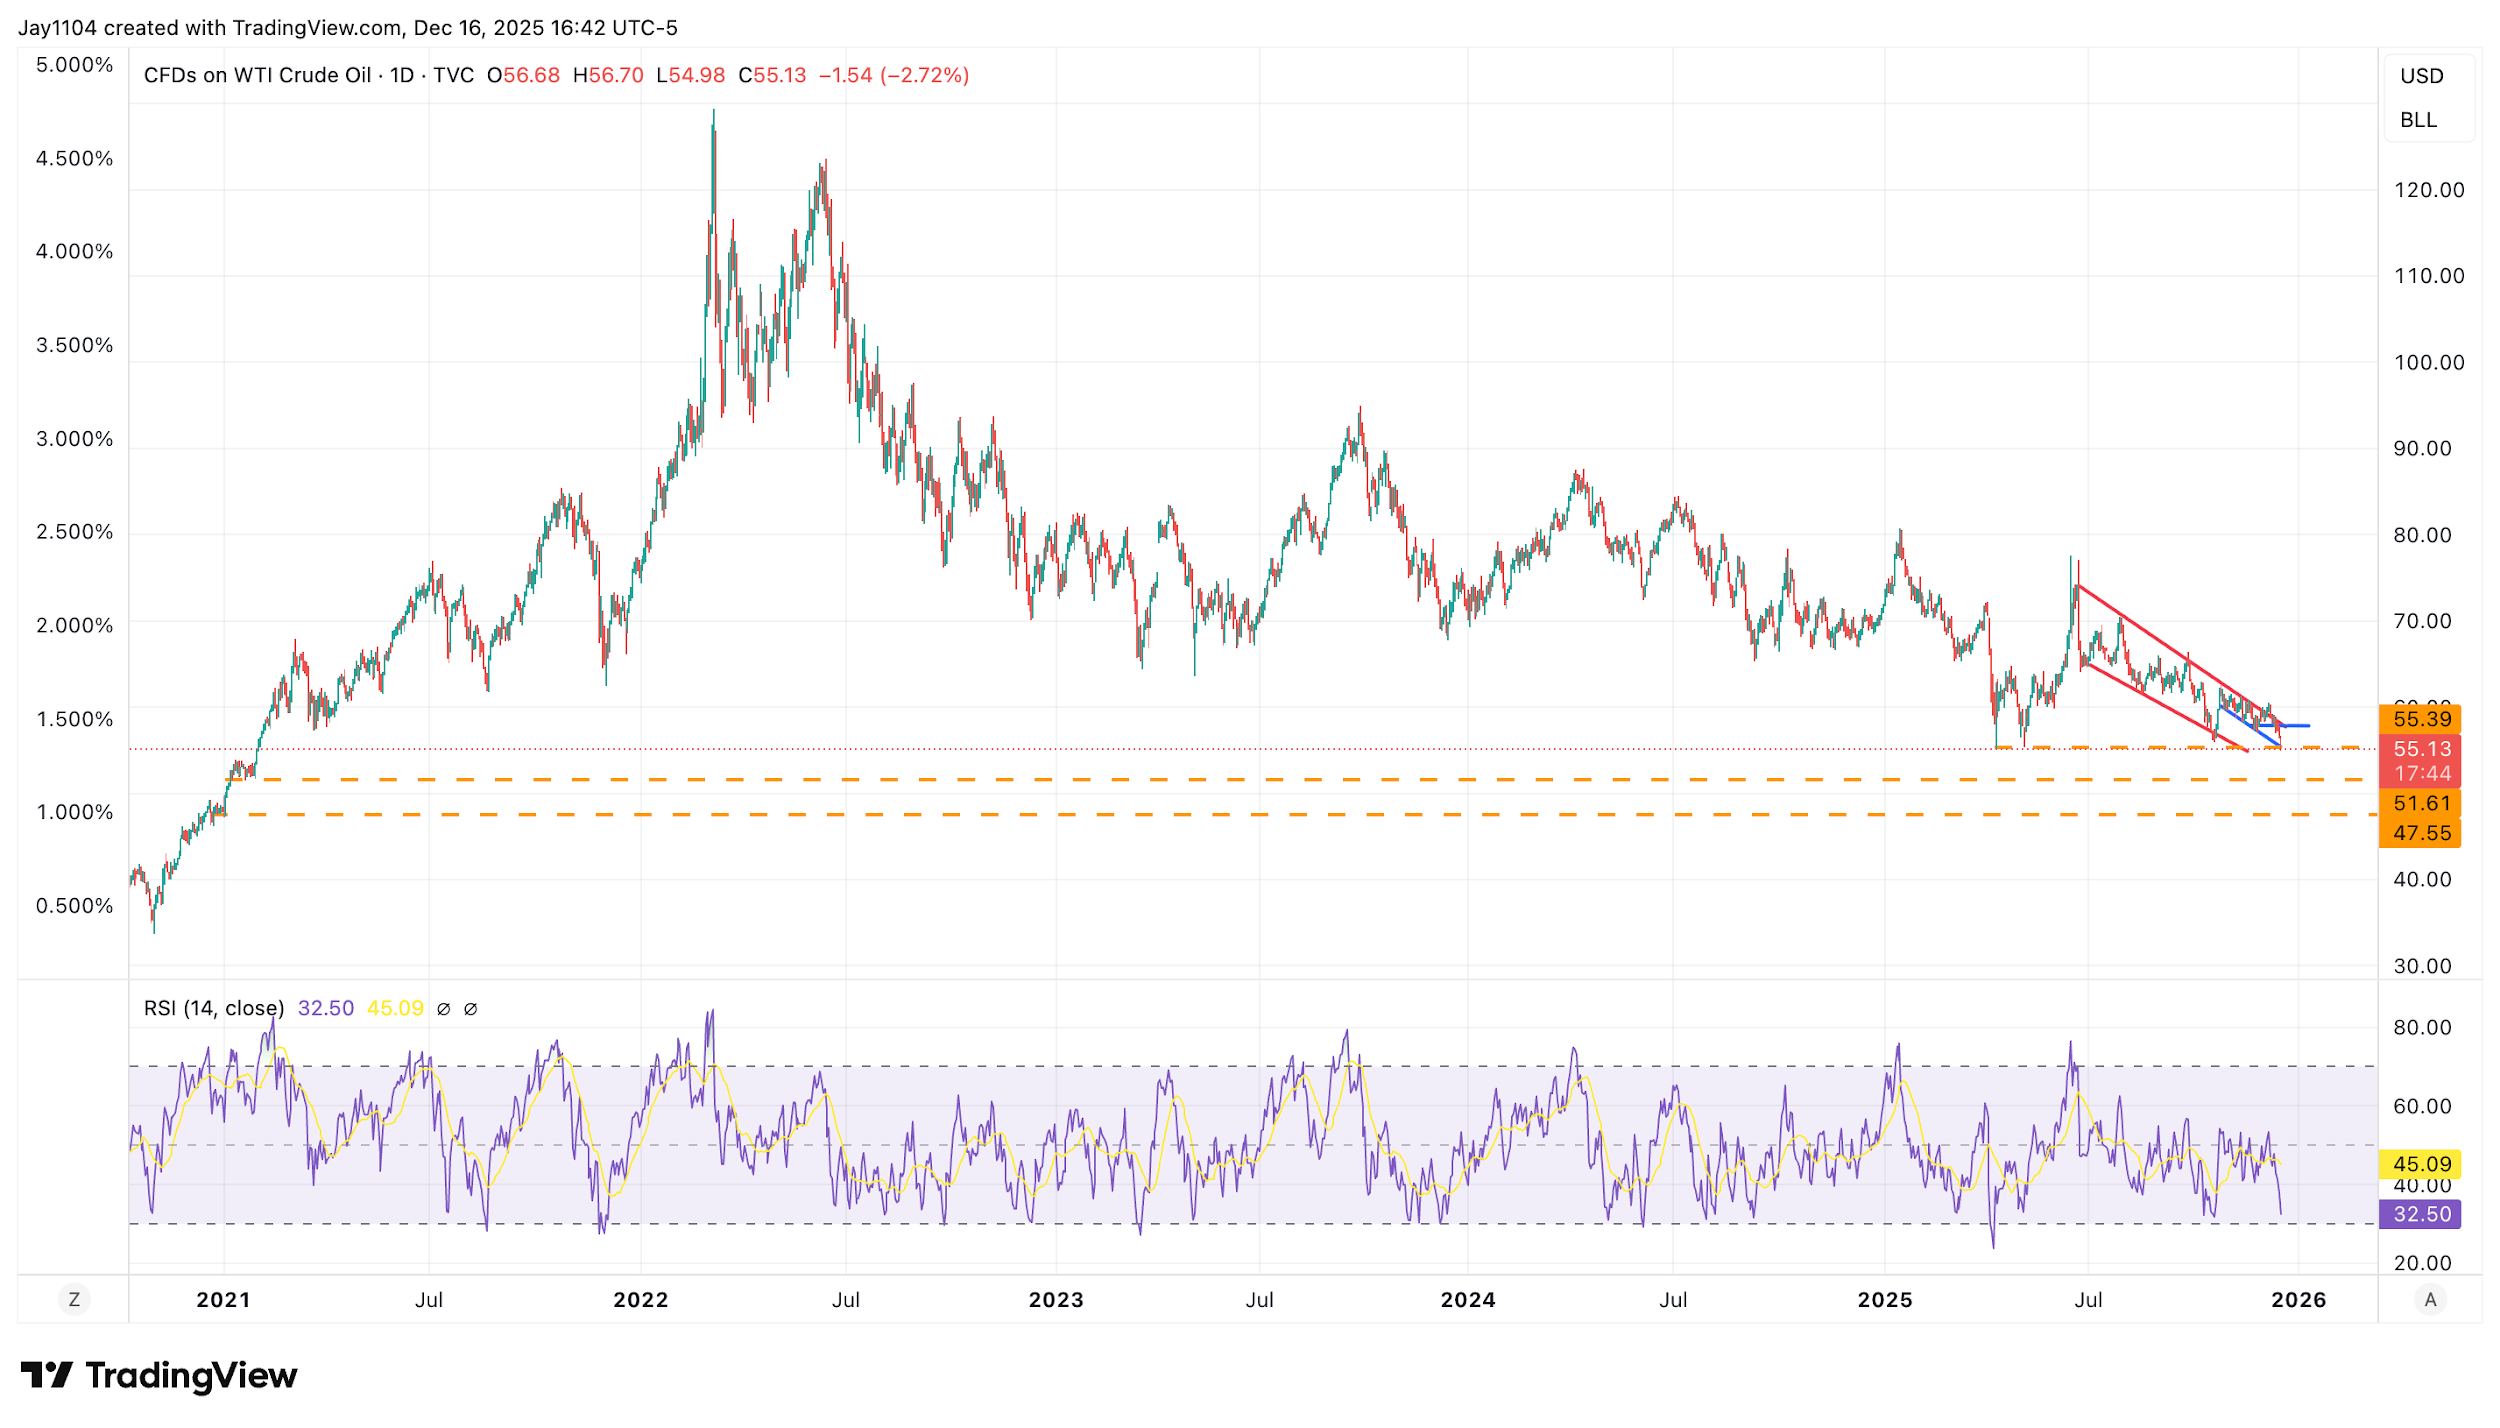
Despite a weaker US dollar on the day, oil prices fell by about 2%, breaking below the key support level at $57.75. This level had been an important support zone, and its failure confirms a failed breakout attempt from earlier in December. Oil is now near support at $55.50, and a sustained move below this level would be a notable negative development, especially since prices have already tested this area multiple times.
Based on the technical chart, such a move could lead to a drop to the mid-$40s per barrel, marking the lowest levels since late 2020 and early 2021. This outcome would not only be bearish for oil prices but also indicate broader concerns about the global economy and pose a significant negative for oil producers who rely on higher oil prices to remain profitable. [Chart4]
1 Source
(Source: TradingView)
Past performance is not a reliable indicator of future results.
[Chart4]