Treasury Curve Steepens as 30-Year Yield Approaches Key Breakout Ahead of PCE Inflation Report
The S&P 500 rose by about 11 basis points on Thursday, 4 December.
This came ahead of the September PCE report, which is due on the morning of 5 December. Analysts estimate the September core PCE rose by 0.2% month-on-month, in line with the August figure. Core PCE year-on-year is expected to increase by 2.9%, unchanged from the prior month. Headline PCE is forecast to rise by 0.3%, also matching the August reading, with the year-on-year rate expected to climb to 2.8%, up from 2.7% in August.

Ordinarily, this is a reasonably significant inflation report, particularly before a Fed meeting. However, as the data is now almost two months old, the market reaction is likely to be limited unless something within the release stands out as genuinely unexpected, especially to the upside. That would be one of the few developments capable of challenging expectations for a Fed rate cut at the meeting on 10 December.
Implied Volatility Is Low
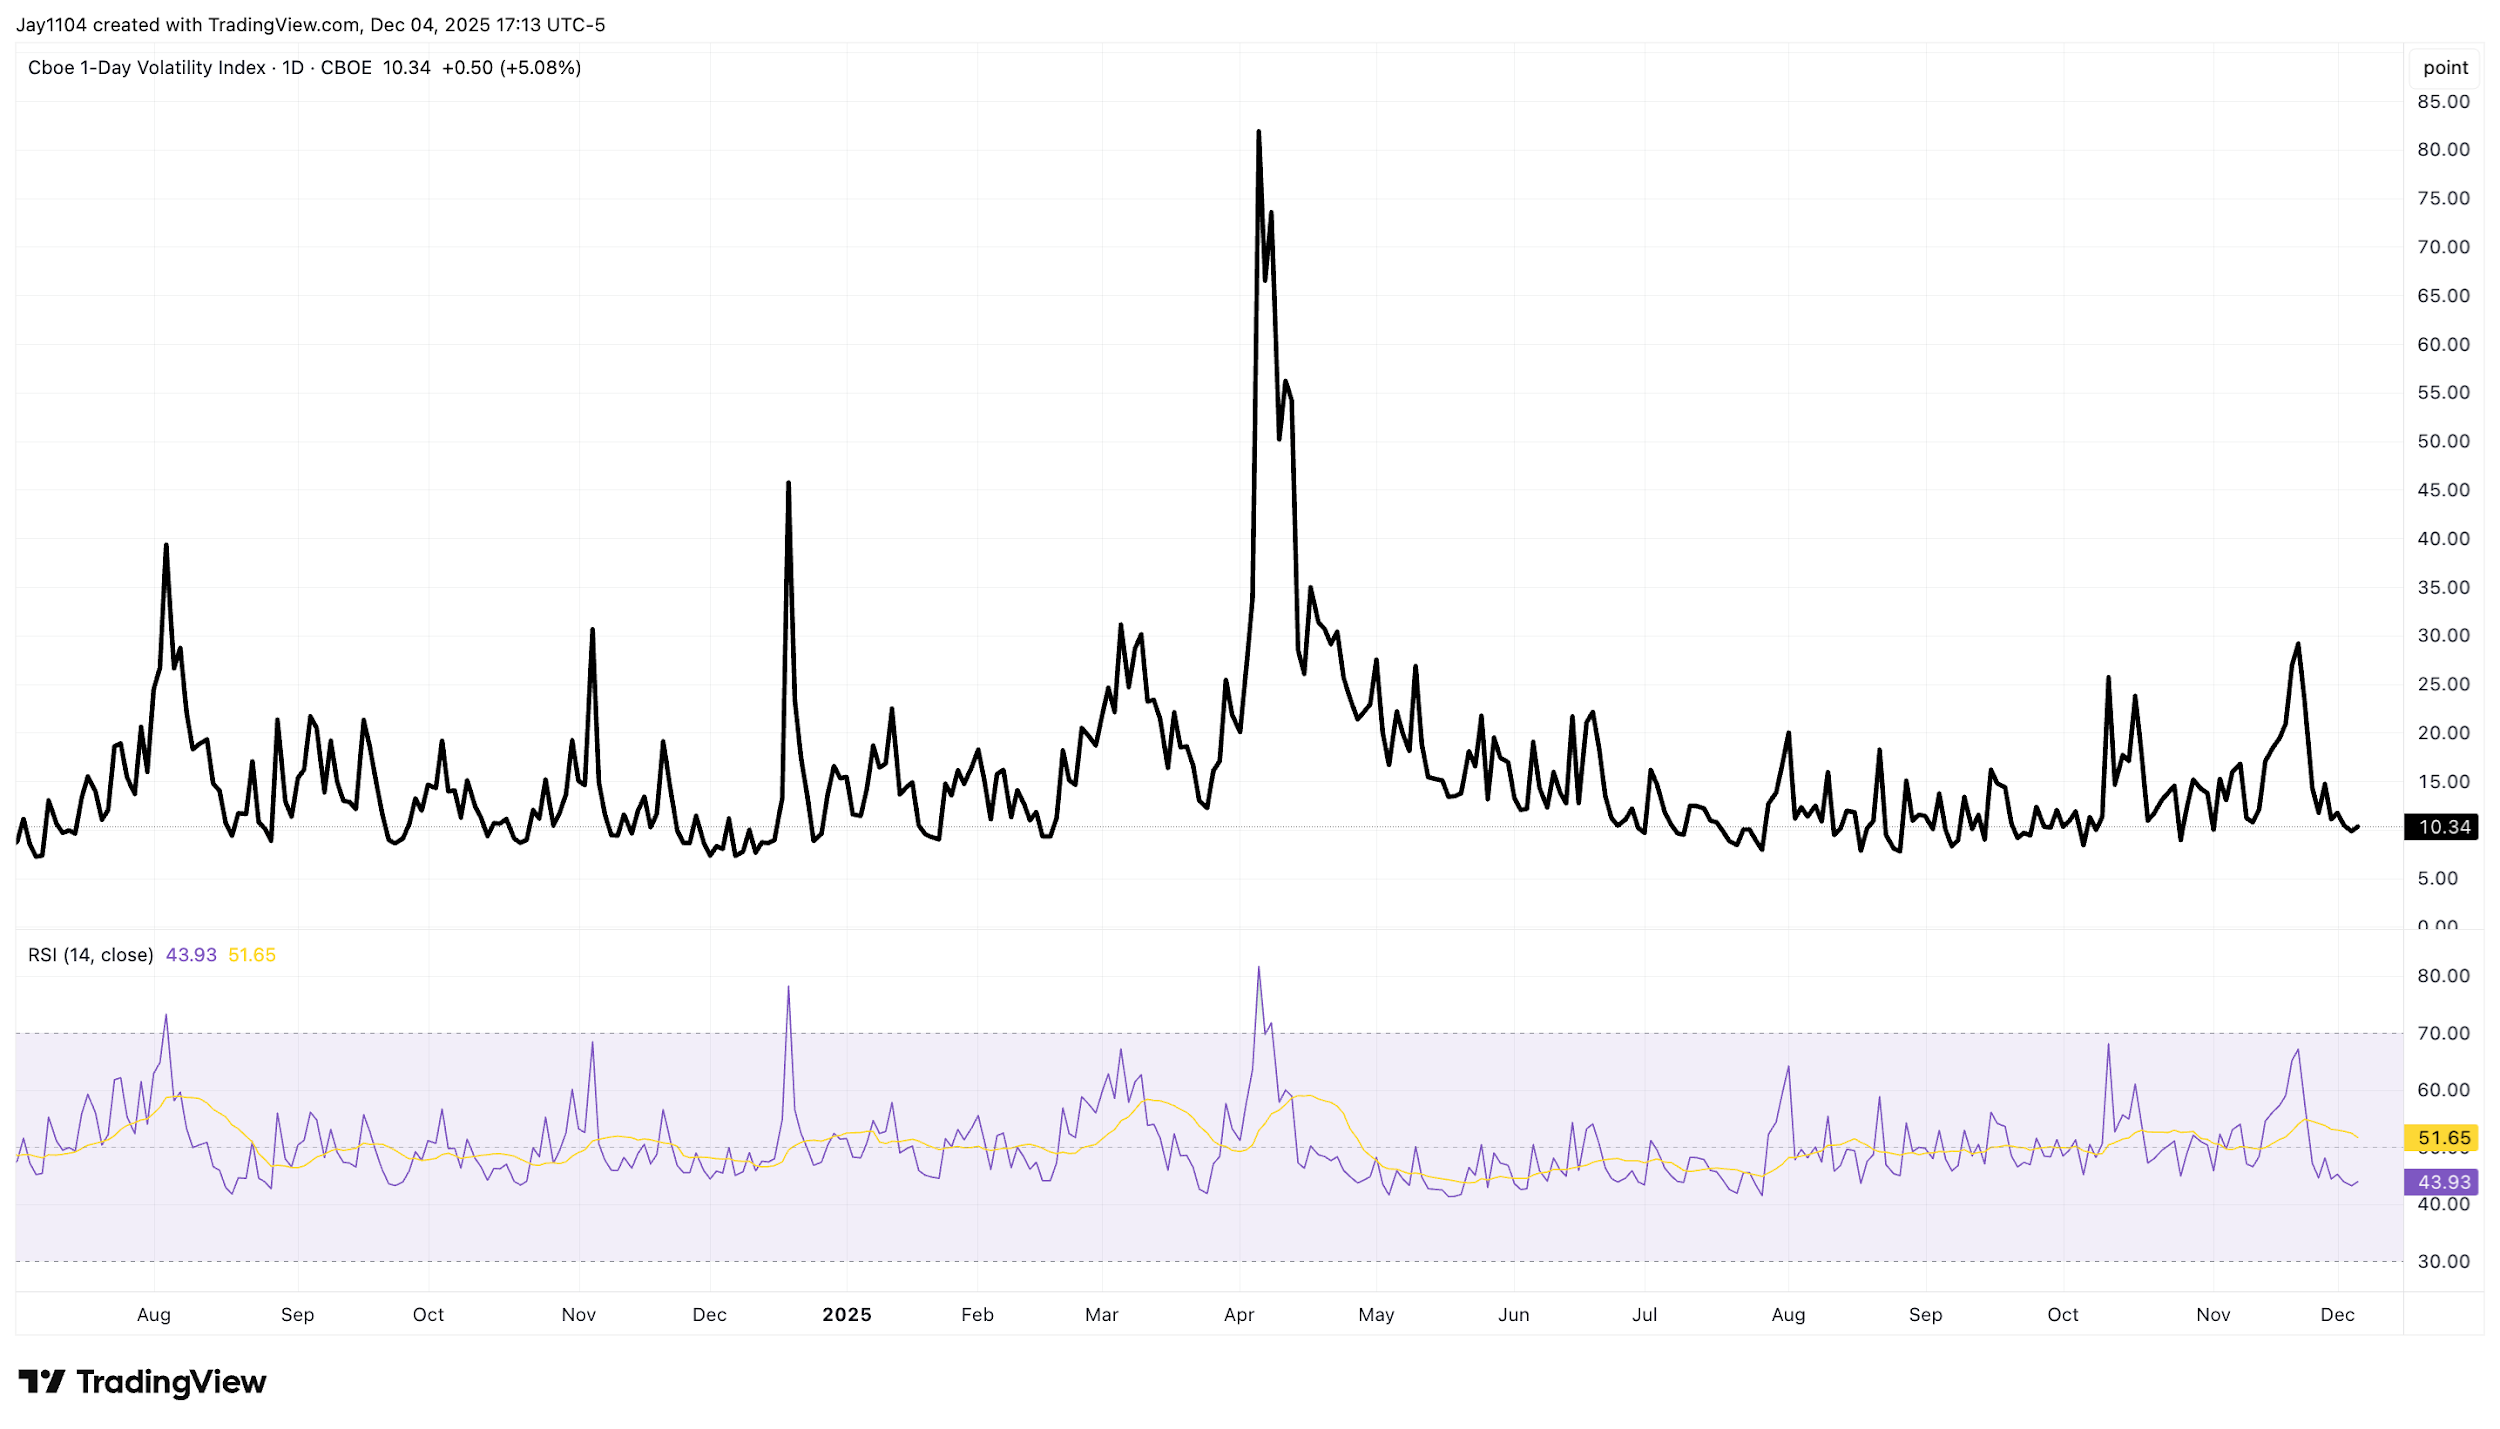
On the surface, the equity market does not appear particularly concerned about the PCE report. The VIX 1-Day — which reflects the market’s pricing of one-day-ahead implied volatility — edged up only slightly to around 10.4, a level that sits near the bottom of its usual range and signals very little near-term anxiety. [CHART1] Given this, it would be surprising to see a significant market reaction following the PCE release tomorrow. The only development likely to catch the market off guard would be a hotter-than-expected reading, which could reduce the perceived odds of a Fed rate cut.
(Source: TradingView)
Past performance is not a reliable indicator of future results.
[CHART1]
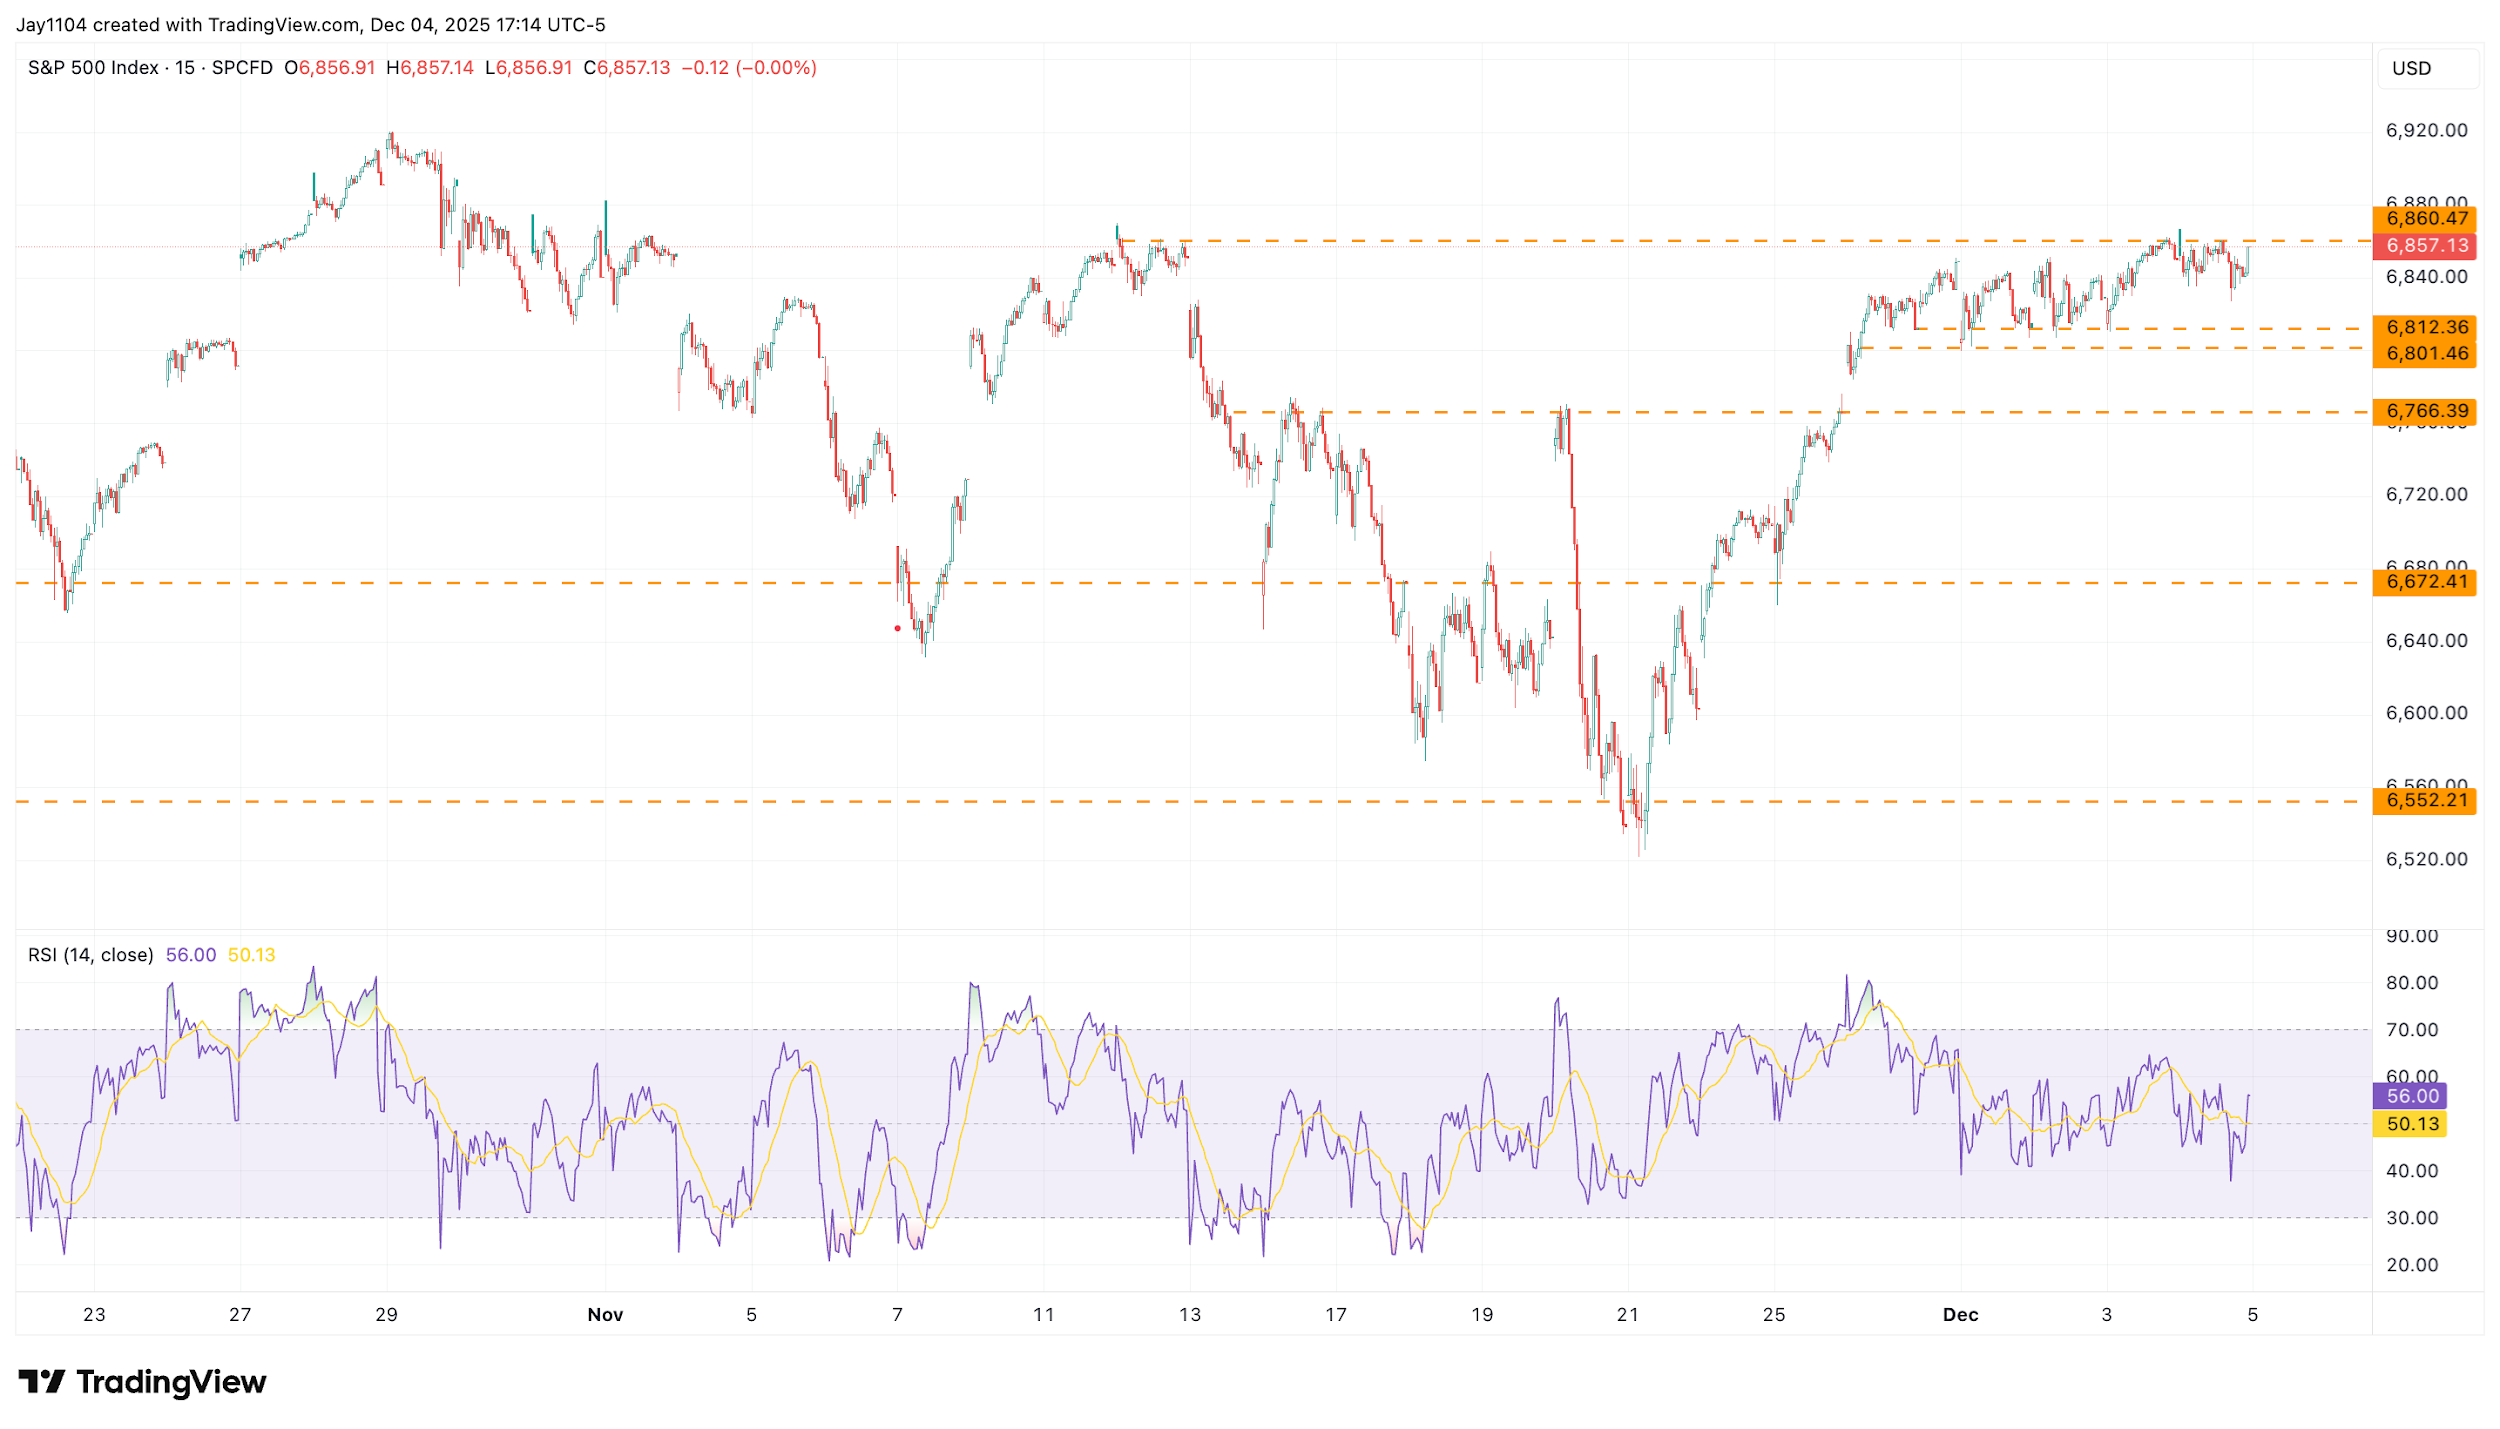
Technically, the S&P 500 setup remains essentially unchanged, with the index continuing to find support around 6,800 and resistance in the 6,850-6,860 range. [CHART2] Until one of these levels is broken, the market appears essentially directionless. At some point, this range will give way, and the task is to assess which direction is more likely. Given how low implied volatility is relative to recent norms, there is a strong chance that the market could break lower before it breaks higher. 1
(Source: TradingView)
Past performance is not a reliable indicator of future results.
[CHART2]
30-Year Nears A Breakout
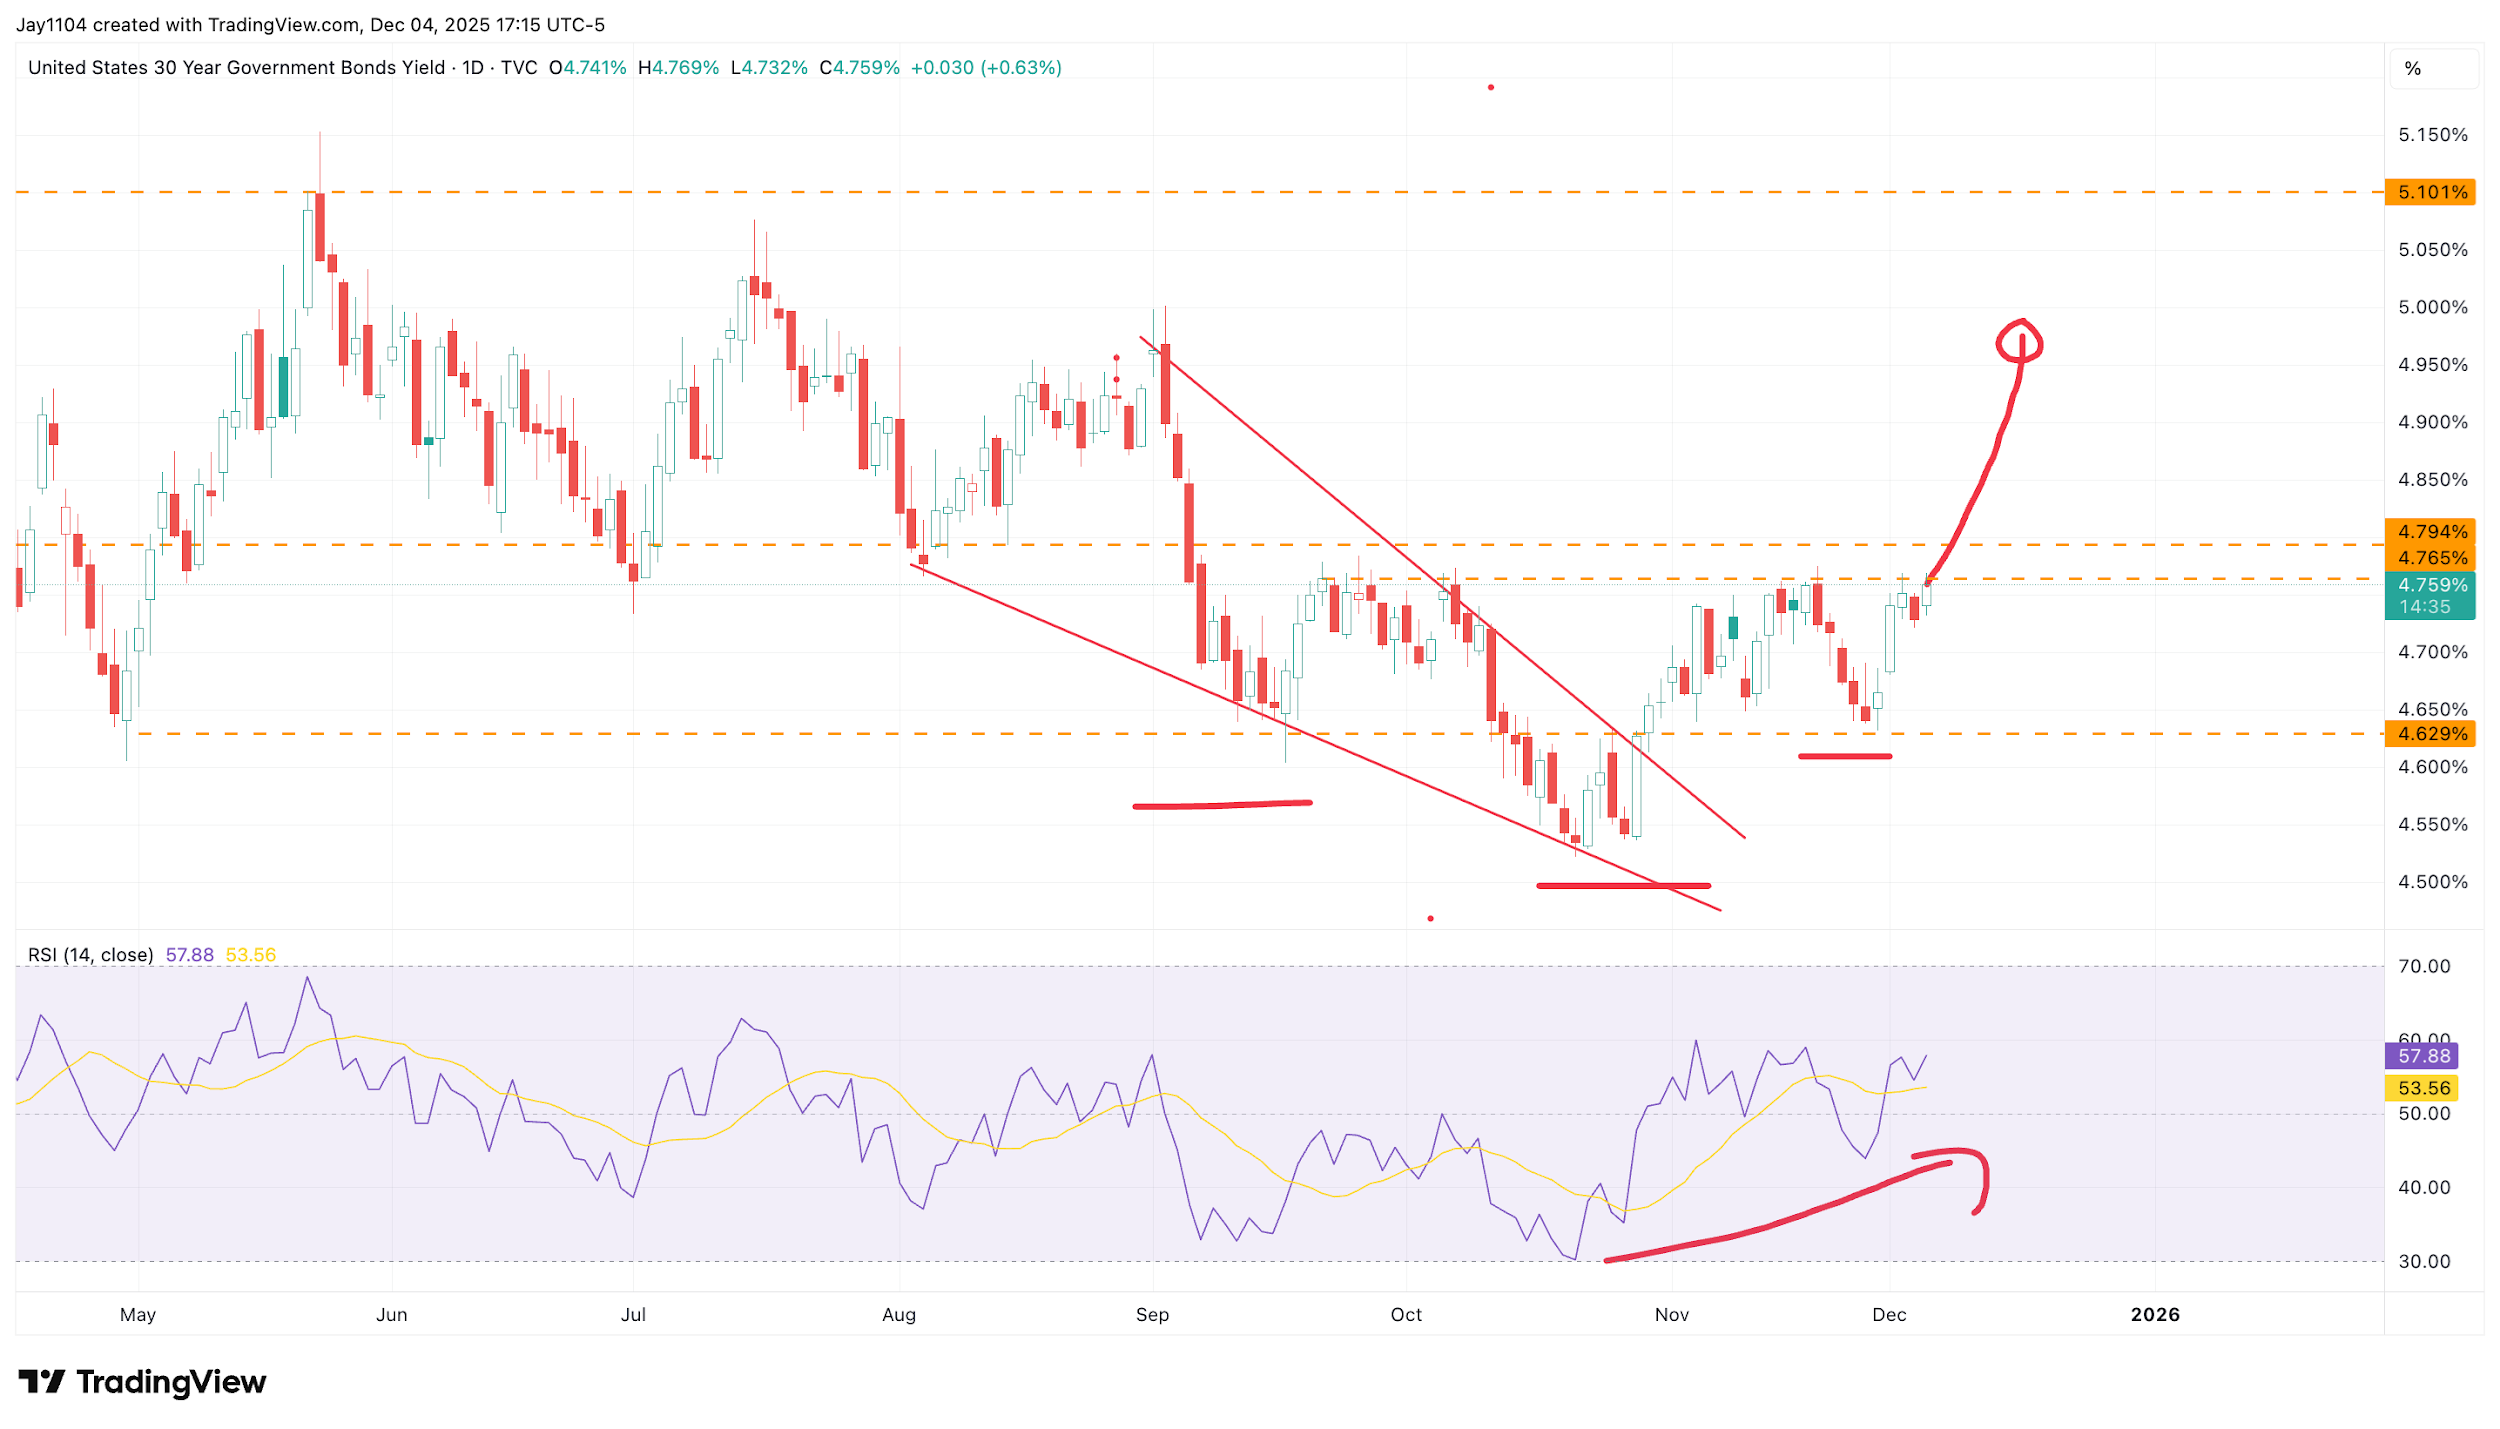
The more interesting — and perhaps more surprising — development is that, despite the equity market’s expectation of a Fed rate cut at next week’s December meeting, rates on the back end of the Treasury curve appear poised to move higher. The 30-year yield rose by three basis points today to finish at 4.76%, and it now sits directly on a key resistance level that held firmly from September through mid-October. It also appears to have formed an inverse head-and-shoulders pattern.
More notably, the RSI has begun to trend higher, indicating that momentum is shifting towards a move up in yields. At this point, the 30-year needs to clear the 4.80% region — just four basis points away — to break out of its recent trading range. If that occurs, it could put the yield on a relatively straightforward path back towards 5%. That may come as a surprise to some, but it is what the current technical setup suggests. 2
1 [CHART3] Source: TradingView (technical analysis) CBOE VIX Index — showing subdued implied volatility relative to historical averages.
2 [CHART3] Source: TradingView (technical analysis)
(Source: TradingView)
Past performance is not a reliable indicator of future results.
[CHART3]
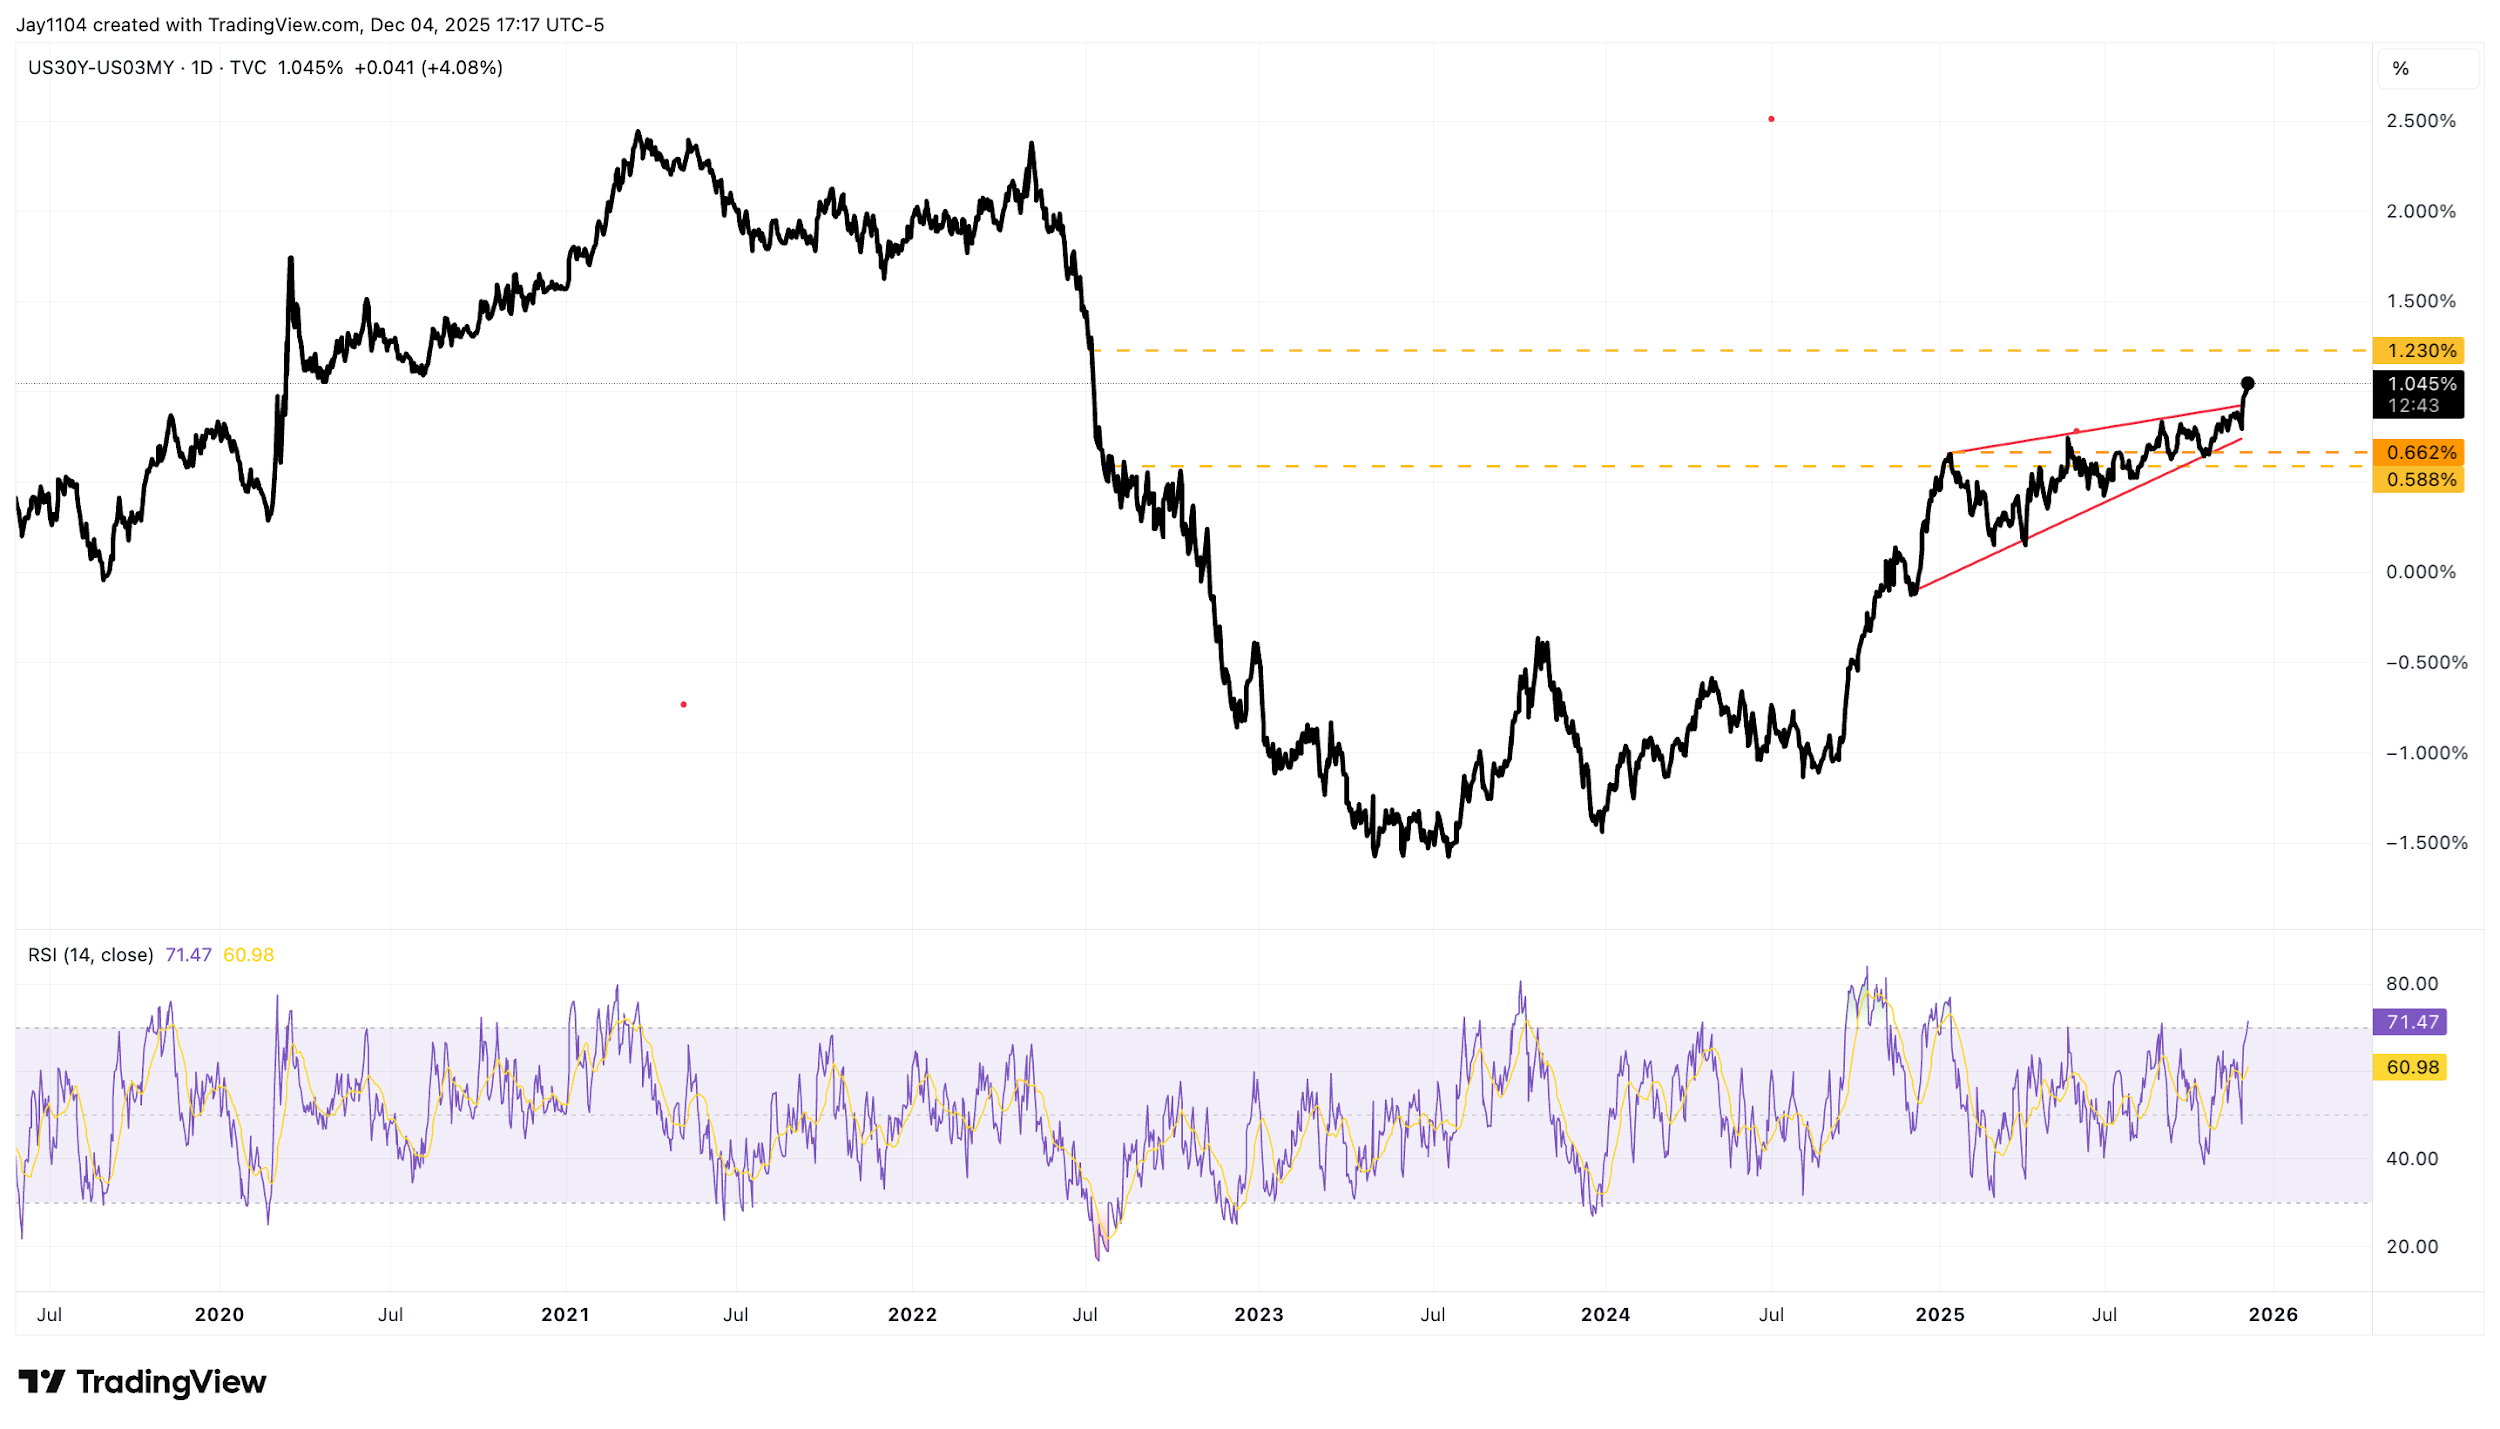
This matters because it has further steepened the yield curve. The spread between the US 30-year and the US 3-month Treasury bill widened to 1.05% today, the widest since July 2022. It now appears the curve is breaking out of a consolidation range and could move towards 1.25%.
3 [CHART4]
Based on the current positioning, the structure and direction of the curve suggest that most of the steepening is likely to come from the long end, with the 30-year doing the bulk of the work. The 3-month Treasury rate is unlikely to fall further from current levels, given expectations for Fed policy, suggesting the 30-year may need to rise by roughly 20 basis points to reach that target. That would put it somewhere near 4.95% in the not-too-distant future. The PCE report on 5 December could play a meaningful role in shaping such a move. 4 5
3 [CHART4]
4 Source
5 Source
(Source: TradingView)
Past performance is not a reliable indicator of future results.
[CHART4]