The stock market has only done this 3 times in the last 100 years
1929, 1968, 1999. These years mark historic peaks in stock market valuations, and today they're higher than they've ever been before.Past performance isn’t a reliable indicator of future results.
With the US stock market reaching a record valuation in September 2025, the handful of times valuations have peaked like this, it always coincided with major market tops.
There's a common saying on Wall Street, you can't use valuations to time the market. But from this chart, these dates look pretty accurate at timing tops in the market. So, could we be on the brink of another historic breakdown?
To understand where we might be headed, we first need to look back at what caused those big deleveragings.
In 1929, a speculative frenzy pushed stock valuations to unprecedented levels
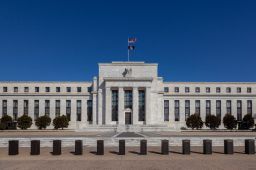
The Federal Reserve responded by raising interest rates to cool things down. The market crashed, triggering the Great Depression.
In 1999, it was the same story, different decade. The dot bubble created another speculative frenzy as investors scrambled to get in on skyrocketing internet company valuations. Again, the Fed hiked rates to cool things down, and the bubble burst, wiping out trillions in market value.
1969 was a bit different. Valuations were high, not because of a speculative bubble, but because of runaway inflation. Again, the Fed raised rates to fight it. What followed wasn't a sudden crash, but a brutal decadelong period of stock market stagnation with some very large drawdowns.
There seems to be a pattern. Extremely high valuations combined with a catalyst like Fed rate hikes have historically led to a lot of pain for investors.
Valuations are again at historic highs
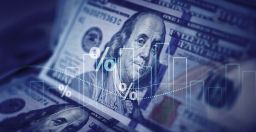
Many argue we're in a speculative frenzy driven by the boom in artificial intelligence. Prominent investors like Howard Marks and Ray Dalio have warned that we are in a bubble. But there's a crucial difference this time around. Unlike 1929, 1969, and 1999, the Federal Reserve is not raising rates. In fact, it has recently been cutting them in signals that rate cuts will continue.
So, if the Fed isn't the catalyst, what could be? The answer might be tariffs.
Average tariff rates have hit levels not seen since before the Great Depression
Tariffs are widely expected to act as a brake on the economy. There seems to already be evidence that the economy is beginning to slow down.
The once red-hot job market has cooled considerably with non-farm payroll numbers down significantly. Only 22,000 jobs were created in the US in August, compared to over 900,000 in July 2021 at the peak of the hot labor market after the pandemic and 120,000 jobs as recently as this past January.
That slump in job creation looks like a big red flag. It makes the economy more vulnerable than it was just a few years ago.
Other key metrics are also flashing warning signs
The Conference Board's leading economic index, an indicator designed to signal shifts in the business cycle, has been falling since 2022, dragged down by consumer pessimism about the business outlook and weak new orders. The manufacturing PMI has also been in contraction territory for months, a sign of weakness in the industrial sector. And these contractions are likely driven in part by those tariff hikes.
Could tariffs potentially have the same catalyst effect as the Fed rate hikes of the past?
Well, they both have the same effect. Rate hikes and tariffs slow down economic activity. Rate hikes do it by making borrowing more expensive, while tariffs do it by raising the cost of goods and disrupting trade.
This isn't just a theory. We have a historical precedent. The infamous Smoot-Hawley tariffs of 1930, which raised the average tariff rate to around 20%, are believed by many economists to have worsened the Great Depression.
What about the Fed cutting interest rates today?
Does that counterbalance the effect of tariffs by proportionately increasing economic activity?
It's possible the Fed's actions could neutralize the threat, or the economic slowdown caused by tariffs could still be enough to trigger a correction in a market priced for perfection.
Valuations could flatline
The valuation chart is a percentile relative to history, meaning it can't go significantly higher, but it could flatline.
This has happened before. Between 1965 and 1972, valuations hovered near the top of their historical range for almost 8 years. That period didn't produce a sudden crash, but it did lead to years of stagnant returns.
This confirms what we said at the beginning. You can't perfectly time the market with valuations. Stagnation, not a crash, is another real possibility.
The stage is set
We have a market with sky-high valuations, a potential new catalyst for a slowdown in tariffs and a counterbalancing force from the Federal Reserve.
The direction from here is uncertain, and time will tell where valuations go from here.
At Capital.com, we'll keep you updated on the most important economic indicators and what they signal about possible downturns. Explore more insights in our Educational Hub.