Stock Market Complacency Persists Ahead of CPI Report as Oil Breaks Out
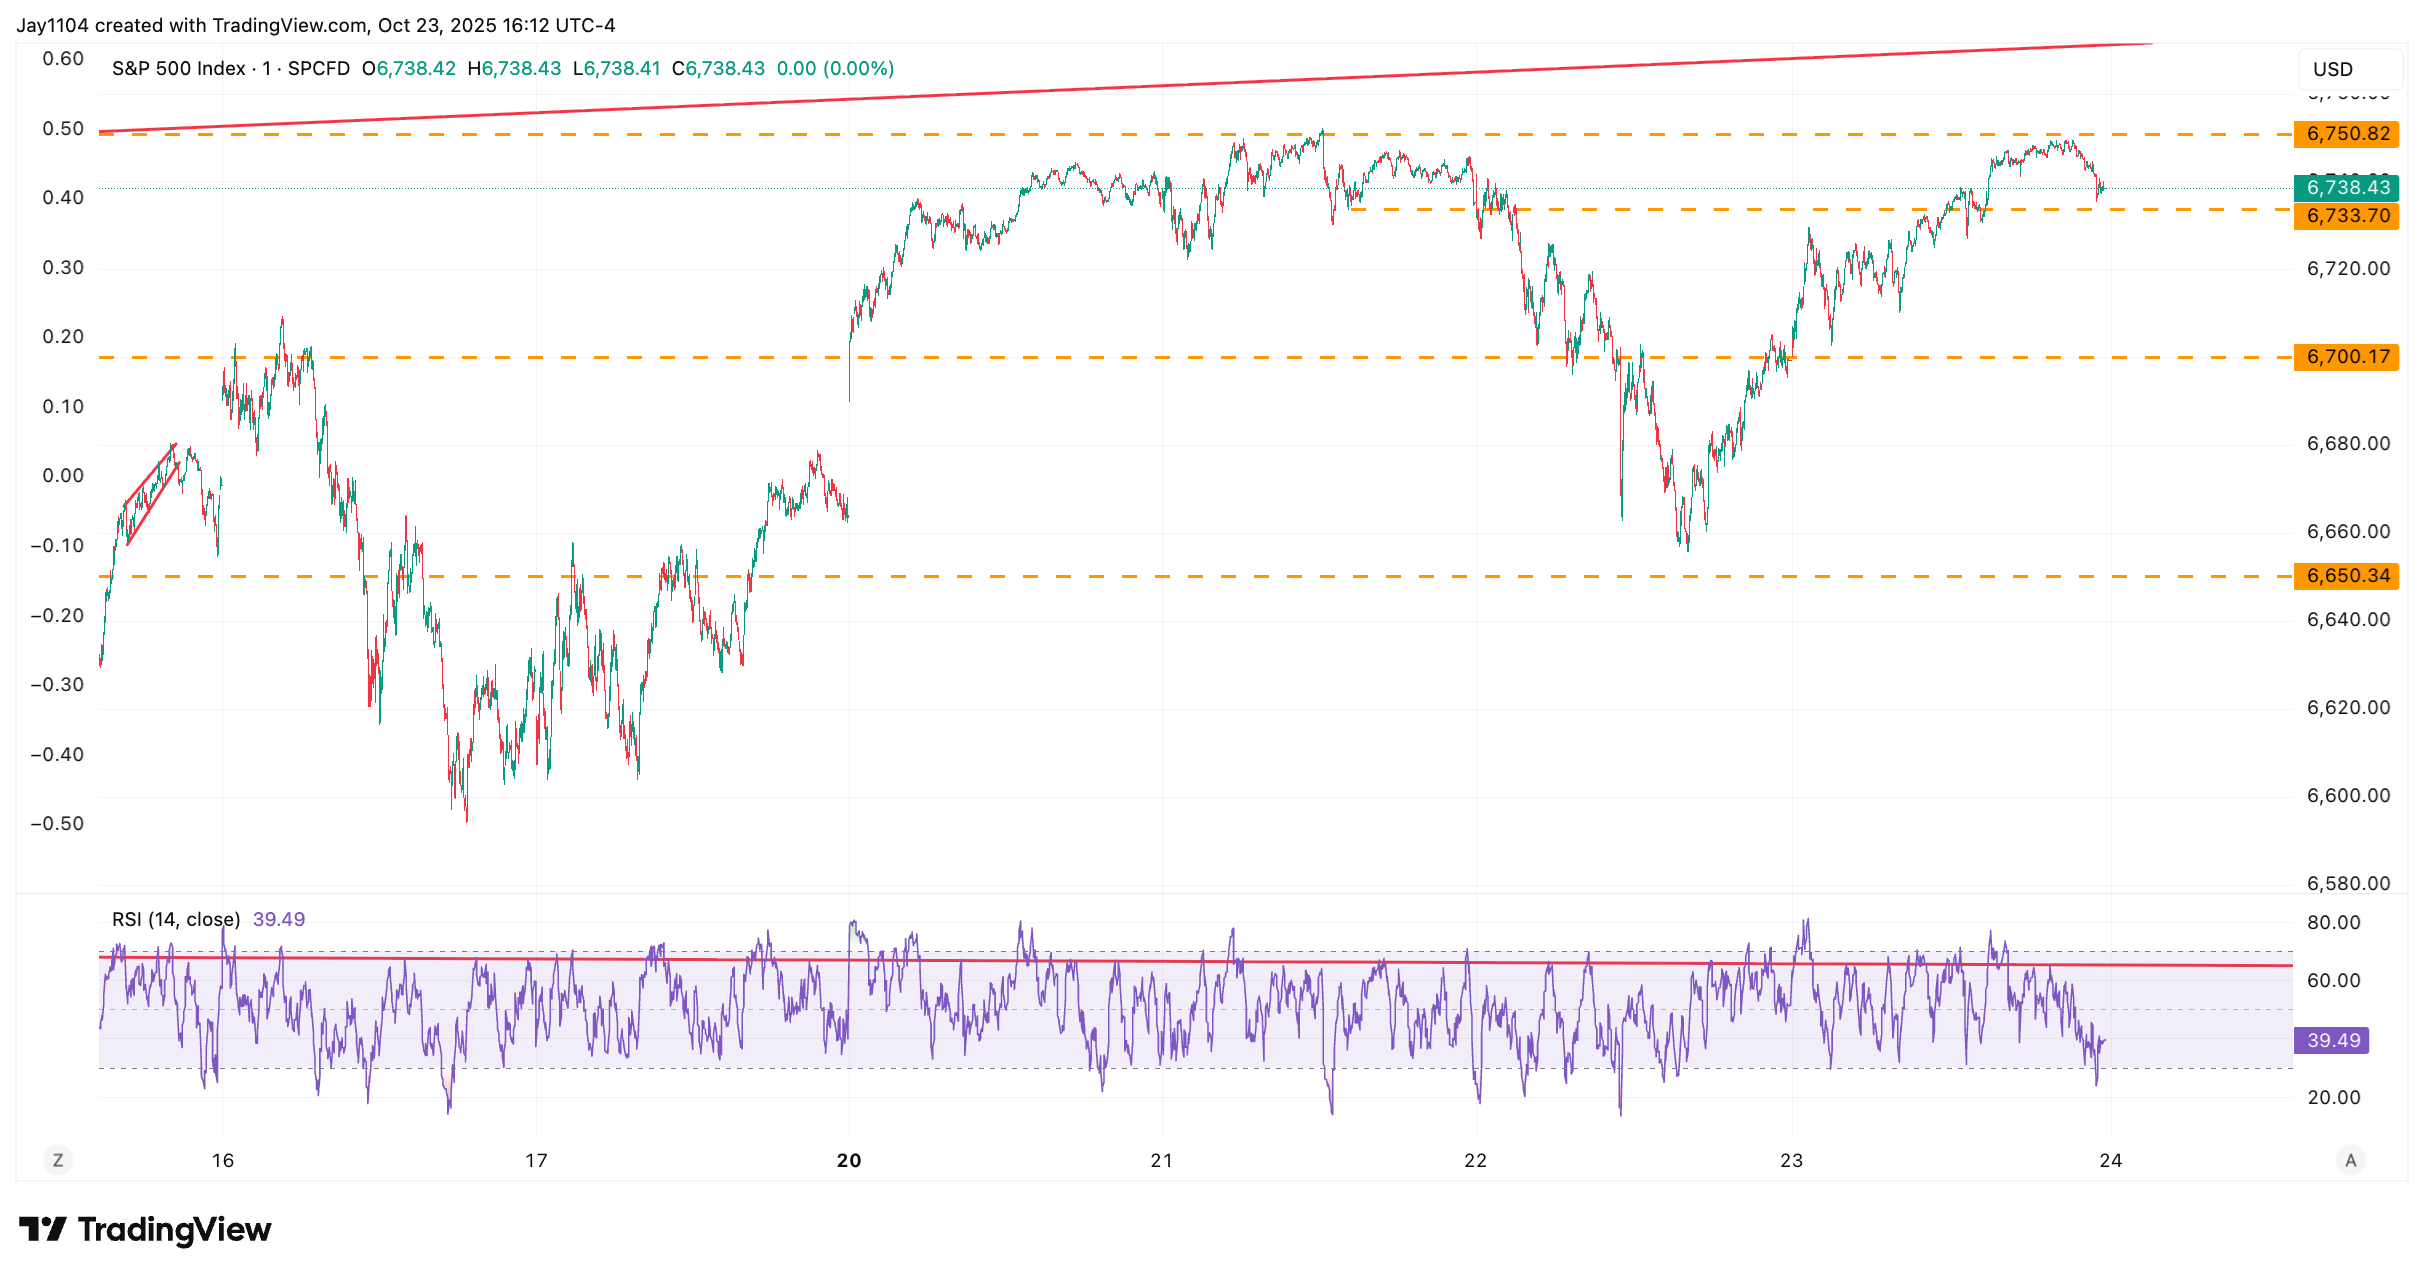
The S&P 500 finished the day higher by around 60 bps but, for the second time this week, failed to surpass the 6,750 level.
The S&P 500 finished the day higher by around 60 bps but, for the second time this week, failed to surpass the 6,750 level. This level represents resistance from both a technical and an options-positioning perspective. Still, the stock market appeared to remain very complacent ahead of the September U.S. CPI report.
(Source: TradingView)
(Past performance is not a reliable indicator of future results)

CPI Preview
The U.S. September CPI report is due on the morning of Friday, 24 October, at 8:30 a.m. New York time. Analysts expect core CPI to rise by 0.3% month on month and by 3.1% year on year, in line with last August figures. Headline CPI is expected to increase by 0.4% month on month and by 3.1% year on year, up from 2.9% in the previous month.
(Source: TradingView)
(Past performance is not a reliable indicator of future results)
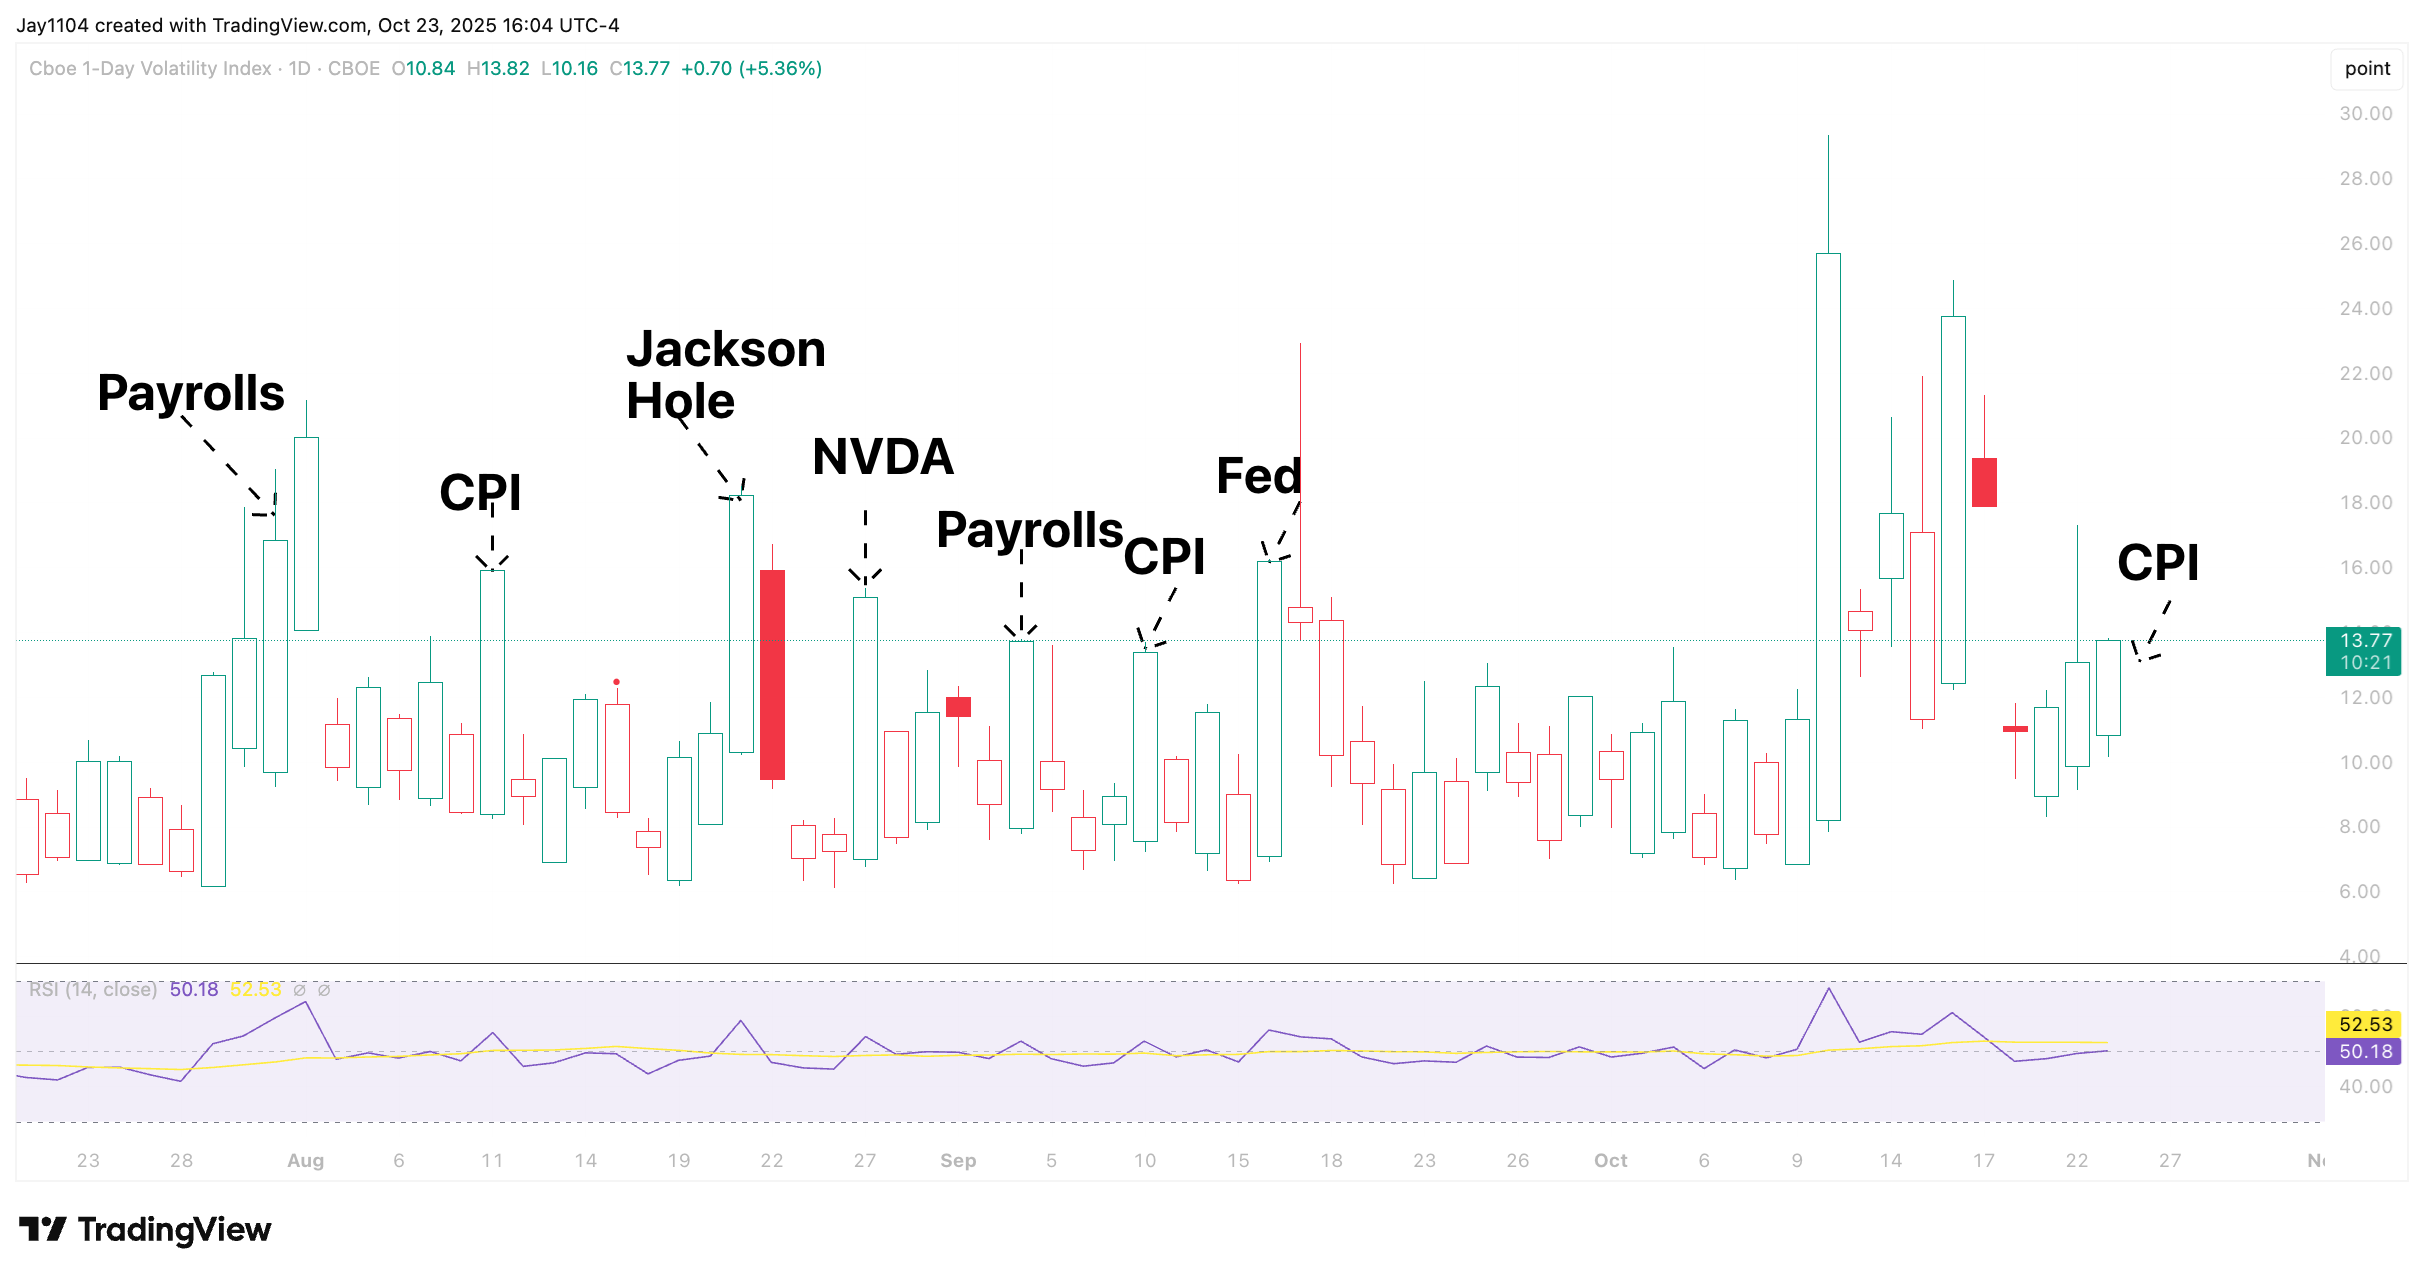
The market appears complacent about the report. Typically, volatility rises ahead of such a release. However, in this instance, volatility has remained relatively low, with the VIX 1-Day not even reaching 14, the high seen on 22 October. At this point, any potential for an implied volatility crush following the CPI report appears limited, suggesting the likelihood of a major market rally on Friday is subdued.
(Source: TradingView)
(Past performance is not a reliable indicator of future results)
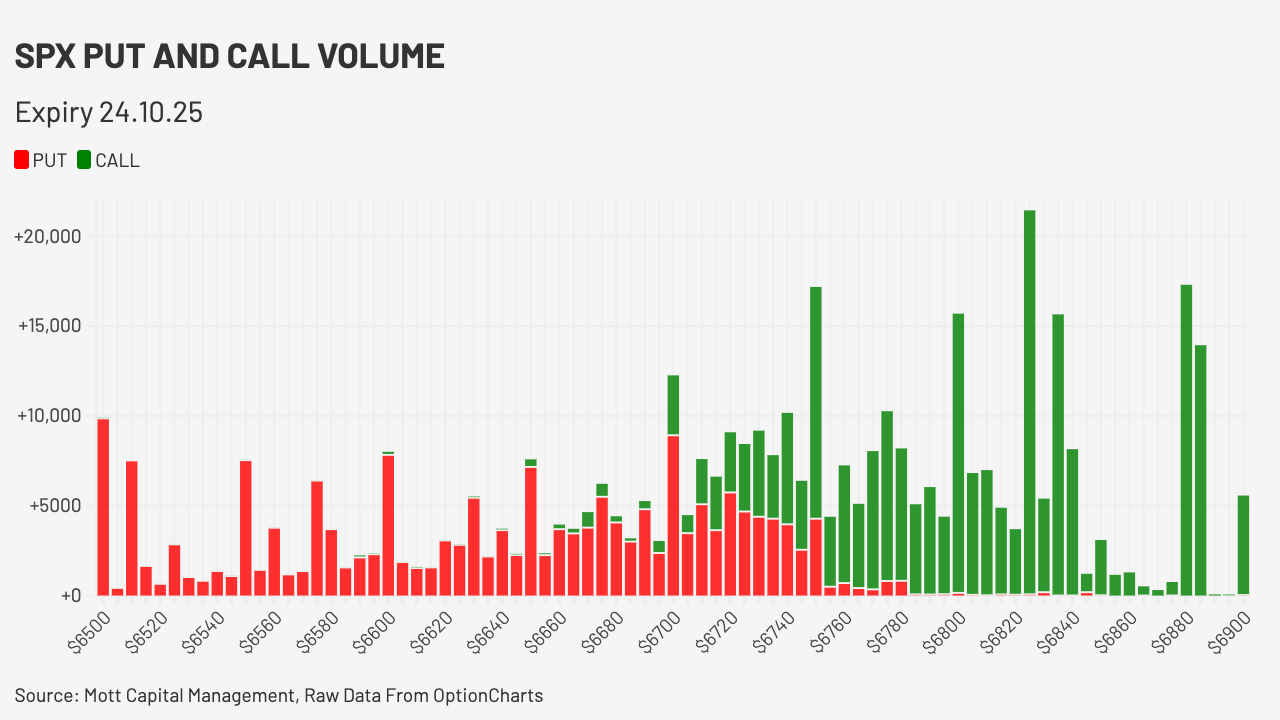
Hedging activity ahead of Friday morning’s CPI report also appears to be limited. In fact, the most active and highest-volume option trading in the SPX for Friday’s expiration date had been concentrated at strikes up to and around 6,800 for Friday’s expiry, with very little hedging interest below 6,700. This, once again, suggests that the market is more than comfortable betting on further upside while showing little concern about downside risk — reinforcing the view that investors remain fairly complacent going into Friday’s CPI report.
WTI Oil Bullish Reversal
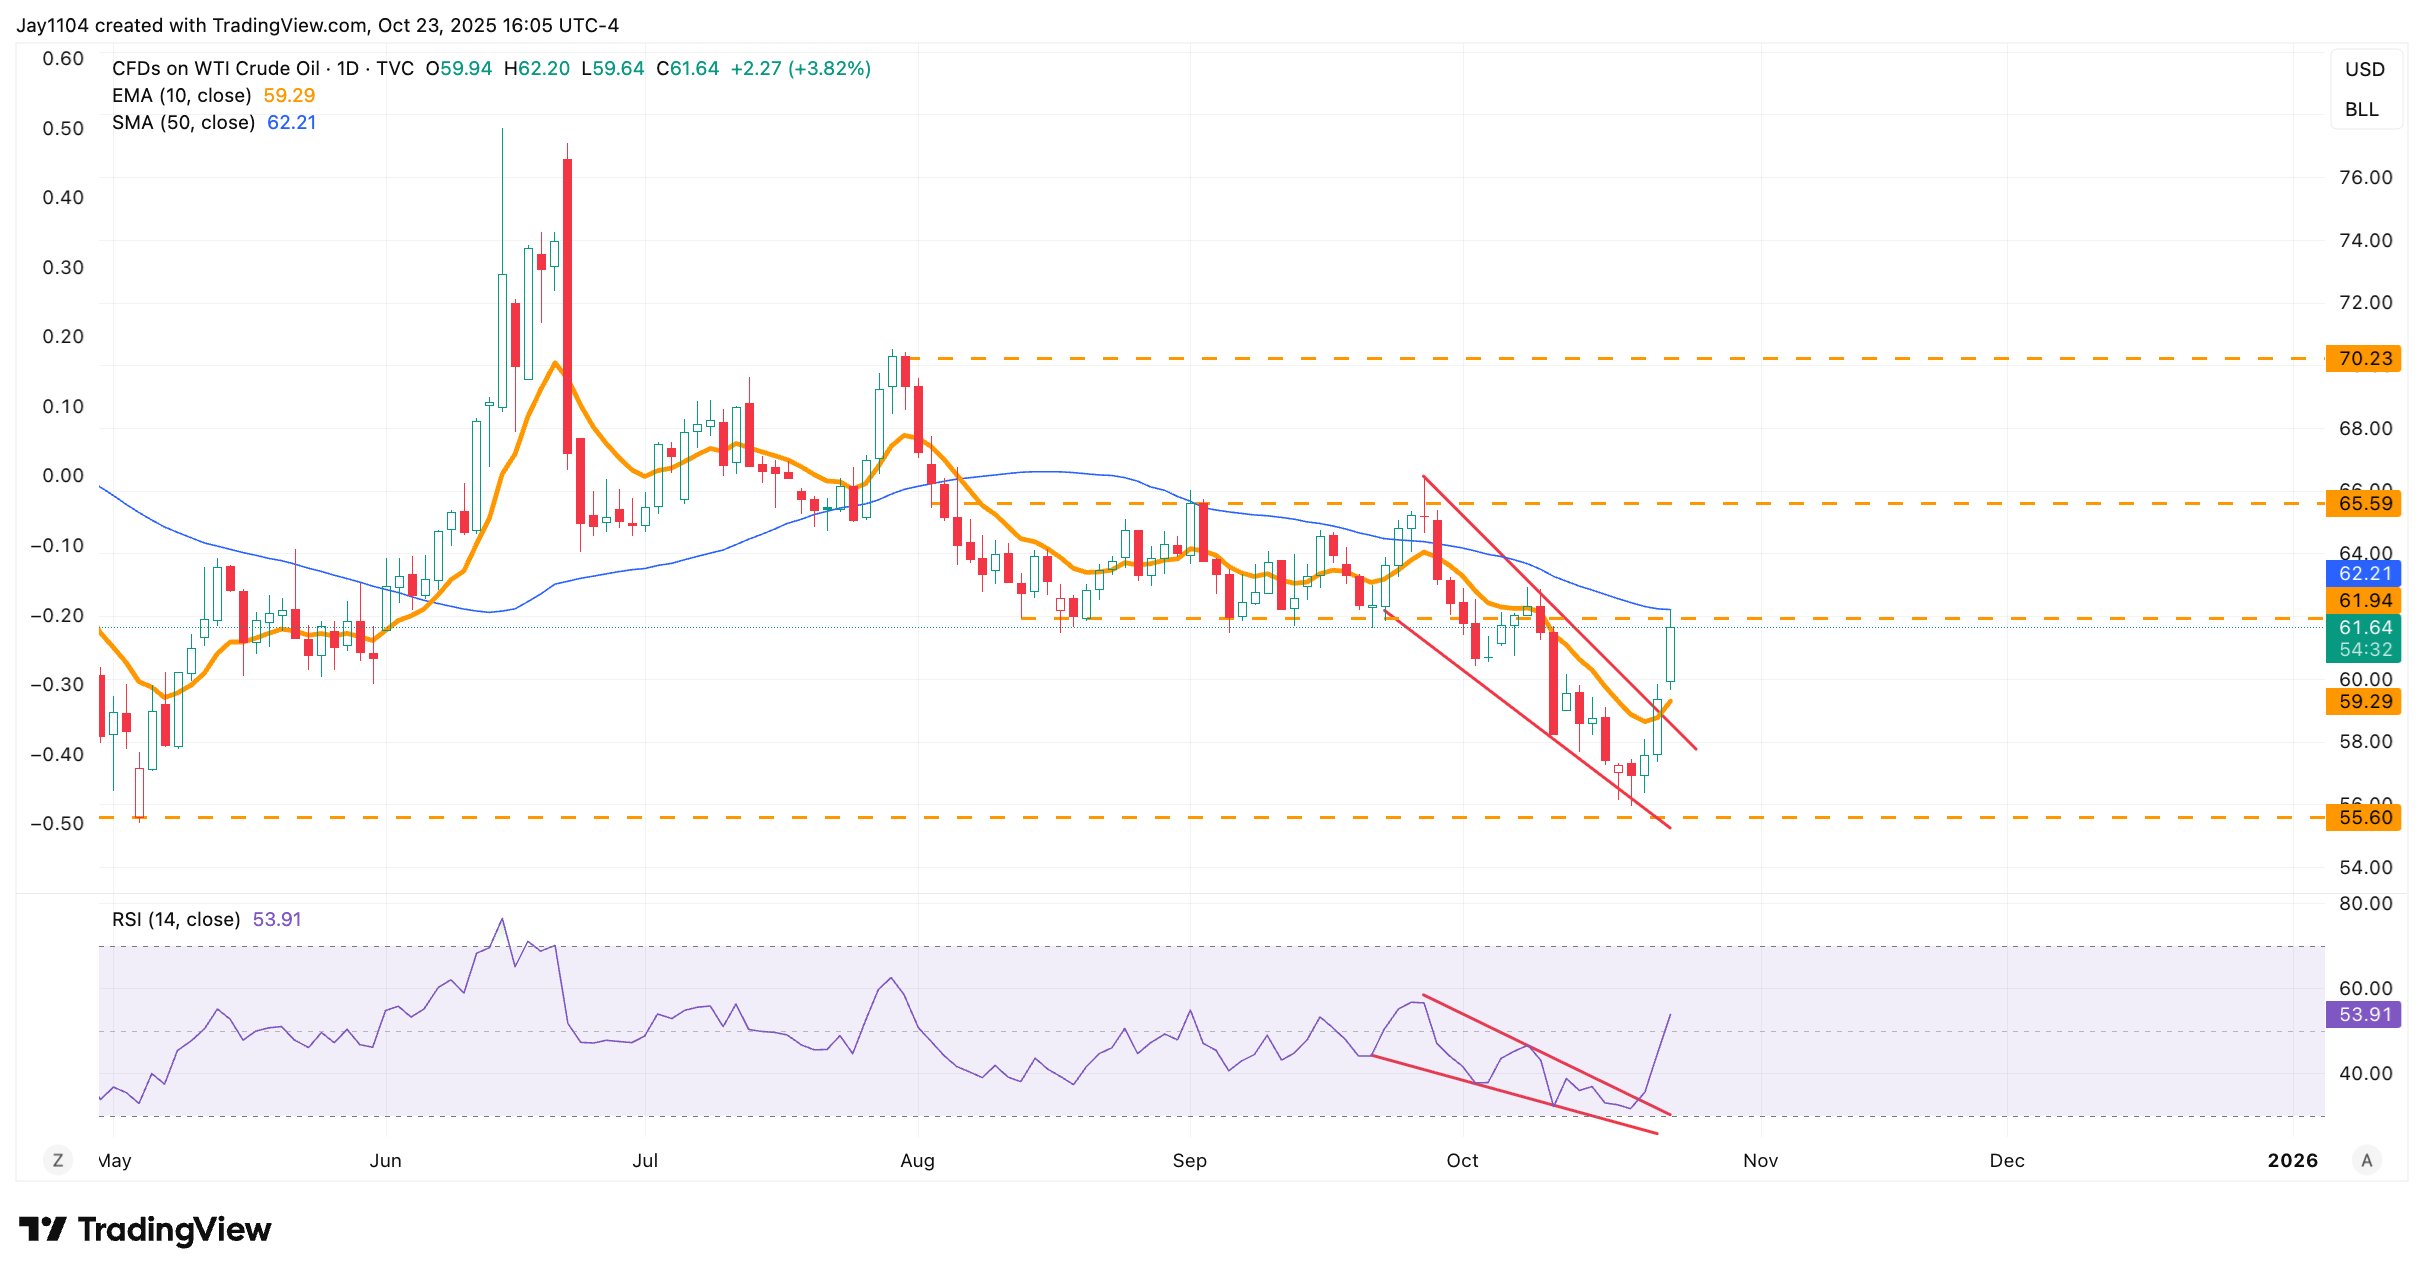
Oil prices rose sharply, with WTI climbing by nearly 4% on the day and breaking out of a falling wedge pattern on both the price chart and the RSI. Resistance was encountered around $62 per barrel and the 50-day moving average. A breakout above that level could open the door to a move towards $65.50. If prices can clear $65.50, the next potential target would be around $70.
At this stage, it appears a bullish reversal pattern may be forming on the RSI, with higher lows aligning with price support around $55.60, suggesting a trend change could be developing. However, this setup has appeared before, only for oil prices to subsequently slip. Therefore, it remains important to stay extremely cautious and nimble, given the significant headline risk surrounding oil.
(Source: TradingView)
(Past performance is not a reliable indicator of future results)
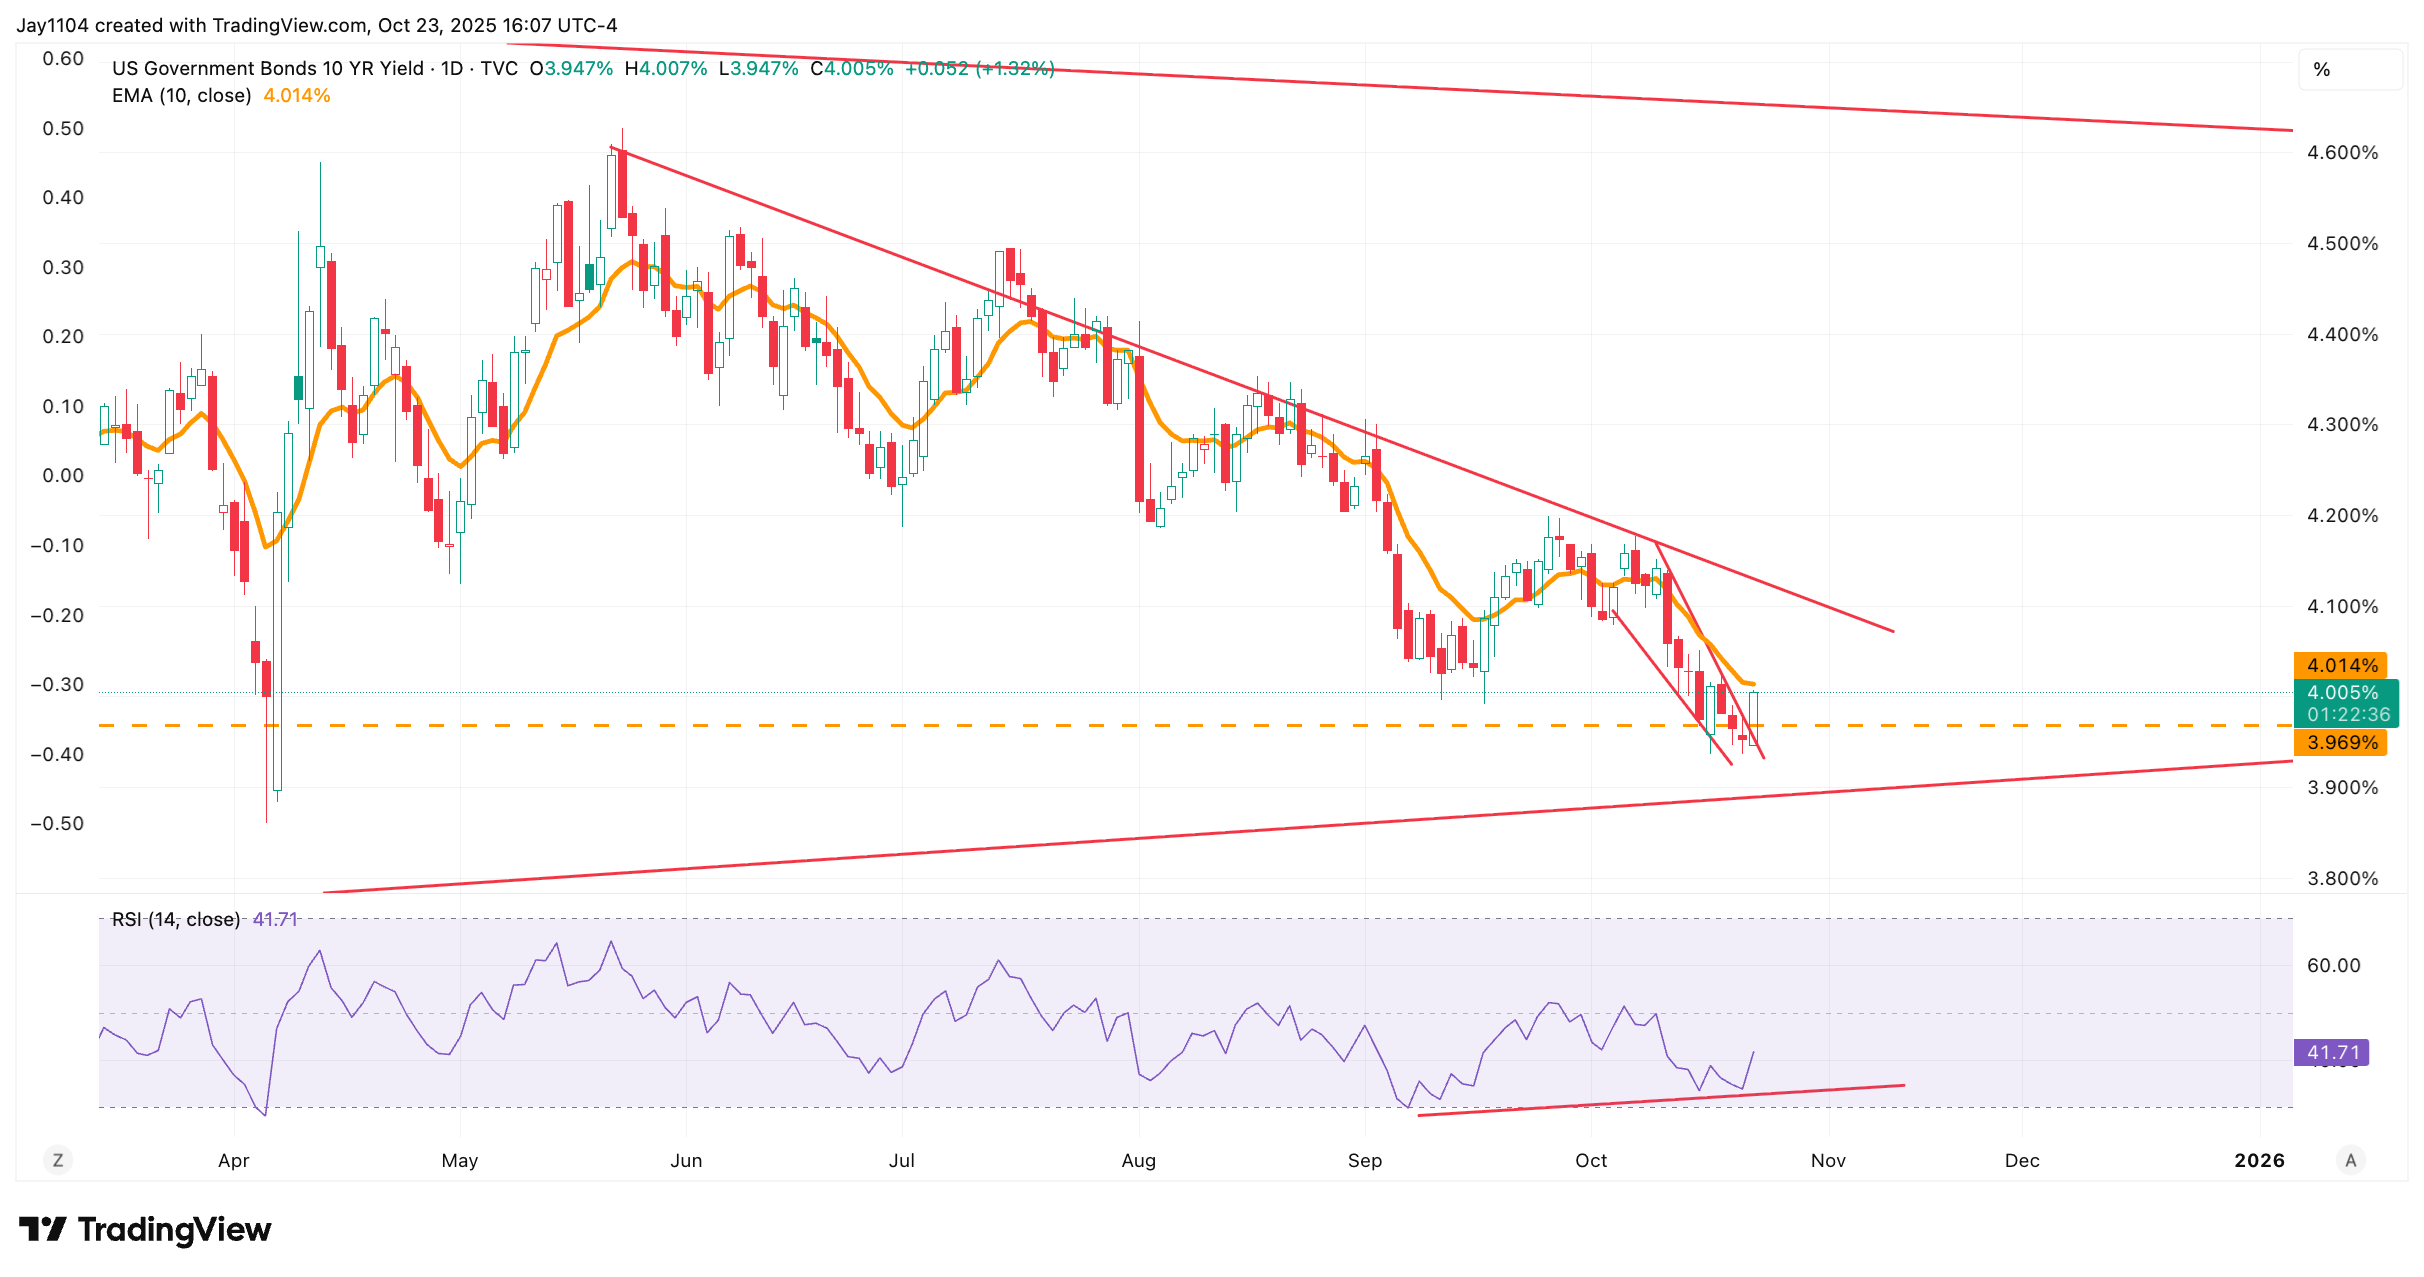
Rates Chase Oil Higher
With oil prices moving higher, U.S. 10-year yields also rose on the day. In fact, they too appear to have broken out of a falling wedge pattern. Additionally, a bullish divergence is forming, with the RSI making a higher low while the yield recently made a lower low. The 10-year continues to find solid support around the 4% region and is now approaching the 10-day exponential moving average at 4.01%.
If the yield can move above that level, it could rise further towards the 4.15% range. Clearly, a hotter-than-expected CPI report would likely push yields higher still, potentially extending the rise in rates over time.
(Source: TradingView)
(Past performance is not a reliable indicator of future results)
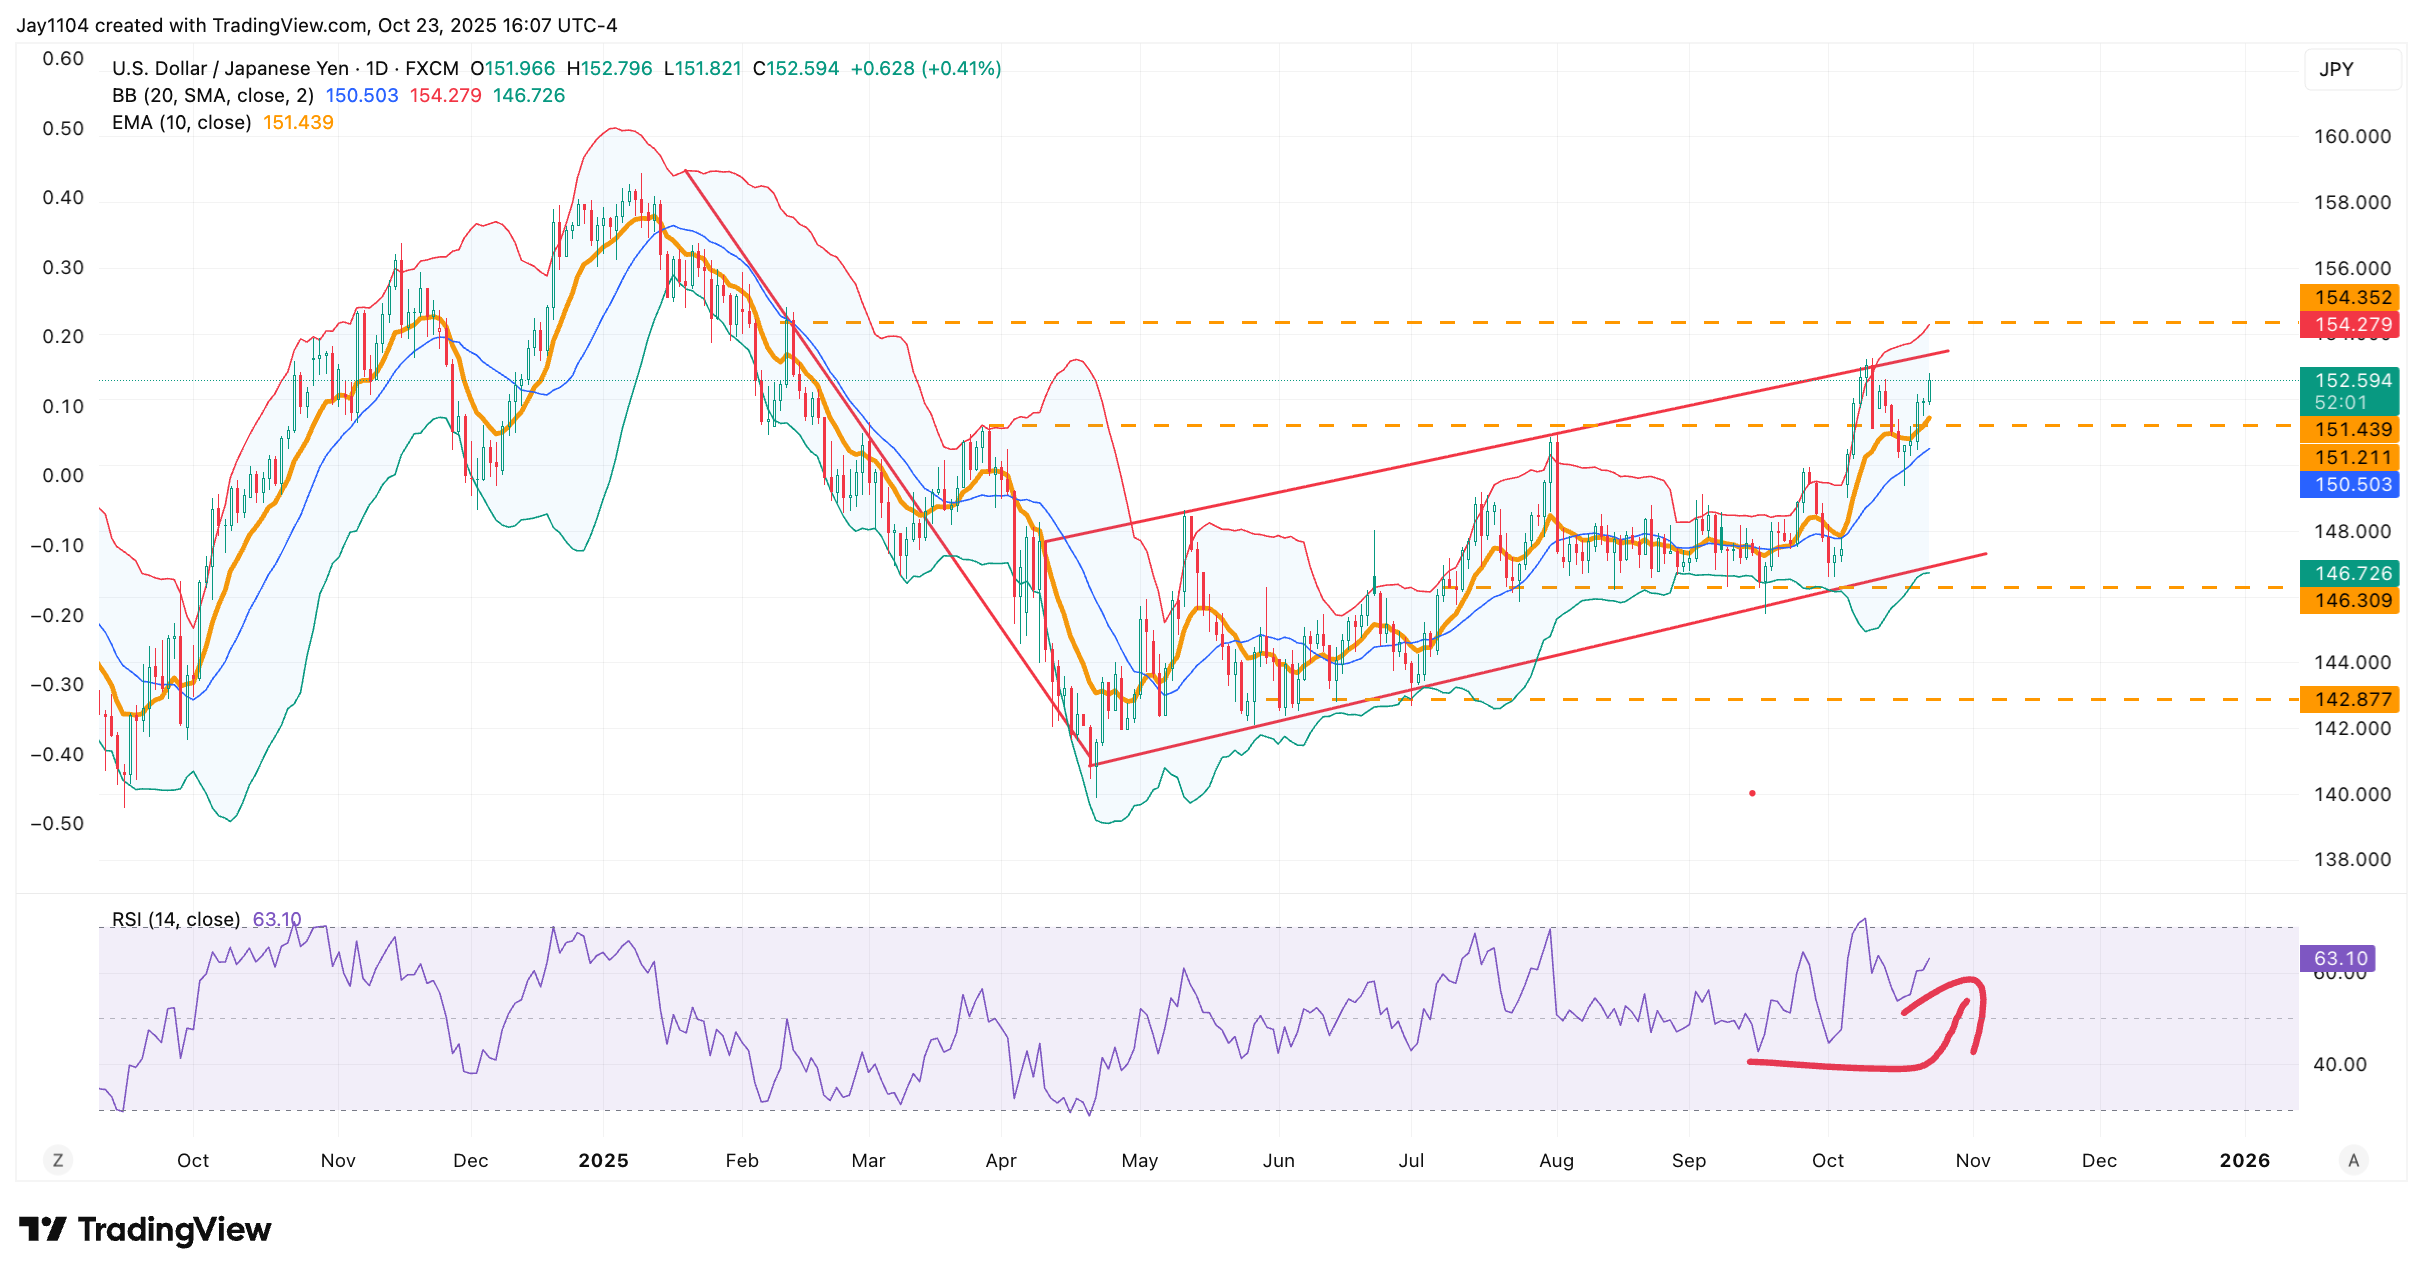
Yen Could Weaken on Hot CPI
A hotter-than-expected CPI report could prove positive for the U.S. dollar, particularly against the Japanese yen. Rising oil prices add another reason for potential yen weakness. The yen has already been softening and is currently trading around 152.5.
If the CPI report comes in above expectations, the yen could move towards the next area of resistance around 153.5, and possibly even rise towards the upper Bollinger Band near 154.5. Conversely, the currency appears to have solid support around 150.70, which aligns with the 20-day moving average at present.
(Source: TradingView)
(Past performance is not a reliable indicator of future results)