Trading the S&P 500 After its Recent Record High
Latest geopolitical headlines have taken the index lower in the futures market, and in sentiment CoT speculators remain net sell while Capital.com’s clients are majority buy.
U.S. equity index futures are in slight retreat after renewed geopolitical escalation in the Middle East, with mixed reports emerging that the second round of peace talks scheduled for today have been called off. This follows a strong week where the S&P 500 (w/w +4.7% to 7,126), Nasdaq 100 (w/w +6.4% to 26,672), and Russell 2000 (w/w +5.8% to 2,776) all closed at fresh highs, with the Dow 30 (w/w +3.6% to 49,447) not far off February’s peak, as market participants expected (and continue to expect) an eventual end to the conflict.
They’ve naturally been keeping an eye on energy prices given the negative correlation between it and risk appetite, with WTI gapping higher at one point not far off $90 before falling to around $87. Over in the bond market, Treasury yields ended the week lower across the curve as investors reacted to earlier de-escalation before the weekend risk reversal caused yields to rise after, and market pricing (CME’s FedWatch) at one point nearing a coin toss on hold vs 25bp (basis point) rate cut out of the Federal Reserve (Fed) in December before moving back in favor of a hold.
We heard from a couple FOMC (Federal Open Market Committee) members over the past few days, Daly that it’s too early to tell if the conflict will cause a long-term shock, and Waller that rate cuts are still possible this year if the war ends quickly but that both it and labor market risks are keeping them holding on interest rates.
Week ahead
We’ll get earnings from a few regional banks today, though it’s geopolitical headlines that are likely to carry more weight in the current climate, especially if peace talks scheduled for today are indeed called off ahead of Wednesday’s ceasefire expiry.
Otherwise, we’ll get retail sales data tomorrow followed by Kevin Warsh’s testimony before the Senate Banking Committee, the weekly claims and preliminary PMIs (Purchasing Managers’ Index) on Thursday, and UoM’s (University of Michigan) revised consumer sentiment and inflation expectations on Friday. It’ll get busier on the earnings front, with quarterly figures expected to be released from General Electric Aerospace, UnitedHealth, and RTX on Tuesday, Tesla, IBM, and Boeing on Wednesday, Intel and KLA both part of the semiconductor ecosystem on Thursday, and Procter & Gamble on Friday.
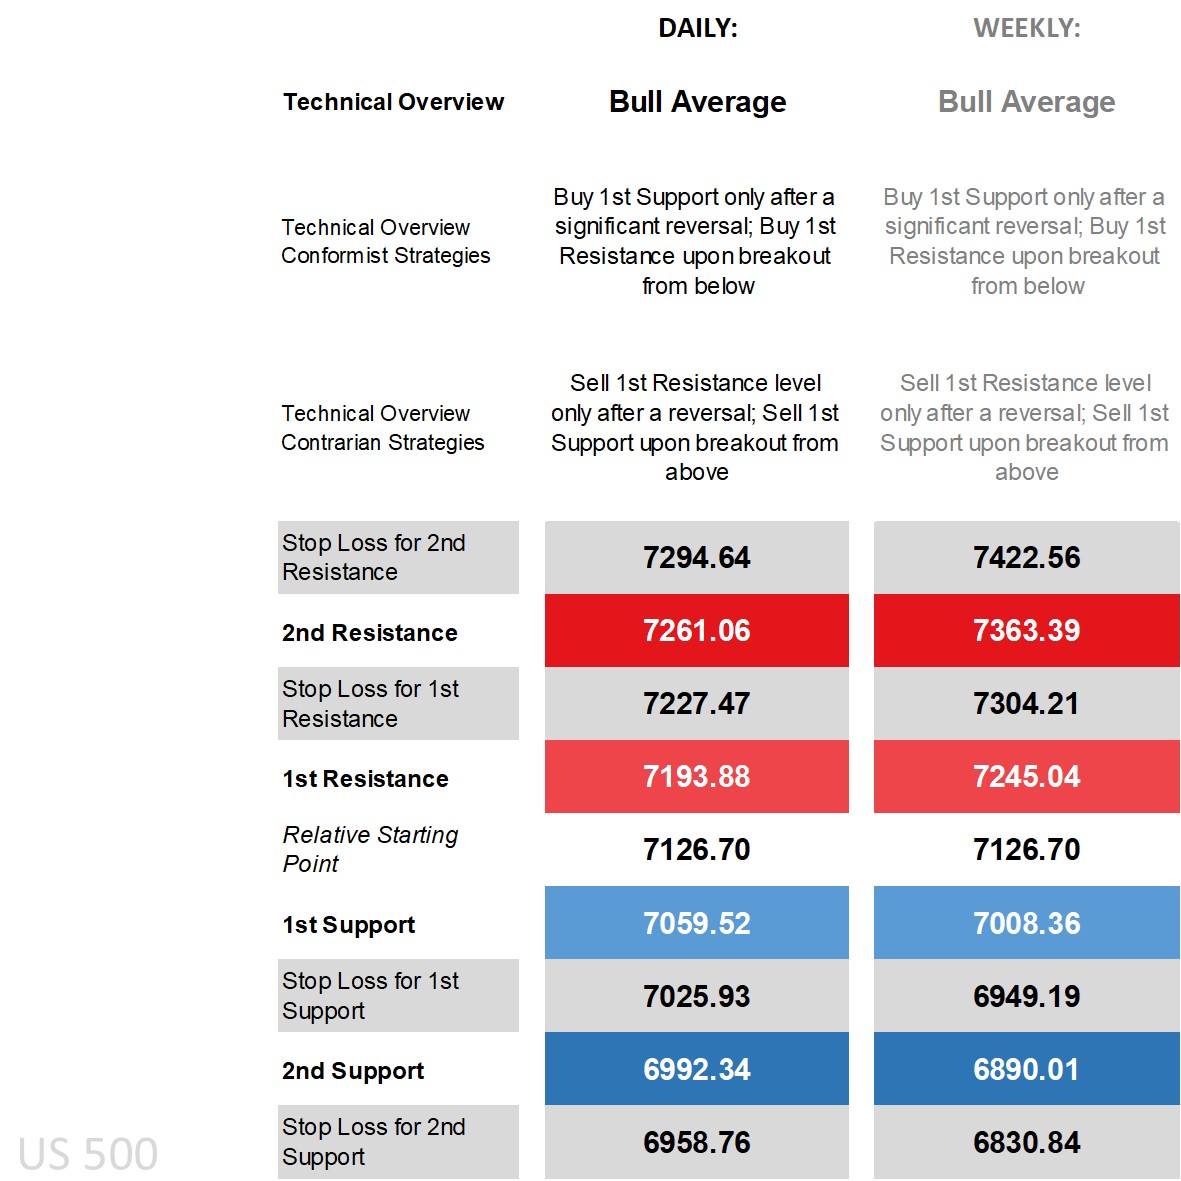
S&P 500’s technical overview, strategies and levels
Looking at the daily time frame and price is above all its main moving averages (MA), not far off the upper end of the Bollinger Band after walking it for much of the past two weeks, on the DMI (Directional Movement Index) front the +DI well over the -DI to label it as positive, an RSI (Relative Strength Index) shy of overbought territory after reaching it late last week, and an ADX (Average Directional Movement Index) in trending territory.
That has translated into an overview that’s ‘bull average’ after spending much time as ‘consolidation – volatile’ during the start of the conflict where at the time it was conformist breakout strategies outperforming given price wouldn’t settle in a specific zone and was influenced in the shorter-term time frame by fundamental headlines.
Under a ‘bull average’ technical overview, buy strategies are in the conformist camp whether buying off the 1st Resistance level via breakout, or via significant reversal off the 1st Support waiting for price to break beneath it first and by a sizable amount, and only buying should price recover back to the level. Avoiding a fade or a simple reversal strategy off the 1st Support helps prevent stops from getting triggered in times of excess volatility, and the gap lower this morning already reached the daily 1st Support before recovering.
Zooming out to the weekly time frame and while some of its key technical indicators aren’t as bullish, the recovery back up has shifted it back to ‘bull average’ and where traders working off the longer-term time frame have wider levels to contend with but an identical technical overview meaning conformist and contrarian strategies are the same as that of the daily time frame.
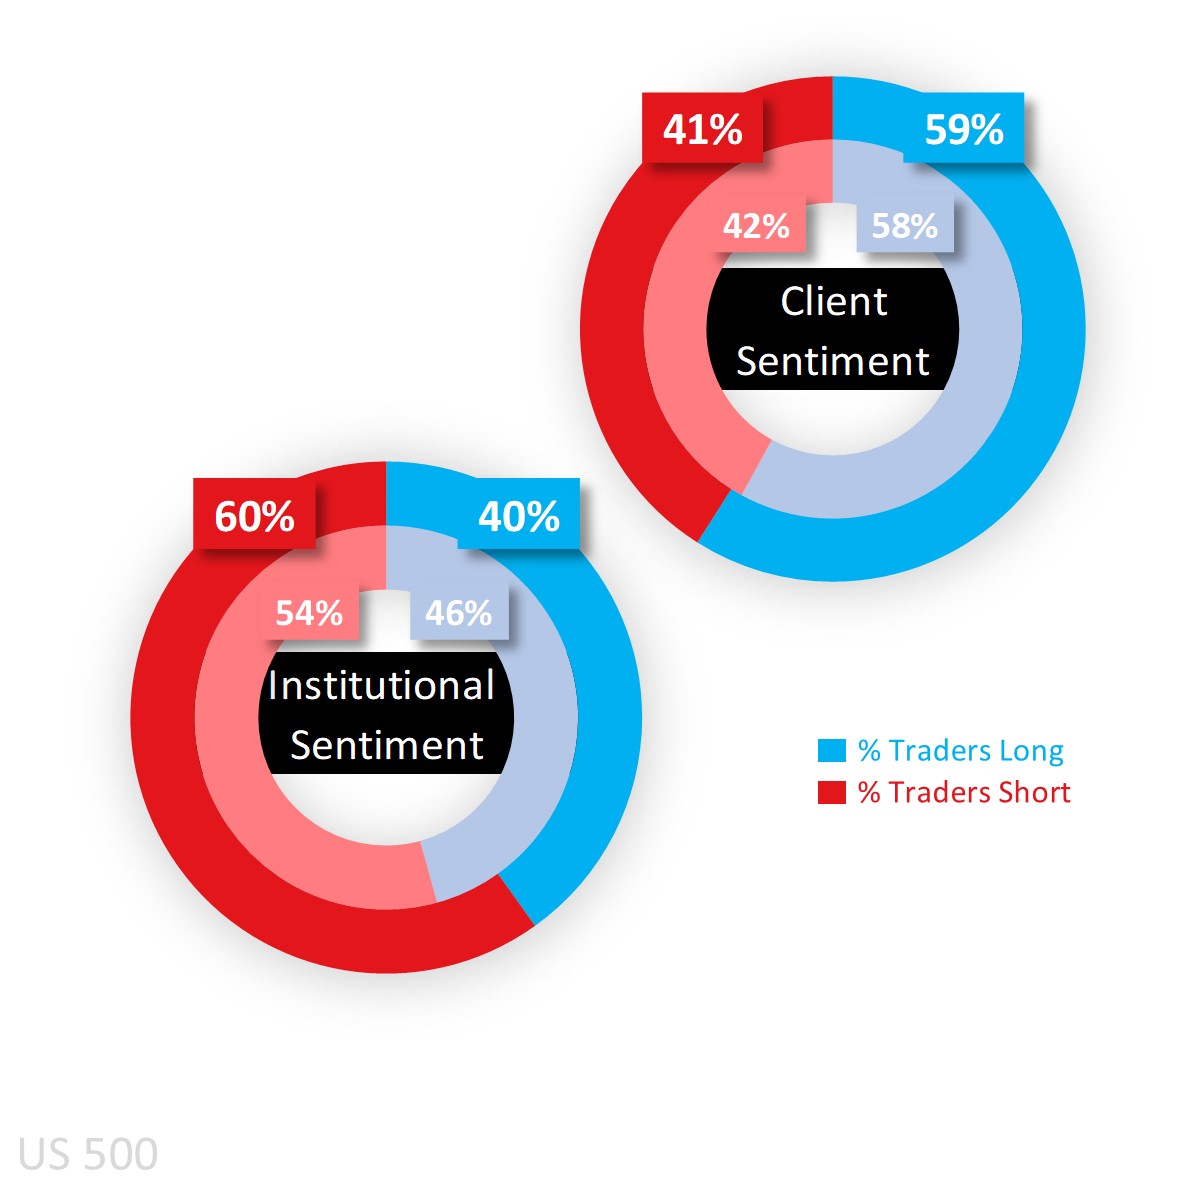
Capital.com’s client sentiment for S&P 500
Traders on Capital.com’s trading platform are opting to remain in majority buy territory even after sentiment among them dropped from 64% at the start of last week to 59% at the start of this week with some longs getting out and a few daring shorts opting to position against the trend.
Larger speculators according to the latest CoT (Commitment of Traders) report are an opposite net sell 60%, raising it from 54% from the previous report due to a larger increase in shorts (by 74,061 lots) over longs (by just 2,282). Looking at the other key U.S. equity indices and they are net sell the Dow 30 (62% from 74%) and Russell 2000 (53% from 55%) while net long in the Nasdaq 100 (and unchanged at 54%).
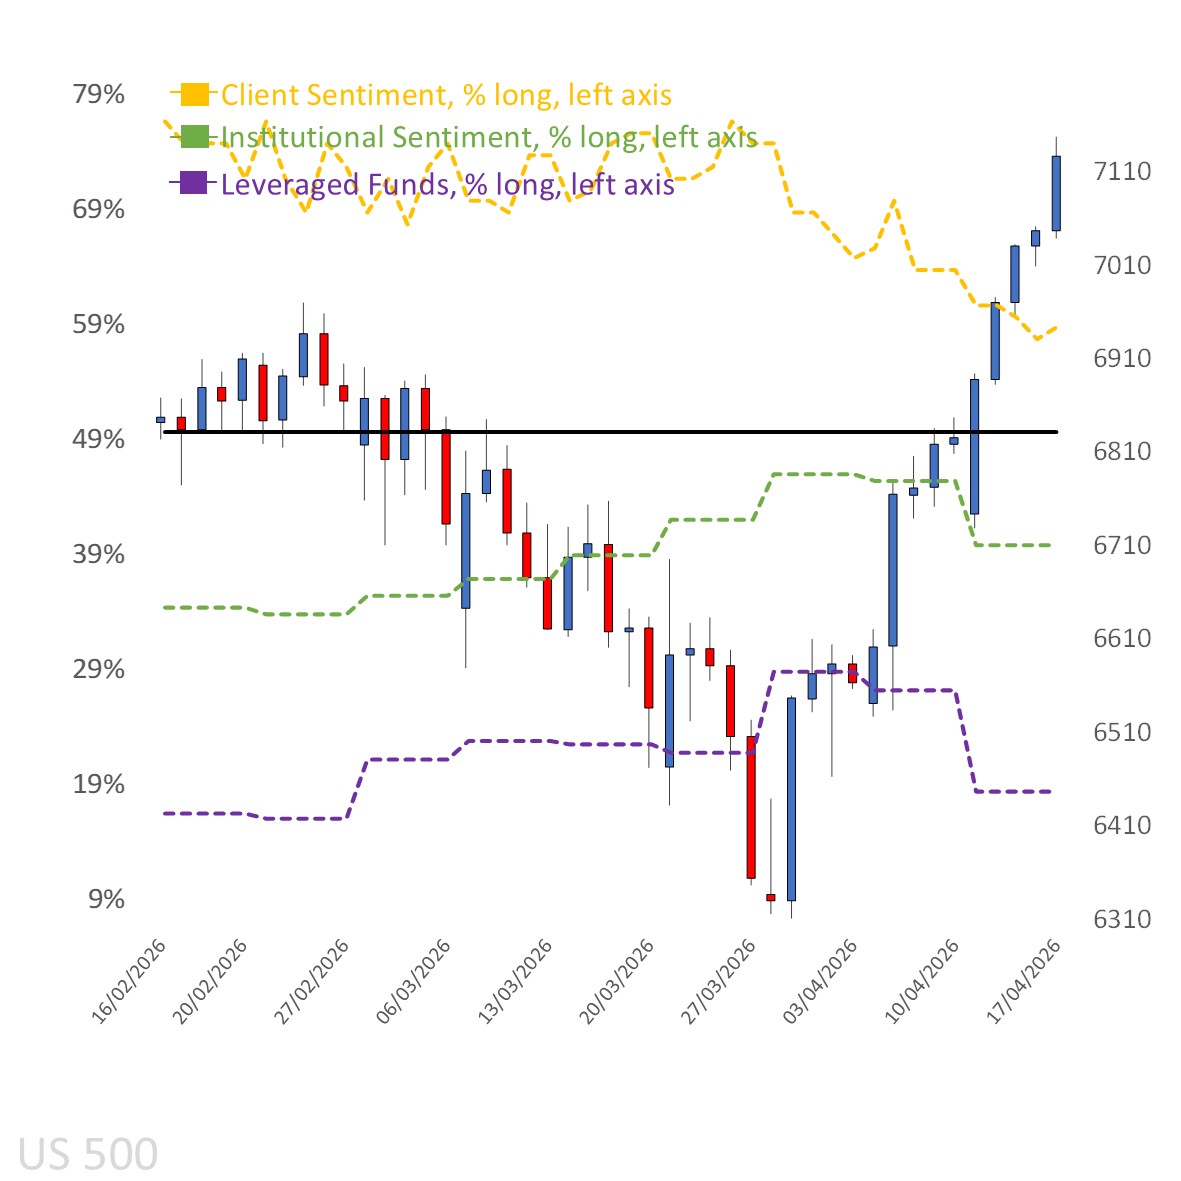
Client sentiment mapped on the daily chart
 Source: Capital.com
Period: February 2026 – April 2026
Past performance is not an indicator of future results.
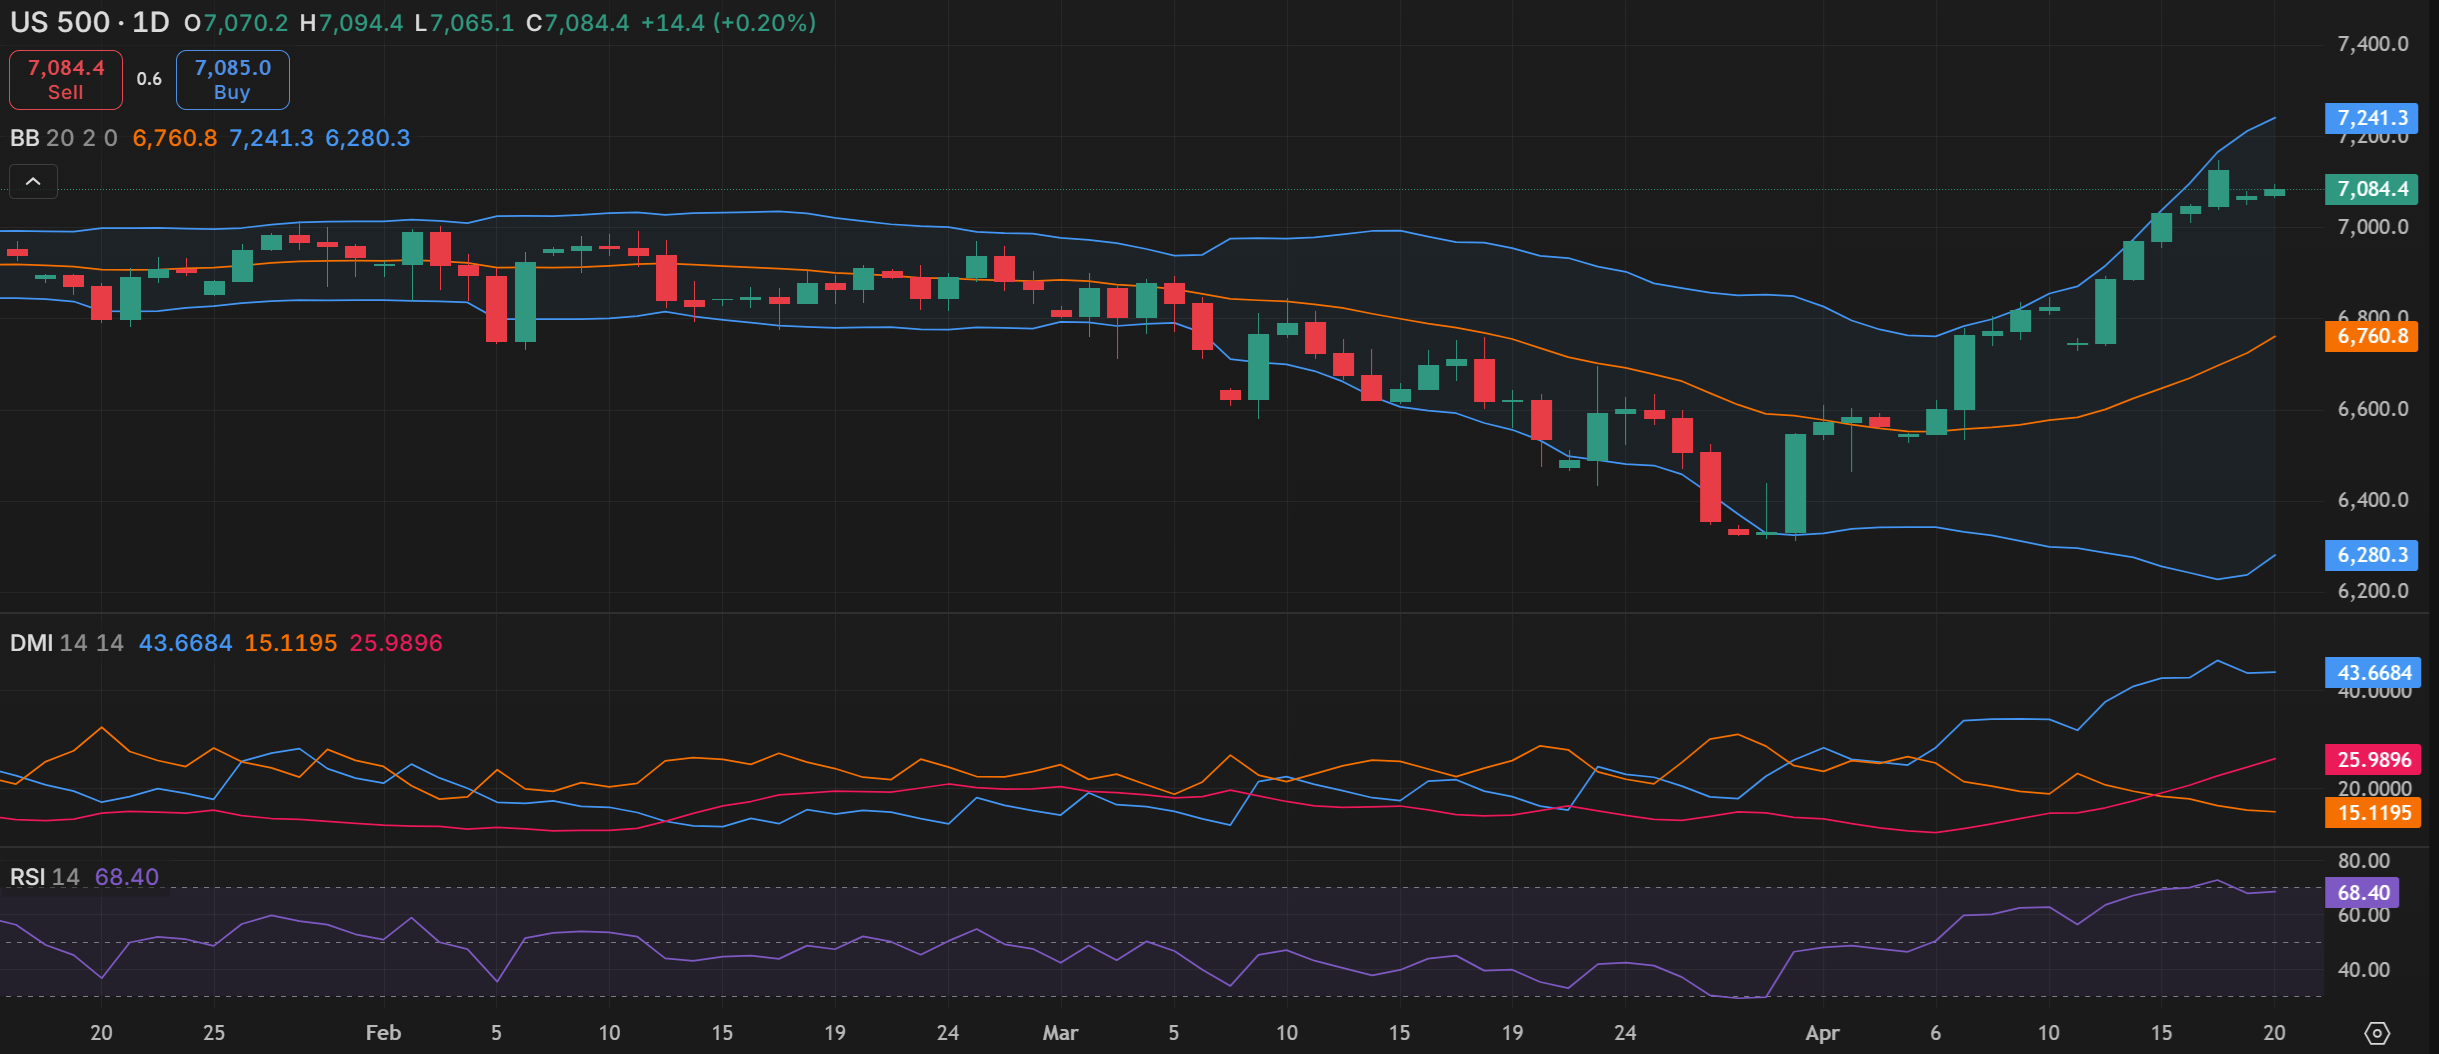
S&P 500’s chart on Capital.com’s platform with key technical indicators
Source: Capital.com
Period: January 2026 – April 2026
Past performance is not an indicator of future results.