Trading silver at 2011 highs
It has made quick work of the infamous $40 level to comfortably move within the handle, and it’s still a story of majority long sentiment among traders both large and small
Two weeks in a row of gains when it comes to silver’s price, but it’s this morning that has taken the focus as it finally reached and then breached the $40 level. You’d have to go back a full 14 years to 2011 when it last was at that price, in what was a testing time for silver bulls who had high hopes at the time we’d get another run towards $50. But that didn’t happen, instead falling as low as the $11s during the pandemic before mounting a steady recovery. That stood in contrast with gold prices that while also suffered after 2011’s drop, recovered back in 2020 and since has made fresh record highs plenty of times. To those trading the gold/silver ratio, silver’s recent outperformance sent it below 86 for the first time since late last year, hovering near pre-pandemic levels.
The catalysts for the gains in gold include (1) expectations of lower interest rates with the recent drama between U.S. President Trump and Fed Governor Cook putting the central bank’s future independence into question as any replacement (should it occur before her term expires) would be an advocate of rate cuts even if an inflationary environment and translates into lower yields on the shorter end of the curve and so too in real terms, (2) geopolitical tensions still high leaving investors with less options to hedge against any turmoil, and (3) ongoing tariff uncertainty as the latest ruling out of the U.S. Court of Appeals for the Federal Circuit that most global tariffs are illegal saying they’re a “core Congressional power” is giving ample time (until October 14) for the Trump administration to appeal that decision. The rates catalyst is also one that is shared with silver, but add to it increased structural demand from AI and electrification combined with constrained supply.
In terms of economic data out of the U.S., there was plenty to digest last Friday with PCE (Personal Consumption Expenditures) Price Index as expected with headline y/y (year-on-year) for the month of July up 2.6% again but core rising a notch to 2.9%, and m/m (month-on-month) growth of 0.2% and 0.3%, respectively. Personal income (+0.4%) and spending (+0.5%) were also as anticipated, but when it comes to UoM’s (University of Michigan) revised figures for August and consumer sentiment worsened to 58.2 while inflation expectations fell back (for the 1Y from 4.9% to 4.8% and to 3.5% from 3.9% for the 5Y).
Week ahead
And it’s a quiet start out of the U.S. given a holiday today before we get manufacturing PMIs (Purchasing Managers’ Index) tomorrow out of both S&P Global and ISM (Institute for Supply Management). Services PMIs will release on Thursday preceded by the weekly claims and ADP’s non-farm estimate, but then the attention shifts to the market-moving Non-Farm Payrolls for the month of August. Who can forget the significant miss last time around? And this is at a time when Federal Reserve (Fed) doves are looking for an excuse to lower rates saying tariff-induced price increases are a one-time move and in turn any further weakness in the labor market a chance at getting more votes in favor of rate cuts and sooner rather than later.
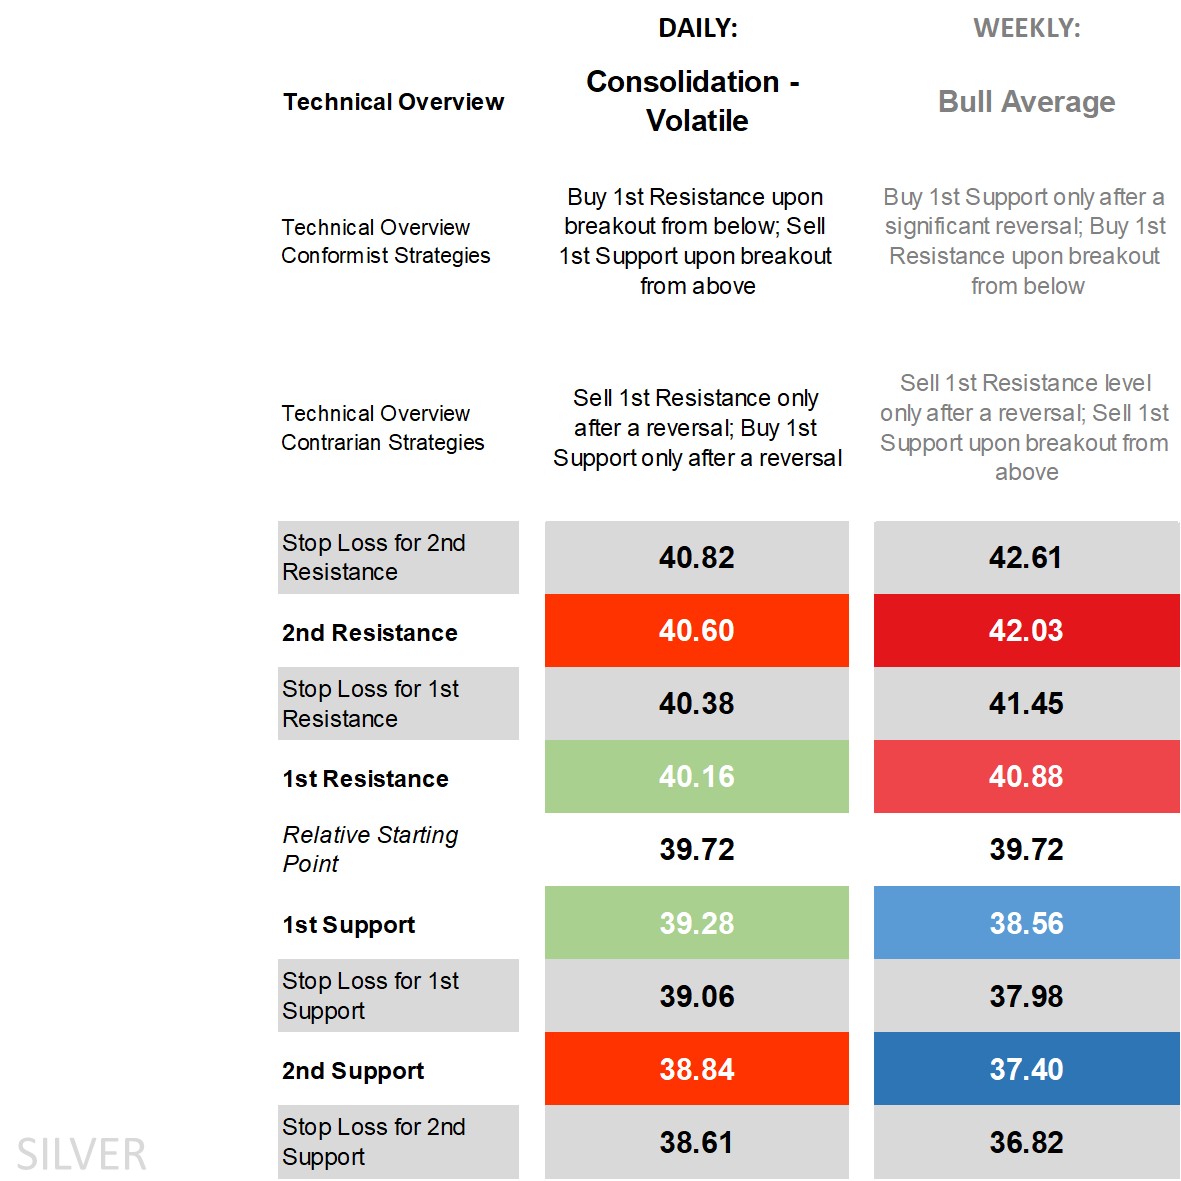
Silver’s technical overview, strategies and levels
Relative oscillations prior to the moves we got over the past few trading sessions have made it easy to tilt the technicals green on the shorter-term time frames. Looking at the daily time frame and price is now above all its main main moving averages (MA) and walking the upper end of the Bollinger Band, on the DMI (Directional Movement Index) front a big margin for the +DI over the -DI more than enough to label it as ‘positive’, an RSI (Relative Strength Index) that just reached overbought territory, and an ADX (Average Directional Movement Index) rising but still far away from trending territory.
Easy to label its technical overview something bullish, but moves like this reaching key highs and simultaneously experiencing an uptick in volatility is usually more volatile, and in turn the overview remains ‘consolidation – volatile’ where shorter-term daily levels struggle to contain the outburst of volatility and in turn conformists strategies are in the conformist camp be it buying off the 1st Resistance or shorting the 1st Support while reversal strategies are reserved for contrarians, selling after a reversal off the 1st Resistance waiting for the level to breach first (as occurred earlier today) and buying only after a reversal off the 1st Support.
Zooming out to the weekly time frame and it remains ‘bull average’ with its key technical indicators flashing green as price moves up towards the upper end of the Bollinger Band, with a positive DMI, a trending ADX by one calculation and an RSI just shy of overbought territory. That means those who are conformists on the weekly time frame will aim for areas seeking to go long in line with the technical overview but ideally only after a significant reversal off the weekly 1st Support, while sell strategies are for contrarians who expect a reversal off these levels.
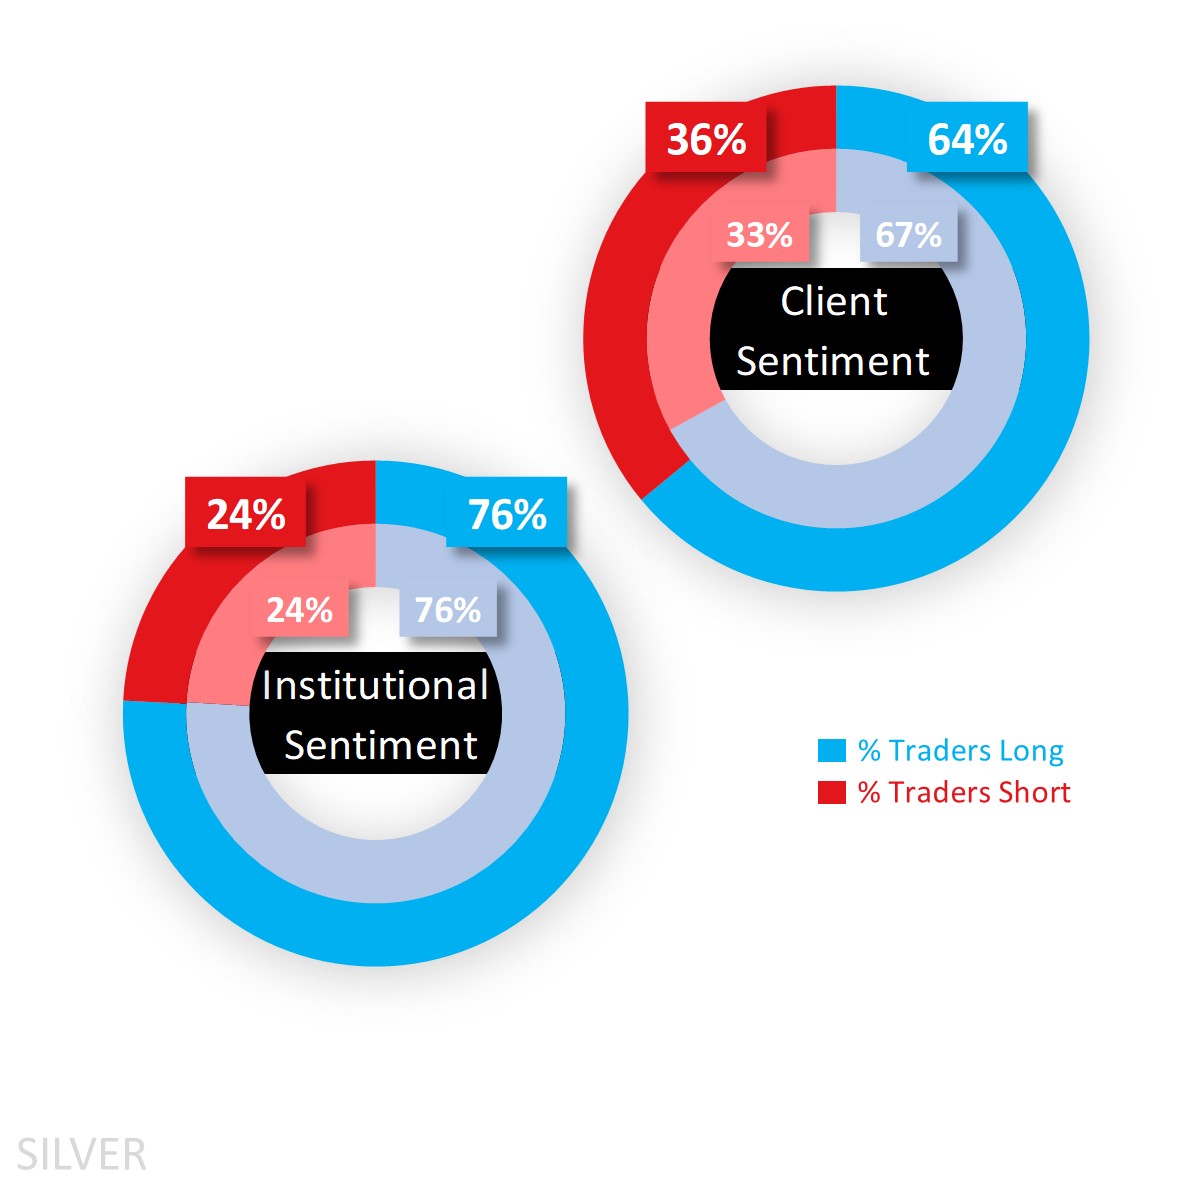
Capital.com’s client sentiment for Silver
It’s been a consistent story of majority buy sentiment among our clients, but the latest move has enticed some longs into closing out and some shorts into initiating, causing the bias to fall out of heavy buy territory to 64% at the start of this week from 67% last Friday.
CoT speculators are also net long but have opted to remain in heavy buy territory and only a couple notches shy of extreme long, holding at 76% with an increase in longs (by 125 lots) not too different from the rise in shorts (by 208).
Client sentiment mapped on the daily chart
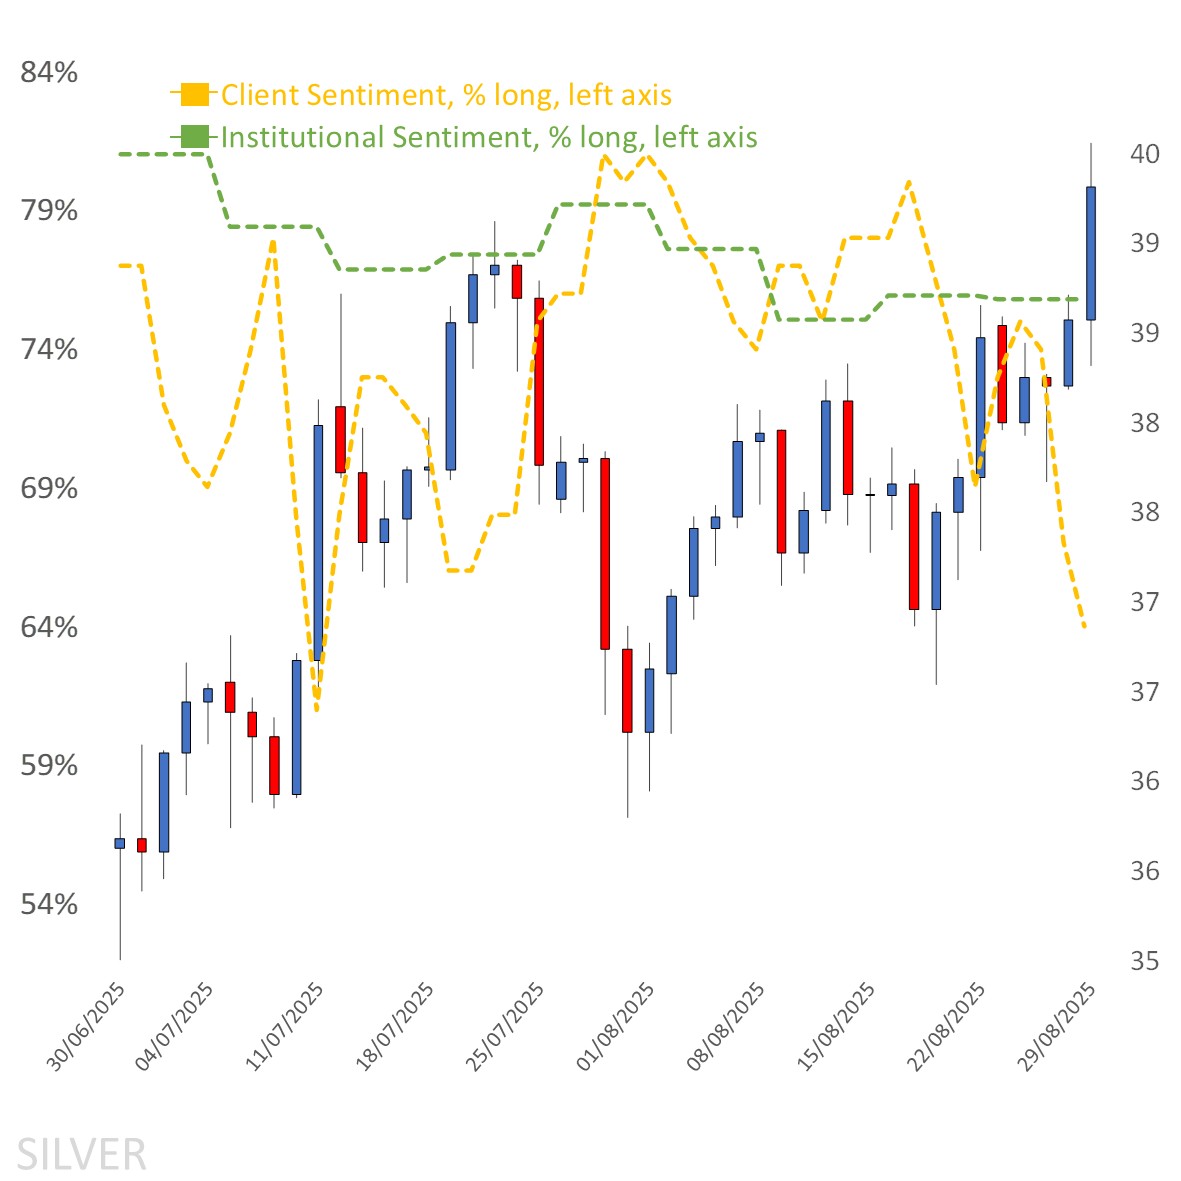
Source: Capital.com
Period: JUNE 2025 – AUGUST 2025
Past performance is not an indicator of future results.
Silver’s chart on Capital.com platform with key technical indicators
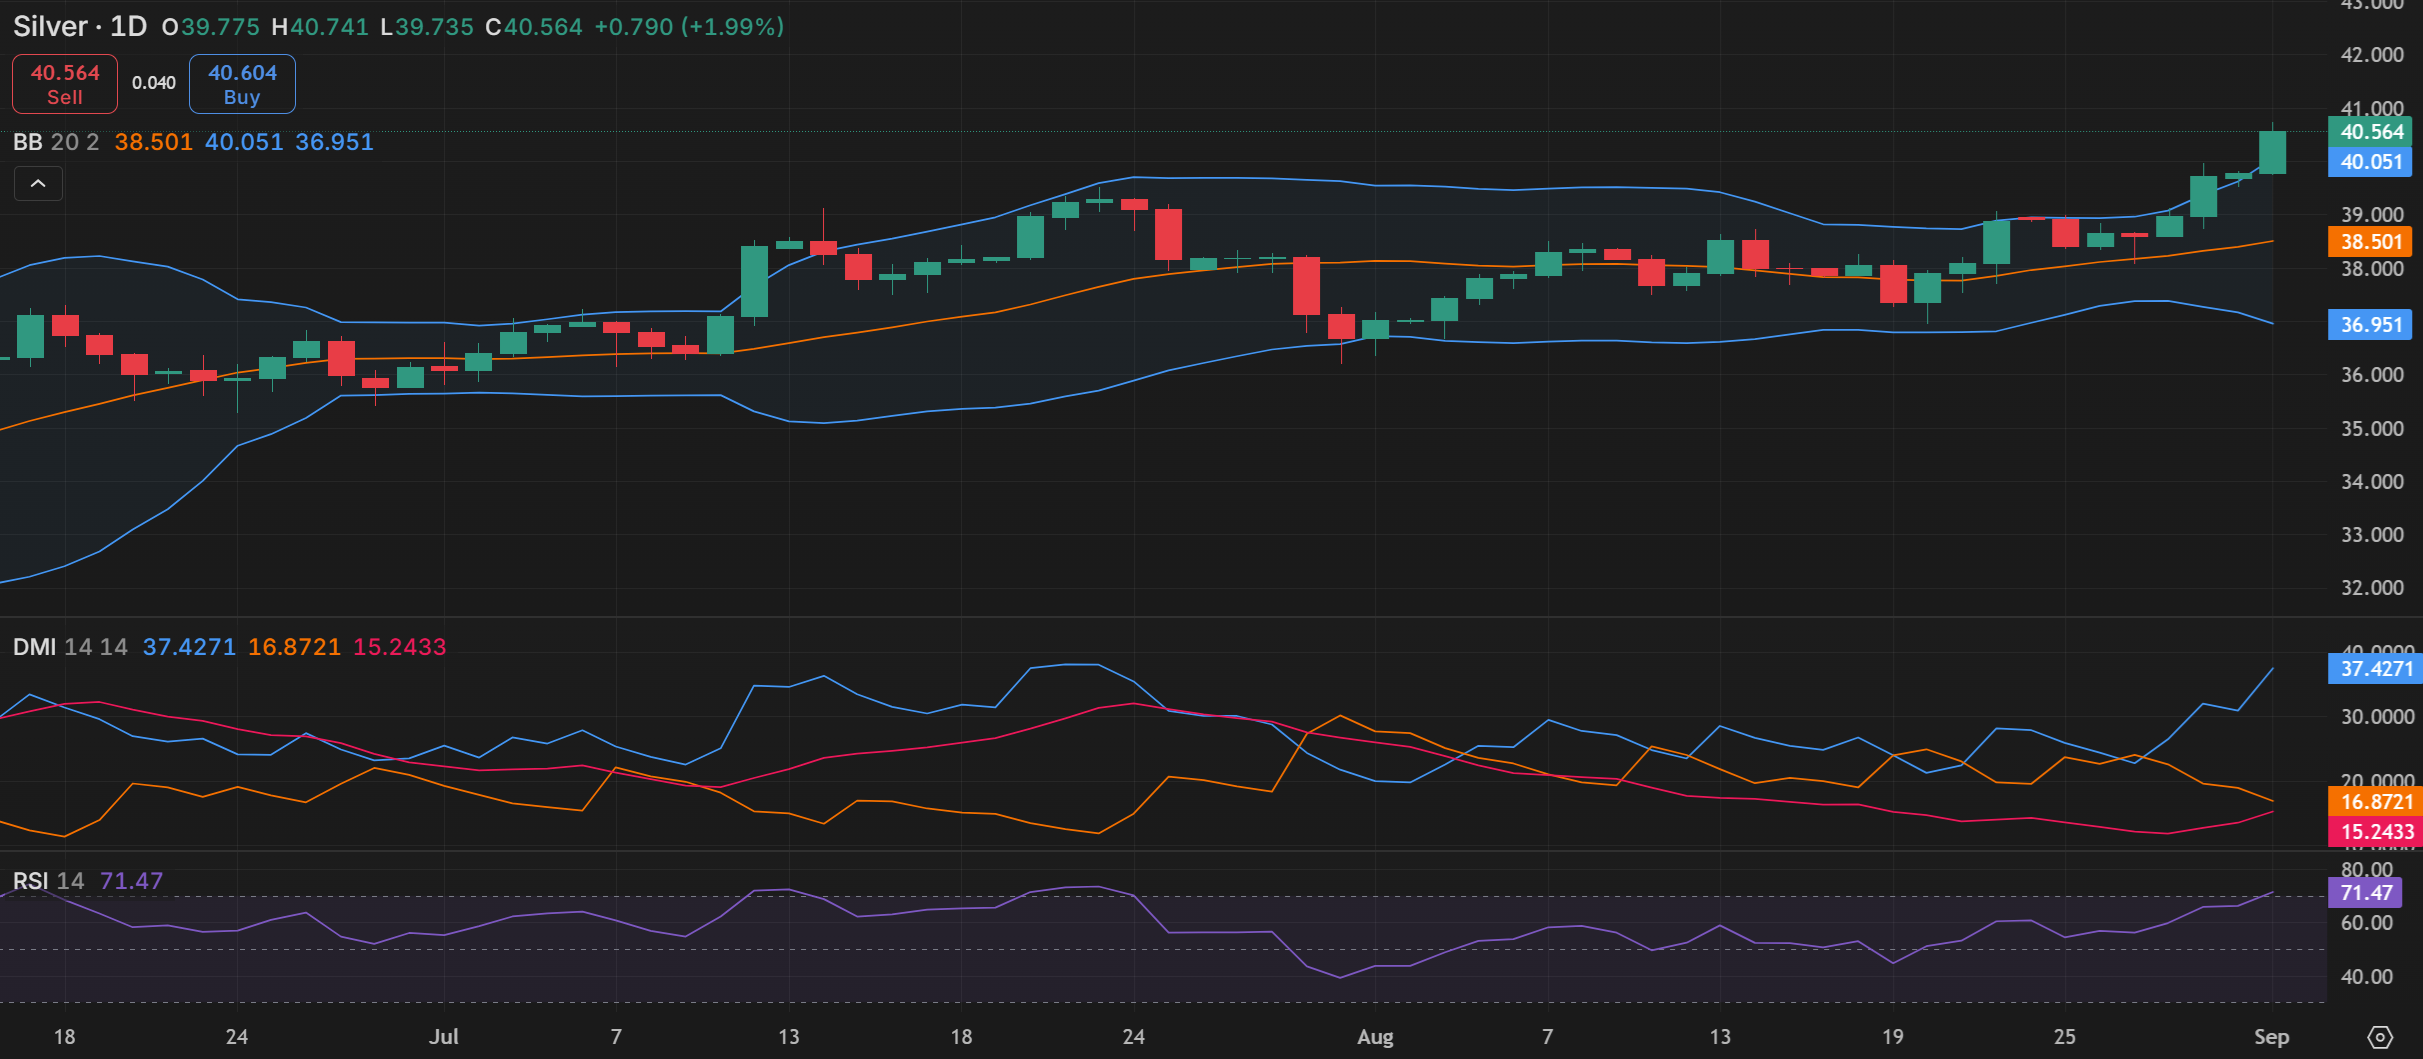
Source: Capital.com
Period: JUNE 2025 – AUGUST 2025
Past performance is not an indicator of future results.